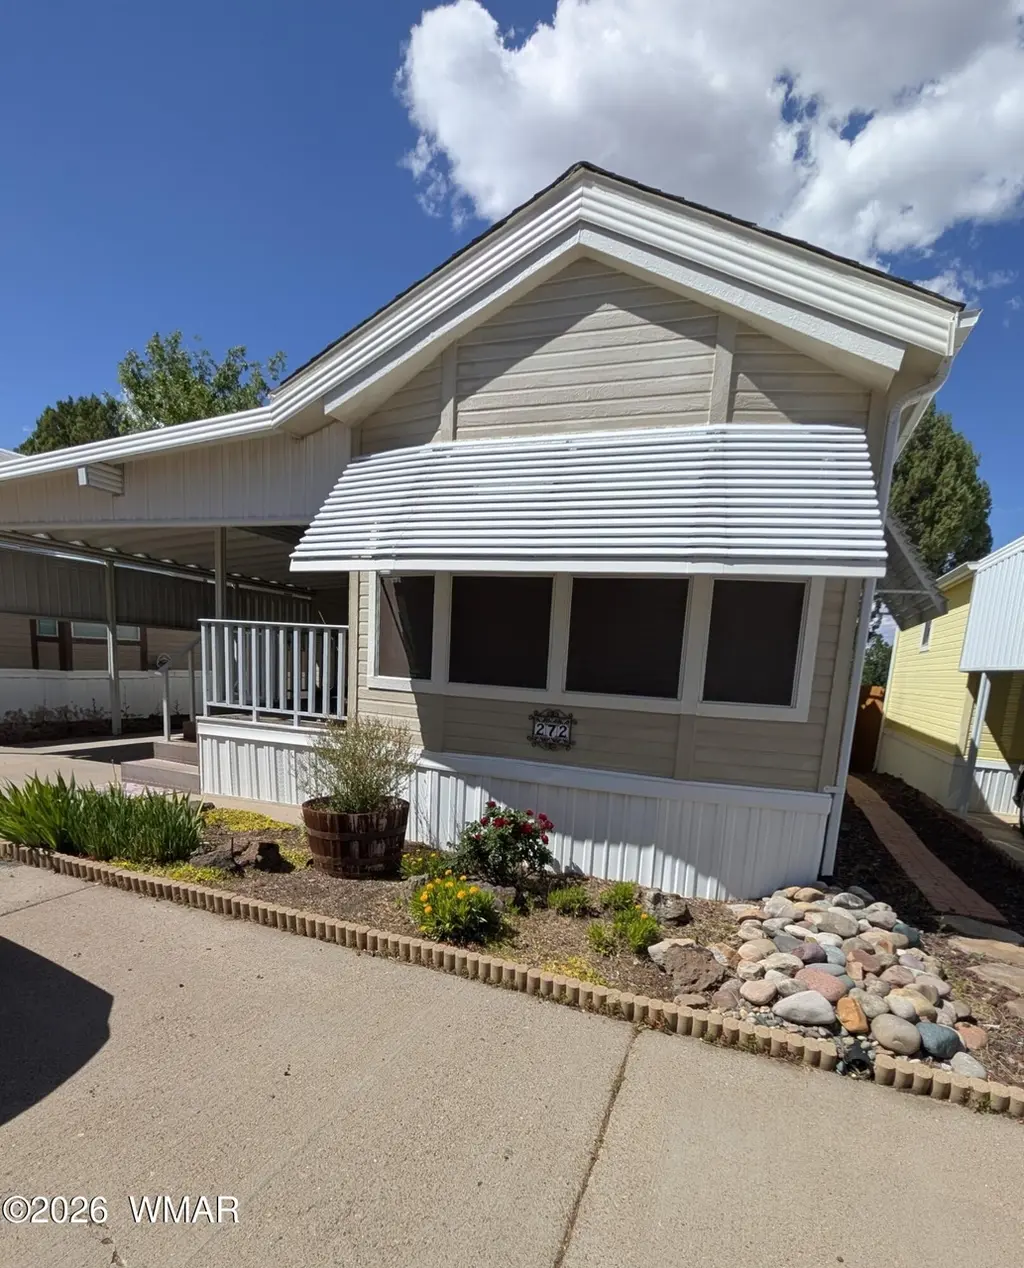
270 N Clark Rd #272 · Show Low, AZ
Flood risk 1/10 · Minimal
- FEMA flood zone
- X (unshaded)
- Chance of flooding over 30 yrs
- 0.0%
- Est. flood insurance / yr
- $507 – $1,088
Fire risk 6/10 · Moderate
- Est. fire insurance / yr
- $610 – $1,132
Heat risk 2/10 · Minimal
- Hot days now (above 89°F)
- 7 days/yr
- Hot days in 30 yrs
- 19 days/yr
Wind risk 1/10 · Minimal
- Chance of severe wind over 30 yrs
- —
Air-quality risk 1/10 · Minimal
- Unhealthy air days now
- 0 days/yr
- Unhealthy air days in 30 yrs
- 0 days/yr
Risk factors via First Street. Map © Google.
Why this score? — see what drove the B- grade
The composite is a weighted blend of 9 inputs, each scored 0–100. Each bar is that input's sub-score; the figure is the points it added to the 100-point composite (weight × sub-score).
- Cash flow +30.0/30.0
- 1% rule +10.0/10.0
- DSCR +10.0/10.0
- ARV discount +7.5/15.0
- Condition / age +3.8/5.0
- Livability +3.2/5.0
- Schools +3.0/10.0
- Rent growth +2.5/5.0
- Appreciation +0.0/10.0
$55,000
🖨 Deal sheet 📄 Offer letter ✓ Due diligence
Listing remarks
Turnkey 1BR/1BA Park Model in Venture In Park (55+ Seasonal). Pristine & upgraded with Arizona room, office/workroom, W/ D, high-end furniture, granite counters, skylights, central A/C. Carport, front/back decks, BBQ, pavers, fenced. 2026 lot rent PAID ($6,300/year). Free city pool/spa pass. Miles of trails, golf, casino, ski resort, lakes, newer reginal hospital. Leave the heat behind! Hurry.
Key facts
- Arizona room
- Carport
- Central a c
Tags
Property features AI
Finance
- Other: Directions: From 60/260 head toward Payson. Turn left into Venture In. Turn right, sign on right. #272
- Financial info: Lease land fee: $6,300 yearly
- HOA & community: No HOA; Community amenities include clubhouse, exercise facility, laundry; rental restrictions and short-term rentals noted; 55+ community
Exterior
- Parking: Attached carport (1 space)
- Utilities: Public sewer; Metered water available; Individual electric meter; Propane available (tank leased); Bottled gas available; Cable TV available; Navopache service listed
- Home design: Park model / RV residential type; Manufactured construction; Park model designation; Located in Venture In RV subdivision, unit #272; Located on private maintained road; Lease land (yearly)
- Construction: Manufactured construction; Pitched shingle roof; Builder: Cavco
- Exterior features: Deck; Covered deck with awning(s); Drip irrigation system; Landscaped lot; Grill; Tall pines on lot; In the trees setting; Street is paved; Wood fence; Private adjoining property
Interior
- Kitchen: Disposal; Gas range; Microwave; Pantry; Refrigerator
- Bedrooms: Arizona room (listed as potential bedroom)
- Flooring: Carpet; Plank; Vinyl
- Bathrooms: Full bathroom with shower
- Heating & cooling: Electric forced-air heating; Central air conditioning; Electric water heater
- Interior features: Smoke detector; No fireplace
- Laundry & utility: Washer and dryer in utility room
Neighborhood map
What this means for you Summary
Snapshot
- This is a 1-bed/1.0-bath single-family listed at $55k. Condition is rated good.
Deal economics
- At list price, monthly cash flow is $728 ($9k/yr) — positive.
- The deal already cash-flows at list — no discount required.
- Meets the 1% rule at list price ($1k rent vs $55k).
- Cap rate 22.2% vs local median 3.3% in Show Low — top-decile yield for the area; either an underpriced asset or a hidden risk that comps aren't pricing in. Stress-test before assuming the spread holds.
Location & tenants
- Location reads 65/100 on livability (#90 in AZ) — a middle-class / working-renter tenant base. Strengths: cost of living A+, housing A+; Watch: employment D, crime F, amenities F.
- Show Low Unified District (4393) (rural): math 32% / reading 39% proficiency, ranked #89 of 249 in AZ (top 36%) — families likely to look elsewhere, expect single-tenant / working-renter base with shorter leases.
- Market conditions: 891 active listings in the ZIP; 485 units permitted in Navajo County in 2024 (11 in 5+ unit buildings).
Forward outlook
- Local home prices are declining (-3.0%/yr); year-one equity from $380 of loan paydown is wiped out by about $2k of value loss. Plan a longer hold.
- Navajo County population projected at -16% by 2050 — secular population decline; favor cash flow + early exit over multi-decade hold.
- At projected returns (-3.0% appreciation + 3.0% rent growth), your $15k cash investment doubles in ~3 years — after that, you're playing with house money.
Negotiation context
- Only 10 days on market — expect competitive offers; lowballing is unlikely to land.
Risks & watch-outs
- Climate carrying-cost: major wildfire risk — expect insurance premiums to compound above CPI over the hold.
Questions for the listing agent
- Is there a deadline driving the sale (1031 exchange, divorce, estate, relocation)? That informs how much negotiation room exists.
- Schools are B-rated — typically a magnet for longer-tenancy family renters. What's the average tenant stay here, and is there a school-zone premium baked into asking?
- Crime grade is F in this area — have there been break-ins, vandalism, or insurance claims at this property in the last 3 years? What carrier currently insures it and at what premium?
- What's the average days-on-market for RENTAL listings here right now (not sales)? A rising rental-DOM trend means longer vacancies and softer asking-rent achievability than the comps imply.
- What's the recent tenant-quality profile in this submarket — average credit score on applications, eviction rate, late-payment / NSF rate, and stable-employment percentage? A property-management company in the area should have these aggregated.
- How much new for-sale + rental construction is in the pipeline within 1–3 miles? Heavy new supply typically softens prices + rents 12–24 months out; constrained supply supports both.
Investment metrics
- 1% rule
- 2.55% ✓
- Cap rate
- 22.17%
- Cash-on-cash
- 56.69%
- DSCR
- 3.52
- GRM
- 3.3
CMA / ARV
- ARV (on-the-fly)
- $24,040
- Comps found
- 1
Show comp detail 1 sale within ~0.75 mi
| Address | Dist | Beds/Ba | Sqft | Sold | Price | $/sf | Match |
|---|---|---|---|---|---|---|---|
| 270 N Clark Rd #224 | 0.15mi | 1/1.0 | 670 (+12%) | 3mo | $27,000 | $40 | 71 |
Match score weights: distance 35% · size 25% · config 20% · recency 20%. Top-matched comps best support the ARV.
Projected returns pro-forma
-3.0% appreciation · 3.0% rent growth · sell at horizon
- IRR
- 55.1%
- Equity multiple
- 3.43×
- Total profit
- $37,448
- Equity at exit
- $8,201
- IRR
- 60.2%
- Equity multiple
- 7.00×
- Total profit
- $92,365
- Equity at exit
- $4,755
Cash invested: $15,400 (down + closing). Projections, not guarantees.
Landlord ↔ Tenant lean methodology
- Overall (STATE)
- 87 Strongly Landlord-Friendly
- State Arizona
- 87 Strongly Landlord-Friendly · R+3
- County
- — inherits STATE
- City
- — inherits STATE
ZIP-level market 85901
- Home prices YoY
- -14.5%
- Active inventory
- 891
- Price-to-rent
- 3.3×
Monthly cashflow live
- Estimated rent
- $1,402 medium interval (Pro) →
- Mortgage (P&I)
- −$288
- Tax est. 1.5%
- −$69 /mo · $825/yr
- Insurance
- −$23
- HOA
- −$0
- Vacancy / Maint / Mgmt
- −$294
- Net cashflow
- $728
Break-even live
UW: 25.0% down · 7.5% · 30yr · 1.5% tax · 5.0% vac · 8.0% maint · 8.0% mgmt
Financing live
Cash to close
- Down payment
- $13,750
- Closing costs
- $1,650
- Reserves months
- —
- Total cash needed
- —
Loan-product check · same deal, 3 products live
Conventional
25% down · 7.5% · 30yr
- Down + closing
- —
- Monthly P&I
- —
- Monthly cashflow
- —
- DSCR
- —
- Eligible?
- —
Personal DTI + credit; lowest rate.
DSCR
20% down · 8.5% · 30yr
- Down + closing
- —
- Monthly P&I
- —
- Monthly cashflow
- —
- DSCR
- —
- Eligible?
- —
No personal income docs; deal must DSCR.
Hard money
10% down · 12.0% · 12mo
- Down + closing
- —
- Monthly P&I
- —
- Monthly cashflow
- —
- DSCR
- —
- Eligible?
- —
Short-term bridge; refi at stabilization.
Listing history 10 events
-
2026-06-19days on market $55,000 Active 10 DOM
-
2026-06-18days on market $55,000 Active 9 DOM
-
2026-06-17days on market $55,000 Active 8 DOM
-
2026-06-16days on market $55,000 Active 7 DOM
-
2026-06-16status $55,000 Active 6 DOM
-
2026-06-15statusdays on market $55,000 Pending 6 DOM
-
2026-06-14days on market $55,000 Active 5 DOM
-
2026-06-12days on market $55,000 Active 4 DOM
-
2026-06-08remarks 398-char remark
-
2026-06-08$55,000 Active 1 DOM
ⓘ Source: listings_history table (triggers on properties + properties_extension) + one-shot
backfill from property_details.listing_events for pre-trigger history.
Climate risk First Street
- Flood 1/10 Low FEMA zone X (unshaded) · 0% chance over 30 yrs
- Wildfire 6/10 Major
- Heat 2/10 Low 7 d/yr ≥89°F today · 19 d/yr by 30 yrs out
- Wind 1/10 Low
- Air quality 1/10 Low 0 unhealthy d/yr today · 0 by 30 yrs out
Nearby sold comps map
Loading sold comps map…
Walkable amenities ~0.75 mi
Loading nearby amenities…
Taxation est. · year 1
- Rental income
- $16,825
- − Mortgage interest
- −$3,081
- − Property taxes
- −$825
- − Insurance
- −$275
- − Repairs & maintenance
- −$1,346
- − Management
- −$1,346
- − Depreciation
- −$1,600
- Taxable income
- $8,352
- Est. tax owed @ 24.0%
- −$2,005
- After-tax cash flow
- $6,726/yr
For passive investors: Depreciation is non-cash, so a rental often shows a tax loss while cash-flowing — sheltering income. Rental losses are passive: they offset passive income freely, and up to $25,000/yr can offset ordinary (W-2) income if you actively participate and your MAGI is under $100k (phasing out to $0 by $150k); unused losses carry forward. On sale, claimed depreciation is recaptured at up to 25%, and gains may owe capital-gains tax (a 1031 exchange can defer both). Figures are a year-1 estimate at your 24.0% rate — not tax advice; consult a CPA.
Condition & rehab AI · 12 photos
This 1BR/1BA park model is in good condition with cosmetic updates needed to enhance its resale and rental value.
Repairs flagged
- Minor Kitchen cabinets — Aesthetic update needed
- Minor Bathtub and fixtures — Update needed for a fresh look
Value-add opportunities
- Both Paint interior walls — Fresh paint enhances curb appeal and interior aesthetics
- Both Replace kitchen cabinets — Modern cabinets improve functionality and resale value
- Both Replace bathtub and fixtures — Upgraded bathroom fixtures increase both resale and rental value
Renovation cost estimate screening
| Repair item | Severity | Est. cost |
|---|---|---|
| Kitchen cabinets · Aesthetic update needed | Minor | $500–3,000 |
| Bathtub and fixtures · Update needed for a fresh look | Minor | $500–3,000 |
| Total estimated repair cost · 2 items | $1,000–6,000 |
Value-add ROI direction
- Both Paint interior walls — Fresh paint enhances curb appeal and interior aesthetics ↑
- Both Replace kitchen cabinets — Modern cabinets improve functionality and resale value ↑
- Both Replace bathtub and fixtures — Upgraded bathroom fixtures increase both resale and rental value ↑
ⓘ Cost ranges are severity-bucket heuristics (US national rule-of-thumb). Get contractor quotes + a written scope before underwriting a rehab budget.
Schools (NCES district)
- District
- Show Low Unified District (4393)
- NCES district ID
- 0407700
- Math proficiency
- 32% ▼ -9.00%
- Reading proficiency
- 39% ▼ -4.00%
- Median HH income
- $41,240
- Composite
- 29.9/100
- National rank
- #6387
- State rank
- #89 of 249 in AZ
Livability — Show Low
- Score
- 65/100
- State rank
- #90
- US rank
- #13573
Category grades
Schools grade is shown separately in the Schools card above.
Census & demographics
- Census place
- Show Low, AZ
- City population
- 18,821
- Population (ZIP)
- 18,821
Population outlook (Navajo County) Hauer SSP2
- Today (2025)
- 105,760 people
- By 2030
- 103,301 · -2.3%
- By 2040
- 97,070 · -8.2%
- By 2050
- 88,850 · -16.0%
- By 2075
- 65,180 · -38.4%
- By 2100
- 37,281 · -64.7%
Race, ethnicity, and origin ACS 2023
- Neighborhood character
- Predominantly White (77%)
- Race & ethnicity
- White 77% Hispanic / Latino 16% Two or more races 11% Native American 2%
- Hispanic origin (detail)
- Mexican 12%
- Common ancestry
- Slovak 2% Lithuanian 2% Italian 2%
- Foreign-born
- 4% · Canada
- Languages at home
- 92% English-only · Spanish 7% Tagalog/Filipino 1%
Political lean MEDSL · Navajo
- 2024 margin
- R (+17.2) · D 40.9% · R 58.1%
- 2008→2024 swing
- -5.5pp toward R · 2008: -11.7pp · 2024: -17.2pp
- All cycles
- 2024: R+17.2 2020: R+8.2 2016: R+7.9 2012: R+8.4 2008: R+11.7
Not yet ingested
- Civics
- —
Market trends
- HPI YoY
- ▼ -65.52%
- Current HPI
- 386.3007
- Rent YoY
- —
- Metro
- —
- State GDP YoY
- ▲ 4.54%
- F500 in state
- 20
Industry mix (Fortune 500 HQ in AZ)
| Industry | F500 HQs | Revenue |
|---|---|---|
| Technology | 2 | $13B |
|
||
| Mining / Metals | 1 | $23B |
|
||
| Environmental Services | 1 | $16B |
|
||
| Metals / Steel | 1 | $14B |
|
||
| Technology Distribution | 1 | $9B |
|
||
| Homebuilding | 1 | $8B |
|
||
Price history
1 event — show timeline
- 2026-06-08 Listed $55,000 WMMLS
Cash-flow waterfall
monthlySold comps — $/sqft
last 12 mo · ≤1 miLoading sold comps…