3125 N Mckinley Ave · Oklahoma City, OK
Flood risk 1/10 · Minimal
- FEMA flood zone
- X (unshaded)
- Chance of flooding over 30 yrs
- 0.0%
- Est. flood insurance / yr
- $507 – $1,088
Fire risk 1/10 · Minimal
- Est. fire insurance / yr
- $2,463 – $4,575
Heat risk 6/10 · Moderate
- Hot days now (above 107°F)
- 7 days/yr
- Hot days in 30 yrs
- 19 days/yr
Wind risk 2/10 · Minimal
- Chance of severe wind over 30 yrs
- 3.0%
Air-quality risk 2/10 · Minimal
- Unhealthy air days now
- 1 days/yr
- Unhealthy air days in 30 yrs
- 2 days/yr
Risk factors via First Street. Map © Google.
Why this score? — see what drove the C grade
The composite is a weighted blend of 9 inputs, each scored 0–100. Each bar is that input's sub-score; the figure is the points it added to the 100-point composite (weight × sub-score).
- Cash flow +24.3/30.0
- DSCR +7.8/10.0
- ARV discount +7.5/15.0
- 1% rule +5.0/10.0
- Livability +4.0/5.0
- Rent growth +3.6/5.0
- Condition / age +2.5/5.0
- Schools +0.7/10.0
- Appreciation +0.0/10.0
$180,000
🖨 Deal sheet 📄 Offer letter ✓ Due diligence
Listing remarks
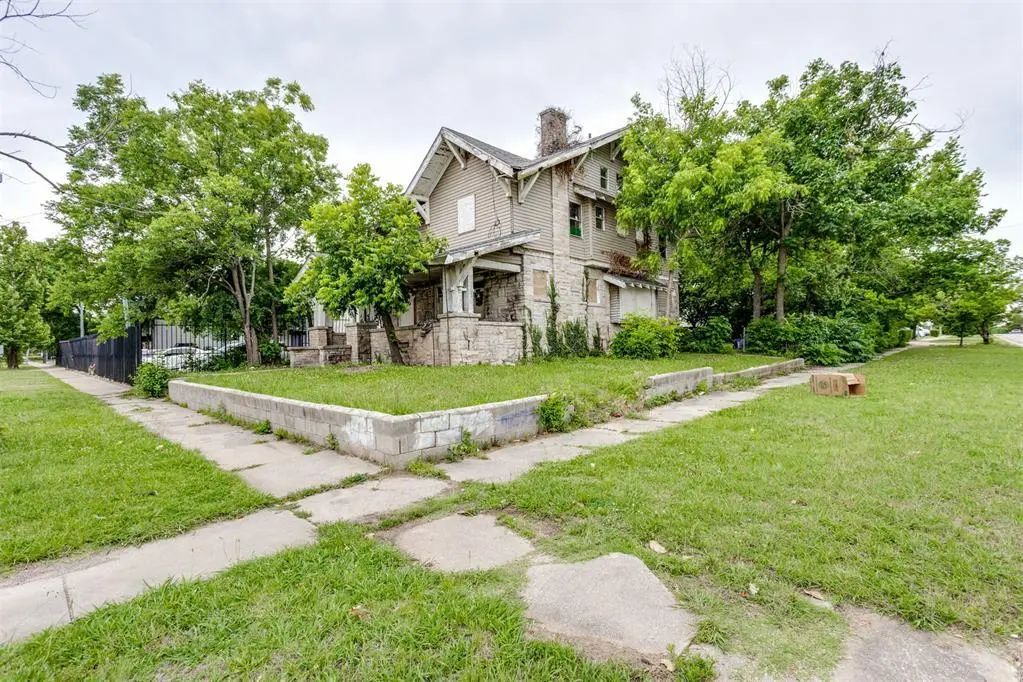
Rare opportunity to restore a 1920 two-story home full of original architectural character. The standout is the substantial native-stone exterior: massive stone porch piers, built-in stone porch benches, and a deep covered front porch beneath exposed-rafter, timber-bracket gables. Approximately 2,146 square feet sits on a 0.18-acre lot shaded by mature trees, with a stone retaining wall framing the front yard and a generous fenced backyard. A rear exterior staircase provides separate access to the upper level. Sold AS-IS. The home is vacant and needs a full renovation, making it ideal for an investor, builder, or an owner ready to create their dream home. The seller makes no representation
Key facts
- Stone retaining wall
- 8,002 sq ft lot
- Built 1920
Tags
Property features AI
Finance
- Other: Located in Aurelius Sub Add; Tax amount listed (not included per instructions)
- Financial info: Listing offered as-is; financing options include cash, conventional, FHA or VA; Loan qualification allowed; Property not assumable
- HOA & community: No mandatory association dues
Exterior
- Home design: Single-family residence; Two levels; Existing property
- Construction: Stone construction; Composition roof; Built with conventional foundation
- Exterior features: Corner lot; No exterior features listed
Interior
- Bedrooms: 3 bedrooms
- Bathrooms: 2 full bathrooms, 1 half bathroom
- Heating & cooling: No heating system specified; No cooling system specified; Conventional foundation
- Interior features: One living area; Vacant
Neighborhood map
What this means for you Summary
Snapshot
- This is a 3-bed/3.0-bath other listed at $180k.
Deal economics
- At list price, monthly cash flow is $362 ($4k/yr) — positive.
- The deal already cash-flows at list — no discount required.
- Meets the 1% rule at list price ($2k rent vs $180k).
- Cap rate 8.7% vs local median 3.7% in Oklahoma City — top-decile yield for the area; either an underpriced asset or a hidden risk that comps aren't pricing in. Stress-test before assuming the spread holds.
Location & tenants
- Location reads 80/100 on livability (#3 in OK, #1,635 nationally) — a professional / high-income tenant draw. Strengths: amenities A+, commute A+, cost of living A+; Watch: crime F.
- Oklahoma City (urban): math 7% / reading 10% proficiency, ranked #254 of 270 in OK (top 94%) — low school quality limits family demand, transient renter base, plan for 1-2y turnover; 82% free/reduced lunch — lower-income household profile, screen leases tightly.
- Zoned schools: Eugene Field Es (math 12% / reading 12%, grade F, #667 of 845 statewide, top 82%, 420 students, 0% FRL); Douglass Hs (math 2% / reading 2%, grade F, #445 of 447 statewide, top 100%, 556 students, 0% FRL) — zoned schools average 0% FRL vs 82% district-wide (82 pts lower); this property's tenant base skews higher-income than the district average.
- Market conditions: Rents rising fast (+4.5%/yr); 184 active listings in the ZIP; 28 comparable units currently listed for rent nearby; rentals lingering (median 44d on market — plan ~5-8 weeks vacancy on turnover, expect pricing pressure); 54% of comp listings sitting > 30 days — soft ceiling on asking rent; 5,365 units permitted in Oklahoma County in 2024 (569 in 5+ unit buildings).
- This rent runs 31% of the median local income ($70k/yr) — at the standard rent-burdened threshold; future hikes will face affordability resistance.
Forward outlook
- Local home prices are declining (-3.0%/yr); year-one equity from $1k of loan paydown is wiped out by about $5k of value loss. Plan a longer hold.
- Oklahoma County population projected at +41% by 2050 — long-run rental-demand tailwind backs the buy-and-hold thesis.
- At projected returns (-3.0% appreciation + 4.5% rent growth), your $50k cash investment doubles in ~10 years — after that, you're playing with house money.
Negotiation context
- Only 11 days on market — expect competitive offers; lowballing is unlikely to land.
- 4 sale attempts since 26y ago with the ask held roughly flat each time — persistent listings suggest the price (not the market) is what's stuck; bring a comps-based counter.
- Current owner paid $22k; list at $180k implies a 718% gain — meaningful room to come down on a strong offer.
Risks & watch-outs
- Watch-outs: built in 1920 — expect roof / HVAC / electrical / plumbing capex.
- Climate carrying-cost: extreme-heat days projected 7→19/yr by 2055 (HVAC capex compounding) — expect insurance premiums to compound above CPI over the hold.
Questions for the listing agent
- Built in 1920 — when were the roof, HVAC, electrical panel, plumbing, and water heater last replaced?
- Is there a deadline driving the sale (1031 exchange, divorce, estate, relocation)? That informs how much negotiation room exists.
- Schools are F-rated, which usually means shorter tenancies and higher turnover. Who's the typical renter profile here, and what's been the actual vacancy rate?
- Crime grade is F in this area — have there been break-ins, vandalism, or insurance claims at this property in the last 3 years? What carrier currently insures it and at what premium?
- What's the average days-on-market for RENTAL listings here right now (not sales)? A rising rental-DOM trend means longer vacancies and softer asking-rent achievability than the comps imply.
- What's the recent tenant-quality profile in this submarket — average credit score on applications, eviction rate, late-payment / NSF rate, and stable-employment percentage? A property-management company in the area should have these aggregated.
- How much new for-sale + rental construction is in the pipeline within 1–3 miles? Heavy new supply typically softens prices + rents 12–24 months out; constrained supply supports both.
Investment metrics
- 1% rule
- 1.00% ✓
- Cap rate
- 8.70%
- Cash-on-cash
- 8.61%
- DSCR
- 1.38
- GRM
- 8.3
CMA / ARV
No comps found within radius.
Projected returns pro-forma
-3.0% appreciation · 4.45% rent growth · sell at horizon
- IRR
- -1.8%
- Equity multiple
- 0.93×
- Total profit
- $-3,537
- Equity at exit
- $26,839
- IRR
- 9.2%
- Equity multiple
- 1.75×
- Total profit
- $37,554
- Equity at exit
- $15,563
Cash invested: $50,400 (down + closing). Projections, not guarantees.
Landlord ↔ Tenant lean methodology
- Overall (STATE)
- 83 Strongly Landlord-Friendly
- State Oklahoma
- 83 Strongly Landlord-Friendly · R+20
- County
- — inherits STATE
- City
- — inherits STATE
ZIP-level market 73118
- Rents YoY
- 4.5%
- Active inventory
- 184
- Price-to-rent
- 8.3×
Monthly cashflow live
- Estimated rent
- $1,807 high interval (Pro) →
- Mortgage (P&I)
- −$944
- Tax from tax record
- −$47 /mo · $559/yr
- Insurance
- −$75
- HOA
- −$0
- Vacancy / Maint / Mgmt
- −$379
- Net cashflow
- $362
Break-even live
UW: 25.0% down · 7.5% · 30yr · 1.5% tax · 5.0% vac · 8.0% maint · 8.0% mgmt
Financing live
Cash to close
- Down payment
- $45,000
- Closing costs
- $5,400
- Reserves months
- —
- Total cash needed
- —
Loan-product check · same deal, 3 products live
Conventional
25% down · 7.5% · 30yr
- Down + closing
- —
- Monthly P&I
- —
- Monthly cashflow
- —
- DSCR
- —
- Eligible?
- —
Personal DTI + credit; lowest rate.
DSCR
20% down · 8.5% · 30yr
- Down + closing
- —
- Monthly P&I
- —
- Monthly cashflow
- —
- DSCR
- —
- Eligible?
- —
No personal income docs; deal must DSCR.
Hard money
10% down · 12.0% · 12mo
- Down + closing
- —
- Monthly P&I
- —
- Monthly cashflow
- —
- DSCR
- —
- Eligible?
- —
Short-term bridge; refi at stabilization.
Rent comps 28 comps
| Address | Beds | Baths | Sqft | Rent | $/sqft | DOM | Units | Dist |
|---|---|---|---|---|---|---|---|---|
| 1832 NW 33rd St Oklahoma City, OK | 4.0 | 2.0 | 1464 | $1,700 | $1.16 | 43d | 1 | 0.39mi |
| 1220 NW 36th St Oklahoma City, OK | 3.0 | 2.0 | 1595 | $1,595 | $1.00 | 43d | 1 | 0.43mi |
| 1008 NW 34th St Unit 1 Oklahoma City, OK | 2.0 | 1.0 | 1400 | $1,450 | $1.04 | 43d | 1 | 0.49mi |
| 1400 NW 25th St Unit 2515-200 Oklahoma City, OK | 3.0 | 2.5 | 1600 | $1,595 | $1.00 | 43d | 1 | 0.49mi |
| 1100 NW 27th St Unit 1100 Oklahoma City, OK | 3.0 | 2.0 | 1500 | $1,195 | $0.80 | 23d | 1 | 0.51mi |
| 1600 NW 38th St Oklahoma City, OK | 3.0 | 2.0 | 1850 | $2,400 | $1.30 | 2d | 1 | 0.55mi |
| 2004 NW 28th St Oklahoma City, OK | 2.0 | 1.0 | 1425 | $1,195 | $0.84 | 43d | 1 | 0.56mi |
| 2301 N Florida Ave Oklahoma City, OK | 2.0 | 1.5 | 1700 | $1,235 | $0.73 | 17d | 1 | 0.68mi |
| 711 W Hill St Unit 1 Oklahoma City, OK | 3.0 | 2.0 | 1440 | $1,765 | $1.23 | 3d | 1 | 0.70mi |
| 1302 NW 22nd St Oklahoma City, OK | 3.0 | 2.0 | 1647 | $2,395 | $1.45 | 43d | 1 | 0.73mi |
| 1302 NW 22nd St Oklahoma City, OK | 3.0 | 2.5 | 1647 | $2,395 | $1.45 | 23d | 1 | 0.73mi |
| 4009 N Indiana Ave Oklahoma City, OK | 4.0 | 3.0 | 2132 | $2,695 | $1.26 | 43d | 1 | 0.74mi |
| 610 NW Eubanks St Oklahoma City, OK | 3.0 | 3.0 | 1680 | $2,200 | $1.31 | 23d | 1 | 0.82mi |
| 726 NW 24th St Oklahoma City, OK | 3.0 | 2.0 | 1485 | $1,599 | $1.08 | 2d | 1 | 0.85mi |
| 3633 N Youngs Blvd Oklahoma City, OK | 3.0 | 2.5 | 1404 | $1,450 | $1.03 | 4d | 1 | 0.93mi |
| 1721 NW 18th St Oklahoma City, OK | 3.0 | 2.0 | 1900 | $1,300 | $0.68 | 43d | 1 | 0.95mi |
| 1928 NW 18th St Oklahoma City, OK | 3.0 | 2.5 | 1914 | $2,200 | $1.15 | 43d | 1 | 1.06mi |
| 2915 N Harvey Pkwy Oklahoma City, OK | 3.0 | 1.0 | 1596 | $1,600 | $1.00 | 43d | 1 | 1.11mi |
| 224 NW 32nd St Oklahoma City, OK | 2.0 | 2.0 | 1516 | $1,995 | $1.32 | 14d | 1 | 1.15mi |
| 2813 N Robinson Ave Oklahoma City, OK | 2.0 | 1.0 | 1400 | $1,025 | $0.73 | 43d | 1 | 1.22mi |
| 2605 N Robinson Ave Oklahoma City, OK | 4.0 | 2.0 | 1813 | $1,850 | $1.02 | 43d | 1 | 1.25mi |
| 4501 N Youngs Blvd Oklahoma City, OK | 2.0 | 2.0 | 1665 | $1,550 | $0.93 | 43d | 1 | 1.33mi |
| 2139 NW 15th St Oklahoma City, OK | 3.0 | 2.0 | 1551 | $1,950 | $1.26 | 43d | 1 | 1.36mi |
| 2001 NW 13th St Oklahoma City, OK | 4.0 | 2.5 | 1800 | $2,500 | $1.39 | 23d | 1 | 1.40mi |
| 821 NW 48th St Oklahoma City, OK | 3.0 | 1.5 | 1735 | $2,100 | $1.21 | 4d | 1 | 1.41mi |
| 1211 N Ellison Ave Oklahoma City, OK | 4.0 | 2.0 | 1526 | $1,800 | $1.18 | 43d | 1 | 1.45mi |
| 1209 NW 11th St Oklahoma City, OK | 2.0 | 2.5 | 1400 | $1,795 | $1.28 | 17d | 1 | 1.48mi |
| 1209 NW 11th St Oklahoma City, OK | 2.0 | 2.5 | 1400 | $1,795 | $1.28 | 4d | 1 | 1.48mi |
Listing history 8 events
-
2026-06-18days on market $180,000 Active 11 DOM
-
2026-06-17days on market $180,000 Active 10 DOM
-
2026-06-16days on market $180,000 Active 9 DOM
-
2026-06-15days on market $180,000 Active 8 DOM
-
2026-06-13days on market $180,000 Active 6 DOM
-
2026-06-09days on market $180,000 Active 2 DOM
-
2026-06-08remarks 699-char remark
-
2026-06-08$180,000 Active 1 DOM
ⓘ Source: listings_history table (triggers on properties + properties_extension) + one-shot
backfill from property_details.listing_events for pre-trigger history.
Tax reassessment forecast OK · Resets to sale price
- Current annual tax
- $559 · $47/mo
- Projected year-2 tax
- $1,620 · $135/mo
- Expected delta
- +$1,061/yr (+$88/mo · 190.0%)
ⓘ Screening estimate from a state-policy table — verify with the county assessor before closing.
Climate risk First Street
- Flood 1/10 Low FEMA zone X (unshaded) · 0% chance over 30 yrs
- Wildfire 1/10 Low
- Heat 6/10 Major 7 d/yr ≥107°F today · 19 d/yr by 30 yrs out
- Wind 2/10 Low 3% chance of damaging wind over 30 yrs
- Air quality 2/10 Low 1 unhealthy d/yr today · 2 by 30 yrs out
Nearby sold comps map
Loading sold comps map…
Walkable amenities ~0.75 mi
Loading nearby amenities…
Taxation est. · year 1
- Rental income
- $21,680
- − Mortgage interest
- −$10,083
- − Property taxes
- −$559
- − Insurance
- −$900
- − Repairs & maintenance
- −$1,734
- − Management
- −$1,734
- − Depreciation
- −$5,236
- Taxable income
- $1,433
- Est. tax owed @ 24.0%
- −$344
- After-tax cash flow
- $3,997/yr
For passive investors: Depreciation is non-cash, so a rental often shows a tax loss while cash-flowing — sheltering income. Rental losses are passive: they offset passive income freely, and up to $25,000/yr can offset ordinary (W-2) income if you actively participate and your MAGI is under $100k (phasing out to $0 by $150k); unused losses carry forward. On sale, claimed depreciation is recaptured at up to 25%, and gains may owe capital-gains tax (a 1031 exchange can defer both). Figures are a year-1 estimate at your 24.0% rate — not tax advice; consult a CPA.
Schools (NCES district)
- District
- Oklahoma City
- NCES district ID
- 4022770
- Math proficiency
- 7% ▼ -5.00%
- Reading proficiency
- 10% ▼ -6.00%
- Median HH income
- $35,606
- Composite
- 7.0/100
- National rank
- #9970
- State rank
- #254 of 270 in OK
Livability — Oklahoma City
- Score
- 80/100
- State rank
- #3
- US rank
- #1635
Category grades
Schools grade is shown separately in the Schools card above.
Census & demographics
- Census place
- Oklahoma City, OK
- County
- Oklahoma County · 771,644 people
- City population
- 498,656
- Metro
- Oklahoma City, OK
- Population (ZIP)
- 14,262
- Household income
- $69,827
- Rent vs Own
- Severe rent burden
- 728.0
Population outlook (Oklahoma County) Hauer SSP2
- Today (2025)
- 911,875 people
- By 2030
- 982,413 · +7.7%
- By 2040
- 1,130,468 · +24.0%
- By 2050
- 1,288,422 · +41.3%
- By 2075
- 1,711,482 · +87.7%
- By 2100
- 2,088,448 · +129.0%
Race, ethnicity, and origin ACS 2023
- Neighborhood character
- Predominantly White (67%)
- Race & ethnicity
- White 67% Hispanic / Latino 14% Two or more races 13% Black 5% Asian 4% Native American 2%
- Hispanic origin (detail)
- Mexican 10%
- Common ancestry
- Slovak 5% Italian 4% Portuguese 3%
- Foreign-born
- 9% · Canada, Vietnam, Philippines
- Languages at home
- 87% English-only · Spanish 10% Vietnamese 1% Other Asian/Pacific 1%
Political lean MEDSL · Oklahoma
- 2024 margin
- Toss-up / Even · D 48.0% · R 49.7% · Other 2.3%
- 2008→2024 swing
- +15.1pp toward D · 2008: -16.8pp · 2024: -1.7pp
- All cycles
- 2024: R+1.7 2020: R+1.1 2016: R+10.5 2012: R+16.7 2008: R+16.8
Not yet ingested
- Civics
- —
Market trends
- HPI YoY
- ▼ -321.71%
- Current HPI
- 298.6106
- Rent YoY
- ▲ 4.45%
- Metro
- Oklahoma City, OK
- State GDP YoY
- ▲ 1.55%
- F500 in state
- 6
Industry mix (Fortune 500 HQ in OK)
| Industry | F500 HQs | Revenue |
|---|---|---|
| Energy | 3 | $48B |
|
||
Price history
+246.2% since first listed10 events — show timeline
- 2026-06-07 Listed $180,000 MLSOK
- 2020-06-13 Listing Removed — MLSOK
- 2019-12-12 Listed $156,000 MLSOK
- 2013-03-12 Listing Removed — MLSOK
- 2012-10-11 Listed $75,000 MLSOK
- 2001-06-22 Sold (MLS) $22,000 MLSOK
- 2001-05-23 Listing Removed — MLSOK
- 2000-03-09 Listed $22,000 MLSOK
- 1991-04-17 Sold (Public Records) $52,000 Public Records
- 1985-12-01 Sold (Public Records) $52,000 Public Records
Property tax history
+4.8%/yrLatest (2025): $559 · +4.1% YoY. Source: county tax records.
Cash-flow waterfall
monthlySold comps — $/sqft
last 12 mo · ≤1 miLoading sold comps…