227 Hornet St · Elgin, TX
Flood risk No data
- FEMA flood zone
- —
- Chance of flooding over 30 yrs
- —
- Est. flood insurance / yr
- —
Fire risk No data
- Est. fire insurance / yr
- —
Heat risk No data
- Hot days now (above threshold)
- —
- Hot days in 30 yrs
- —
Wind risk No data
- Chance of severe wind over 30 yrs
- —
Air-quality risk No data
- Unhealthy air days now
- —
- Unhealthy air days in 30 yrs
- —
Risk factors via First Street. Map © Google.
Why this score? — see what drove the D grade
The composite is a weighted blend of 9 inputs, each scored 0–100. Each bar is that input's sub-score; the figure is the points it added to the 100-point composite (weight × sub-score).
- Appreciation +10.0/10.0
- Cash flow +9.4/30.0
- ARV discount +5.3/15.0
- Livability +3.7/5.0
- Rent growth +3.3/5.0
- DSCR +2.6/10.0
- Condition / age +2.5/5.0
- 1% rule +2.1/10.0
- Schools +2.0/10.0
$351,490
🖨 Deal sheet (PDF) 📄 Offer letter ✓ Due diligence
Listing remarks
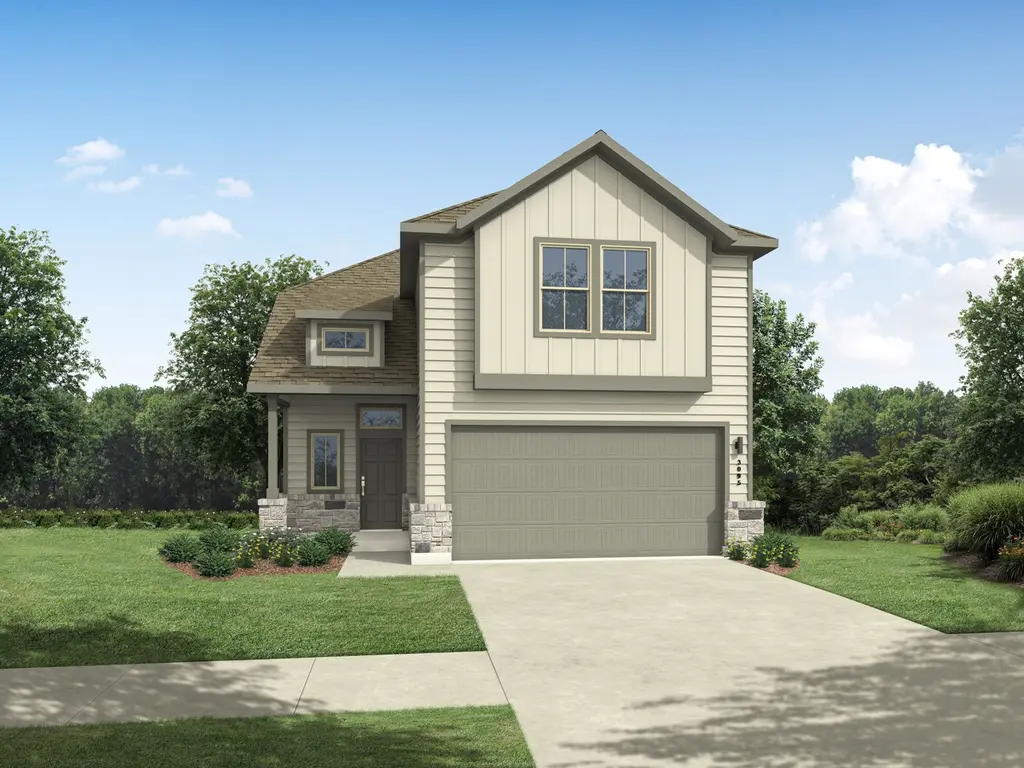
MLS# 3941372 Built by Trophy Signature Homes - June 2026 Completion! ~ The flexible Willow is everything you want in a home. An oversized study allows you to make quick work of office duties. Or convert one of the upstairs bedrooms into your office and turn the downstairs study into the ultimate bar. Set up an island with bar stools, stock up on liquor and invite guests to sip martinis. Drinks in hand, they can meander over to the beautiful family room, backlit by a wall of windows. Entertain younger guests upstairs in the game room. After the party, sip a glass of wine in the primary suite seating area before turning in.
Key facts
- Oversized study
- Game room
- 4,791 sq ft lot
Tags
Property features AI
Finance
- HOA & community: Homeowners association with quarterly fee; Association fee includes common area maintenance and grounds maintenance; Community features: common grounds, clubhouse, community mailbox
Exterior
- Parking: Attached garage; Garage faces front; Garage door opener; Driveway parking; Two covered parking spaces (2 total)
- Security: Carbon monoxide detector(s); Smoke detector(s)
- Utilities: Natural gas available; Underground utilities; Municipal Utility District water; Municipal Utility District sewer
- Home design: Two-story home; Faces east; Under construction; Slab foundation
- Construction: Built by Trophy Signature Homes; Spray foam insulation; Composition roof
- Exterior features: Lighting; Private yard; Rain gutters; Patio; Back yard; Front yard; Wood fencing
Interior
- Kitchen: Breakfast bar; Dishwasher; Disposal; Microwave; ENERGY STAR qualified appliances; Tankless water heater
- Bedrooms: One bedroom on the main level; Walk-in closet(s)
- Flooring: Carpet; Tile; Vinyl
- Bathrooms: Three full bathrooms; One half bathroom; Double vanity
- Heating & cooling: Central heating (natural gas); Central air conditioning; Zoned HVAC; ENERGY STAR qualified equipment; Ceiling fans
- Interior features: Ceiling fans; High-speed internet; Low-flow plumbing fixtures; Pantry; Recessed lighting; ENERGY STAR qualified windows; Main-level primary bedroom
- Laundry & utility: Dedicated laundry room; Electric dryer hookup
Neighborhood map
What this means for you Summary
Snapshot
- This is a 4-bed/3.5-bath land listed at $351k.
Deal economics
- At list price, monthly cash flow is $-250 ($-3k/yr) — negative.
- To cash-flow at today's rent, offer at most $307k (12.6% below list).
- To meet the 1% rule (rent ≥ 1% of price), the offer needs to be $251k (28.7% below list).
- Recommended offer: $251k (28.7% below list) — sets the bar for 1% rule.
- Cap rate 5.4% vs local median 4.4% in Elgin — meaningfully above typical; check what's discounted (condition, days-on-market, listing class) to confirm the premium yield is real.
Location & tenants
- Location reads 74/100 on livability (#167 in TX, #4,404 nationally) — a middle-class / working-renter tenant base. Strengths: cost of living A+, housing A+, health & safety A+; Watch: amenities F, commute F.
- Elgin ISD (rural): math 17% / reading 26% proficiency, ranked #741 of 826 in TX (top 90%) — low school quality limits family demand, transient renter base, plan for 1-2y turnover; 67% free/reduced lunch — lower-income household profile, screen leases tightly.
- Zoned schools: Elgin El (math 8% / reading 17%, grade F, #4,180 of 4,322 statewide, top 97%, 847 students, 84% FRL); Elgin Middle (math 22% / reading 24%, grade F, #1,327 of 1,662 statewide, top 81%, 780 students, 82% FRL); Elgin H S (math 12% / reading 37%, grade F, #1,264 of 1,632 statewide, top 82%, 1,672 students, 74% FRL).
- Market conditions: Rents rising (+3.1%/yr); 814 active listings in the ZIP; 7 comparable units currently listed for rent nearby; rentals at typical pace (median 26d on market — plan ~3-4 weeks tenant-placement turnaround); solid renter incomes; 1,841 units permitted in Bastrop County in 2024 (150 in 5+ unit buildings).
- This rent runs 31% of the median local income ($99k/yr) — at the standard rent-burdened threshold; future hikes will face affordability resistance.
Forward outlook
- In year one you build about $38k of equity ($2k loan paydown + $35k appreciation (10.0% local appreciation)).
- Bastrop County population projected at +37% by 2050 — long-run rental-demand tailwind backs the buy-and-hold thesis.
- By year 2, paydown + projected appreciation supports a ~$60k cash-out refi (75% LTV) — recoverable capital for the next deal without selling this one.
Negotiation context
- Only 11 days on market — expect competitive offers; lowballing is unlikely to land.
Questions for the listing agent
- What do current leases actually rent for vs. the listed asking? Can we see a recent rent roll and the last 12 months of T-12 income?
- What does the HOA fee cover, when was the last increase, and are there any pending special assessments or reserve-fund shortfalls?
- Is there a deadline driving the sale (1031 exchange, divorce, estate, relocation)? That informs how much negotiation room exists.
- Schools are F-rated, which usually means shorter tenancies and higher turnover. Who's the typical renter profile here, and what's been the actual vacancy rate?
- The area grade is low — what's the realistic commute time and amenity access for the typical tenant pool here? Any planned neighborhood developments (good or bad) we should know about?
- What's the average days-on-market for RENTAL listings here right now (not sales)? A rising rental-DOM trend means longer vacancies and softer asking-rent achievability than the comps imply.
- What's the recent tenant-quality profile in this submarket — average credit score on applications, eviction rate, late-payment / NSF rate, and stable-employment percentage? A property-management company in the area should have these aggregated.
- How much new for-sale + rental construction is in the pipeline within 1–3 miles? Heavy new supply typically softens prices + rents 12–24 months out; constrained supply supports both.
Investment metrics
- 1% rule
- 0.71% ✗
- Cap rate
- 5.44%
- Cash-on-cash
- -3.05%
- DSCR
- 0.86
- GRM
- 11.7
CMA / ARV
- ARV (median comp)
- $335,252
- List price
- $351,490
- Delta
- 4.84%
- Verdict
- FAIR
- Comps
- 20 within 1.0 mi
Projected returns pro-forma
10.0% appreciation · 3.12% rent growth · sell at horizon
- IRR
- 22.1%
- Equity multiple
- 2.79×
- Total profit
- $175,696
- Equity at exit
- $316,650
- IRR
- 19.9%
- Equity multiple
- 6.39×
- Total profit
- $530,391
- Equity at exit
- $682,868
Cash invested: $98,417 (down + closing). Projections, not guarantees.
Landlord ↔ Tenant lean methodology
- Overall (STATE)
- 87 Strongly Landlord-Friendly
- State Texas
- 87 Strongly Landlord-Friendly · R+5
- County
- — inherits STATE
- City
- — inherits STATE
ZIP-level market 78621
- Home prices YoY
- 7.6%
- Rents YoY
- 3.1%
- Active inventory
- 814
- Price-to-rent
- 11.7×
Monthly cashflow live
- Estimated rent
- $2,506 high interval (Pro) →
- Mortgage (P&I)
- −$1,843
- Tax from tax record
- −$188 /mo · $2,259/yr
- Insurance
- −$146
- HOA
- −$52
- Vacancy / Maint / Mgmt
- −$526
- Net cashflow
- $-250
Break-even live
Sensitivity live
| Price | -10% $-52 | -5% $-151 | +0% $-250 | +5% $-350 | +10% $-449 |
|---|---|---|---|---|---|
| Rent | -10% $-448 | -5% $-349 | +0% $-250 | +5% $-152 | +10% $-53 |
| Rate | -1.0pp $-73 | -0.5pp $-161 | base $-250 | +0.5pp $-342 | +1.0pp $-434 |
UW: 25.0% down · 7.5% · 30yr · 1.5% tax · 5.0% vac · 8.0% maint · 8.0% mgmt
Financing live
Cash to close
- Down payment
- $87,872
- Closing costs
- $10,545
- Reserves months
- —
- Total cash needed
- —
Loan-product check · same deal, 3 products live
Conventional
25% down · 7.5% · 30yr
- Down + closing
- —
- Monthly P&I
- —
- Monthly cashflow
- —
- DSCR
- —
- Eligible?
- —
Personal DTI + credit; lowest rate.
DSCR
20% down · 8.5% · 30yr
- Down + closing
- —
- Monthly P&I
- —
- Monthly cashflow
- —
- DSCR
- —
- Eligible?
- —
No personal income docs; deal must DSCR.
Hard money
10% down · 12.0% · 12mo
- Down + closing
- —
- Monthly P&I
- —
- Monthly cashflow
- —
- DSCR
- —
- Eligible?
- —
Short-term bridge; refi at stabilization.
Rent comps 7 comps
| Address | Beds | Baths | Sqft | Rent | $/sqft | DOM | Units | Dist |
|---|---|---|---|---|---|---|---|---|
| 174 Gullivers Dr Elgin, TX | 4.0 | 2.5 | 2304 | $2,850 | $1.24 | 45d | 1 | 0.30mi |
| 126 Bendecido Loop Elgin, TX | 4.0 | 2.5 | 2697 | $2,250 | $0.83 | 25d | 1 | 0.37mi |
| 813 Central Ave Elgin, TX | 4.0 | 2.0 | 2025 | $2,300 | $1.14 | 6d | 1 | 0.68mi |
| 209 Lake Placid Run Elgin, TX | 5.0 | 3.0 | 2196 | $2,200 | $1.00 | 25d | 1 | 0.81mi |
| 212 Lake Placid Run Elgin, TX | 3.0 | 2.5 | 1681 | $1,895 | $1.13 | 0d | 1 | 0.83mi |
| 120 Jim Dandy Dr Elgin, TX | 4.0 | 2.0 | 1650 | $1,923 | $1.17 | 6d | 1 | 0.92mi |
| 710 North Avenue C Unit C Elgin, TX | 4.0 | 2.5 | 3050 | $2,000 | $0.66 | 45d | 1 | 1.29mi |
HOA detail
- Monthly dues
- $52 · $624/yr
Listing history 16 events
-
2026-06-21days on market $351,490 Active 11 DOM
-
2026-06-18days on market $351,490 Active 8 DOM
-
2026-06-17days on market $351,490 Active 7 DOM
-
2026-06-16days on market $351,490 Active 6 DOM
-
2026-06-15days on market $351,490 Active 5 DOM
-
2026-06-13remarks 630-char remark
-
2026-06-13days on market $351,490 Active 3 DOM
-
2026-06-09days on market $351,490 Active 27 DOM
-
2026-06-08days on market $351,490 Active 26 DOM
-
2026-06-07days on market $351,490 Active 25 DOM
-
2026-06-04days on market $351,490 Active 22 DOM
-
2026-06-03days on market $351,490 Active 21 DOM
-
2026-06-02days on market $351,490 Active 20 DOM
-
2026-06-01days on market $351,490 Active 19 DOM
-
2026-05-31days on market $351,490 Active 18 DOM
-
2026-05-13$351,490 Active 558-char remark
ⓘ Source: listings_history table (triggers on properties + properties_extension) + one-shot
backfill from property_details.listing_events for pre-trigger history.
Tax reassessment forecast TX · Resets to sale price
- Current annual tax
- $2,259 · $188/mo
- Projected year-2 tax
- $6,432 · $536/mo
- Expected delta
- +$4,173/yr (+$348/mo · 184.7%)
ⓘ Screening estimate from a state-policy table — verify with the county assessor before closing.
Nearby sold comps map
Loading sold comps map…
Walkable amenities ~0.75 mi
Loading nearby amenities…
Taxation est. · year 1
- Rental income
- $30,068
- − Mortgage interest
- −$19,689
- − Property taxes
- −$2,259
- − Insurance
- −$1,757
- − Repairs & maintenance
- −$2,405
- − Management
- −$2,405
- − HOA
- −$624
- − Depreciation
- −$10,225
- Taxable loss
- −$9,297
- Est. tax savings @ 24.0%
- +$2,231
- After-tax cash flow
- $-774/yr
For passive investors: Depreciation is non-cash, so a rental often shows a tax loss while cash-flowing — sheltering income. Rental losses are passive: they offset passive income freely, and up to $25,000/yr can offset ordinary (W-2) income if you actively participate and your MAGI is under $100k (phasing out to $0 by $150k); unused losses carry forward. On sale, claimed depreciation is recaptured at up to 25%, and gains may owe capital-gains tax (a 1031 exchange can defer both). Figures are a year-1 estimate at your 24.0% rate — not tax advice; consult a CPA.
Schools (NCES district)
- District
- Elgin ISD
- NCES district ID
- 4818360
- Math proficiency
- 17% ▼ -9.00%
- Reading proficiency
- 26% ▼ -5.00%
- Median HH income
- $55,176
- Composite
- 19.62/100
- National rank
- #8749
- State rank
- #741 of 826 in TX
Livability — Elgin
- Score
- 74/100
- State rank
- #167
- US rank
- #4404
Category grades
Schools grade is shown separately in the Schools card above.
Census & demographics
- County
- Bastrop County · 68,601 people
- City population
- 27,860
- Metro
- Austin-Round Rock-Georgetown, TX
- Population (ZIP)
- 30,411
- Household income
- $98,534
- Rent vs Own
- Severe rent burden
- 235.0
Population outlook (Bastrop County) Hauer SSP2
- Today (2025)
- 94,260 people
- By 2030
- 101,355 · +7.5%
- By 2040
- 115,578 · +22.6%
- By 2050
- 129,464 · +37.3%
- By 2075
- 168,068 · +78.3%
- By 2100
- 194,857 · +106.7%
Race, ethnicity, and origin ACS 2023
- Neighborhood character
- Diverse neighborhood (Simpson 0.64)
- Race & ethnicity
- Hispanic / Latino 46% White 38% Two or more races 19% Black 11% Native American 1%
- Hispanic origin (detail)
- Mexican 38%
- Common ancestry
- Slovak 2% Italian 2% Romanian 1%
- Foreign-born
- 17% · Canada, Vietnam
- Languages at home
- 63% English-only · Spanish 36%
Political lean MEDSL · Bastrop
- 2024 margin
- R (+18.4) · D 40.2% · R 58.6% · Other 1.2%
- 2008→2024 swing
- -10.2pp toward R · 2008: -8.2pp · 2024: -18.4pp
- All cycles
- 2024: R+18.4 2020: R+13.8 2016: R+20.4 2012: R+17.0 2008: R+8.2
Not yet ingested
- Civics
- —
Market trends
- HPI YoY
- ▲ 29.47%
- Current HPI
- 416.87
- Rent YoY
- ▲ 3.12%
- Metro
- Austin-Round Rock-Georgetown, TX
- State GDP YoY
- ▲ 3.95%
- F500 in state
- 110
Industry mix (Fortune 500 HQ in TX)
| Industry | F500 HQs | Revenue |
|---|---|---|
| Energy | 16 | $1,198B |
|
||
| Technology | 5 | $198B |
|
||
| Engineering / Construction | 4 | $72B |
|
||
| Energy Services | 3 | $60B |
|
||
| Utilities | 3 | $41B |
|
||
| Healthcare | 2 | $330B |
|
||
Price history
1 event — show timeline
- 2026-06-10 Listed $351,490 Unlock MLS
Property tax history
+2.3%/yrLatest (2026): $2,259 · +0.0% YoY. Source: county tax records.
Cash-flow waterfall
monthlySold comps — $/sqft
last 12 mo · ≤1 miLoading sold comps…