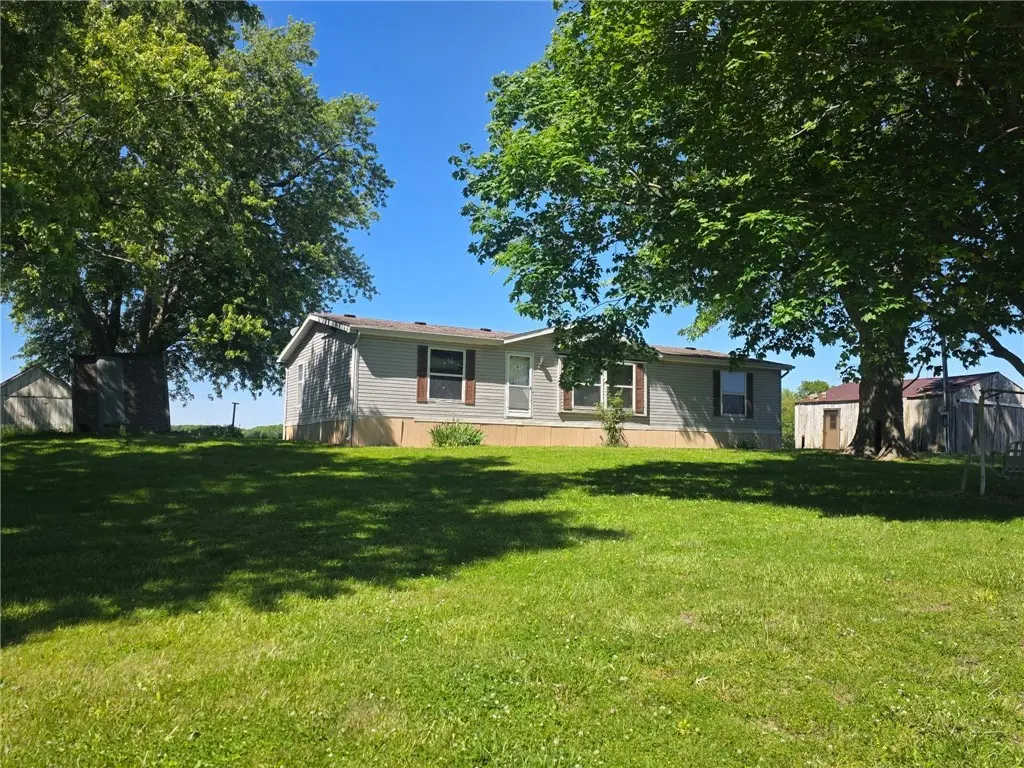
2189 E 100 North Rd · Beecher City, IL
Flood risk 1/10 · Minimal
- FEMA flood zone
- X
- Chance of flooding over 30 yrs
- 0.0%
- Est. flood insurance / yr
- $507 – $1,088
Fire risk 3/10 · Minor
- Est. fire insurance / yr
- $804 – $1,492
Heat risk 4/10 · Minor
- Hot days now (above 105°F)
- 7 days/yr
- Hot days in 30 yrs
- 20 days/yr
Wind risk 2/10 · Minimal
- Chance of severe wind over 30 yrs
- 2.0%
Air-quality risk 2/10 · Minimal
- Unhealthy air days now
- 1 days/yr
- Unhealthy air days in 30 yrs
- 1 days/yr
Risk factors via First Street. Map © Google.
Why this score? — see what drove the B grade
The composite is a weighted blend of 9 inputs, each scored 0–100. Each bar is that input's sub-score; the figure is the points it added to the 100-point composite (weight × sub-score).
- Cash flow +30.0/30.0
- DSCR +10.0/10.0
- 1% rule +8.0/10.0
- ARV discount +7.5/15.0
- Appreciation +7.3/10.0
- Schools +3.9/10.0
- Livability +3.1/5.0
- Rent growth +2.5/5.0
- Condition / age +2.2/5.0
$89,900
🖨 Deal sheet 📄 Offer letter ✓ Due diligence
Listing remarks
Escape the noise and discover peaceful country living in this charming setting that sits on a little over 7 beautiful acres in rural Shelby County. Surrounded by mature timber, open green acreage, and scenic countryside views, this property offers the perfect blend of privacy, space, and small-town tranquility. This property delivers the freedom and serenity that country living is all about. Wake up to the sounds of nature, enjoy peaceful evenings under the stars, and take advantage of the abundant space for recreation, gardening, hunting, or simply relaxing outdoors. Conveniently located approximately 25 minutes from Effingham, you can enjoy the privacy of rural living while still having q
Key facts
- Mature timber
- Privacy
- Beautiful acres
Tags
Property features AI
Finance
- Other: Property zoned RES
- Financial info: No investor or income/expense details provided
- HOA & community: No HOA information provided
Exterior
- Parking: Detached garage with 1 garage space
- Security: No security features listed
- Utilities: Public water and well available; Septic tank sewer
- Home design: Manufactured single-family residence; One story
- Construction: Vinyl siding; Other foundation
- Exterior features: Gravel road access; Shingle roof
Interior
- Kitchen: No kitchen appliance details provided
- Bedrooms: Bedrooms not specified
- Flooring: Flooring details not provided
- Bathrooms: 2 full bathrooms
- Heating & cooling: Central air conditioning; Electric forced-air heating
- Interior features: Electric water heater; Total of 3 rooms
- Laundry & utility: Laundry on the main level
Neighborhood map
What this means for you Summary
Snapshot
- This is a 3-bed/2.0-bath single-family listed at $90k. Condition is rated fair.
Deal economics
- At list price, monthly cash flow is $387 ($5k/yr) — positive.
- The deal already cash-flows at list — no discount required.
- Meets the 1% rule at list price ($1k rent vs $90k).
Location & tenants
- Location reads 62/100 on livability (#883 in IL) — a middle-class / working-renter tenant base. Strengths: cost of living A+, housing A+; Watch: schools D+, employment D+, crime D.
- Beecher City CUSD 20 (rural): math 50% / reading 35% proficiency, ranked #270 of 919 in IL (top 29%) — families likely to look elsewhere, expect single-tenant / working-renter base with shorter leases.
- Market conditions: 5 active listings in the ZIP; 41 units permitted in Shelby County in 2024 (0 in 5+ unit buildings).
Forward outlook
- In year one you build about $5k of equity ($622 loan paydown + $4k appreciation (4.6% local appreciation)).
- Shelby County population projected at -22% by 2050 — secular population decline; favor cash flow + early exit over multi-decade hold.
- At projected returns (4.6% appreciation + 3.0% rent growth), your $25k cash investment doubles in ~3 years — after that, you're playing with house money.
- By year 7, paydown + projected appreciation supports a ~$31k cash-out refi (75% LTV) — recoverable capital for the next deal without selling this one.
Negotiation context
- Only 1 days on market — expect competitive offers; lowballing is unlikely to land.
Questions for the listing agent
- Have any recent inspections been done? Can we get a copy of the seller's disclosures and any deferred-maintenance estimates?
- Is there a deadline driving the sale (1031 exchange, divorce, estate, relocation)? That informs how much negotiation room exists.
- Schools are D-rated, which usually means shorter tenancies and higher turnover. Who's the typical renter profile here, and what's been the actual vacancy rate?
- Crime grade is D in this area — have there been break-ins, vandalism, or insurance claims at this property in the last 3 years? What carrier currently insures it and at what premium?
- What's the average days-on-market for RENTAL listings here right now (not sales)? A rising rental-DOM trend means longer vacancies and softer asking-rent achievability than the comps imply.
- What's the recent tenant-quality profile in this submarket — average credit score on applications, eviction rate, late-payment / NSF rate, and stable-employment percentage? A property-management company in the area should have these aggregated.
- How much new for-sale + rental construction is in the pipeline within 1–3 miles? Heavy new supply typically softens prices + rents 12–24 months out; constrained supply supports both.
Investment metrics
- 1% rule
- 1.30% ✓
- Cap rate
- 11.46%
- Cash-on-cash
- 18.46%
- DSCR
- 1.82
- GRM
- 6.4
CMA / ARV
No comps found within radius.
Projected returns pro-forma
4.64% appreciation · 3.0% rent growth · sell at horizon
- IRR
- 28.2%
- Equity multiple
- 2.73×
- Total profit
- $43,534
- Equity at exit
- $49,011
- IRR
- 27.3%
- Equity multiple
- 5.41×
- Total profit
- $111,127
- Equity at exit
- $83,029
Cash invested: $25,172 (down + closing). Projections, not guarantees.
Landlord ↔ Tenant lean methodology
- Overall (STATE)
- 43 Moderately Tenant-Leaning
- State Illinois
- 43 Moderately Tenant-Leaning · D+7
- County
- — inherits STATE
- City
- — inherits STATE
ZIP-level market 62414
- Home prices YoY
- 3.2%
- Active inventory
- 5
- Price-to-rent
- 6.4×
Monthly cashflow live
- Estimated rent
- $1,170 medium interval (Pro) →
- Mortgage (P&I)
- −$471
- Tax from tax record
- −$28 /mo · $339/yr
- Insurance
- −$37
- HOA
- −$0
- Vacancy / Maint / Mgmt
- −$246
- Net cashflow
- $387
Break-even live
UW: 25.0% down · 7.5% · 30yr · 1.5% tax · 5.0% vac · 8.0% maint · 8.0% mgmt
Financing live
Cash to close
- Down payment
- $22,475
- Closing costs
- $2,697
- Reserves months
- —
- Total cash needed
- —
Loan-product check · same deal, 3 products live
Conventional
25% down · 7.5% · 30yr
- Down + closing
- —
- Monthly P&I
- —
- Monthly cashflow
- —
- DSCR
- —
- Eligible?
- —
Personal DTI + credit; lowest rate.
DSCR
20% down · 8.5% · 30yr
- Down + closing
- —
- Monthly P&I
- —
- Monthly cashflow
- —
- DSCR
- —
- Eligible?
- —
No personal income docs; deal must DSCR.
Hard money
10% down · 12.0% · 12mo
- Down + closing
- —
- Monthly P&I
- —
- Monthly cashflow
- —
- DSCR
- —
- Eligible?
- —
Short-term bridge; refi at stabilization.
Listing history 2 events
-
2026-05-21status Pending
-
2026-05-17$89,900 Active
ⓘ Source: listings_history table (triggers on properties + properties_extension) + one-shot
backfill from property_details.listing_events for pre-trigger history.
Tax reassessment forecast IL · Partial reset (capped growth)
- Current annual tax
- $339 · $28/mo
- Projected year-2 tax
- $1,190 · $99/mo
- Expected delta
- +$851/yr (+$71/mo · 250.6%)
ⓘ Screening estimate from a state-policy table — verify with the county assessor before closing.
Climate risk First Street
- Flood 1/10 Low FEMA zone X · 0% chance over 30 yrs
- Wildfire 3/10 Moderate
- Heat 4/10 Moderate 7 d/yr ≥105°F today · 20 d/yr by 30 yrs out
- Wind 2/10 Low 2% chance of damaging wind over 30 yrs
- Air quality 2/10 Low 1 unhealthy d/yr today · 1 by 30 yrs out
Nearby sold comps map
Loading sold comps map…
Walkable amenities ~0.75 mi
Loading nearby amenities…
Taxation est. · year 1
- Rental income
- $14,043
- − Mortgage interest
- −$5,036
- − Property taxes
- −$339
- − Insurance
- −$450
- − Repairs & maintenance
- −$1,123
- − Management
- −$1,123
- − Depreciation
- −$2,615
- Taxable income
- $3,356
- Est. tax owed @ 24.0%
- −$805
- After-tax cash flow
- $3,842/yr
For passive investors: Depreciation is non-cash, so a rental often shows a tax loss while cash-flowing — sheltering income. Rental losses are passive: they offset passive income freely, and up to $25,000/yr can offset ordinary (W-2) income if you actively participate and your MAGI is under $100k (phasing out to $0 by $150k); unused losses carry forward. On sale, claimed depreciation is recaptured at up to 25%, and gains may owe capital-gains tax (a 1031 exchange can defer both). Figures are a year-1 estimate at your 24.0% rate — not tax advice; consult a CPA.
Condition & rehab AI · 0 photos
This property requires moderate repairs and maintenance to improve its condition and value. Painting, refinishing, and landscaping would significantly enhance its appeal.
Repairs flagged
- Minor Kitchen cabinets — Light wear and tear
- Minor Kitchen countertops — Light wear and tear
- Minor Bathroom fixtures — Light wear and tear
- Minor Exterior siding — Some discoloration
- Minor Hardwood floors — Worn and could benefit from refinishing
- Minor Paint — Chipped in some areas
- Minor Windows — Some frames show signs of wear
- Minor Foundation cracks — Cracks visible in the concrete
- Minor HVAC unit — Appears old and may need maintenance
Value-add opportunities
- Both Painting and refinishing — Improves both resale and rental value by enhancing curb appeal and interior appearance
- Both Landscaping — Enhances curb appeal and creates a more inviting environment
- Both HVAC maintenance — Improves comfort and energy efficiency, attracting more buyers/renters
Renovation cost estimate screening
| Repair item | Severity | Est. cost |
|---|---|---|
| Kitchen cabinets · Light wear and tear | Minor | $500–3,000 |
| Kitchen countertops · Light wear and tear | Minor | $500–3,000 |
| Bathroom fixtures · Light wear and tear | Minor | $500–3,000 |
| Exterior siding · Some discoloration | Minor | $500–3,000 |
| Hardwood floors · Worn and could benefit from refinishing | Minor | $500–3,000 |
| Paint · Chipped in some areas | Minor | $500–3,000 |
| Windows · Some frames show signs of wear | Minor | $500–3,000 |
| Foundation cracks · Cracks visible in the concrete | Minor | $500–3,000 |
| HVAC unit · Appears old and may need maintenance | Minor | $500–3,000 |
| Total estimated repair cost · 9 items | $4,500–27,000 |
Value-add ROI direction
- Both Painting and refinishing — Improves both resale and rental value by enhancing curb appeal and interior appearance ↑
- Both Landscaping — Enhances curb appeal and creates a more inviting environment ↑
- Both HVAC maintenance — Improves comfort and energy efficiency, attracting more buyers/renters ↑
ⓘ Cost ranges are severity-bucket heuristics (US national rule-of-thumb). Get contractor quotes + a written scope before underwriting a rehab budget.
Schools (NCES district)
- District
- Beecher City CUSD 20
- NCES district ID
- 1705460
- Math proficiency
- 50% ▲ 5.00%
- Reading proficiency
- 35% ▬ 0.00%
- Median HH income
- $49,334
- Composite
- 38.86/100
- National rank
- #8333
- State rank
- #270 of 919 in IL
Livability — Beecher City
- Score
- 62/100
- State rank
- #883
- US rank
- #17198
Category grades
Schools grade is shown separately in the Schools card above.
Census & demographics
- Population (ZIP)
- 1,612
Population outlook (Shelby County) Hauer SSP2
- Today (2025)
- 20,512 people
- By 2030
- 19,675 · -4.1%
- By 2040
- 17,851 · -13.0%
- By 2050
- 15,973 · -22.1%
- By 2075
- 11,799 · -42.5%
- By 2100
- 8,030 · -60.9%
Race, ethnicity, and origin ACS 2023
- Neighborhood character
- Predominantly White (96%)
- Race & ethnicity
- White 96% Two or more races 2% Hispanic / Latino 2%
- Common ancestry
- Slovak 7% Lithuanian 3% Italian 2%
- Foreign-born
- 0% · Canada
- Languages at home
- 97% English-only · Spanish 2%
Political lean MEDSL · Shelby
- 2024 margin
- Solid R (+60.2) · D 19.2% · R 79.5% · Other 1.4%
- 2008→2024 swing
- -40.5pp toward R · 2008: -19.8pp · 2024: -60.2pp
- All cycles
- 2024: R+60.2 2020: R+57.2 2016: R+54.3 2012: R+33.7 2008: R+19.8
Not yet ingested
- Civics
- —
Market trends
- HPI YoY
- ▲ 4.64%
- Current HPI
- 149.4195
- Rent YoY
- —
- Metro
- —
- State GDP YoY
- ▲ 1.59%
- F500 in state
- 60
Industry mix (Fortune 500 HQ in IL)
| Industry | F500 HQs | Revenue |
|---|---|---|
| Insurance | 4 | $201B |
|
||
| Consumer Goods | 4 | $87B |
|
||
| Industrial Machinery | 3 | $64B |
|
||
| Healthcare | 2 | $55B |
|
||
| Retail / Pharmacy | 1 | $148B |
|
||
| Agriculture / Food | 1 | $86B |
|
||
Price history
2 events — show timeline
- 2026-05-21 Pending — CIBR
- 2026-05-17 Listed $89,900 CIBR
Property tax history
-1.1%/yrLatest (2024): $339 · -1.1% YoY. Source: county tax records.
Cash-flow waterfall
monthlySold comps — $/sqft
last 12 mo · ≤1 miLoading sold comps…