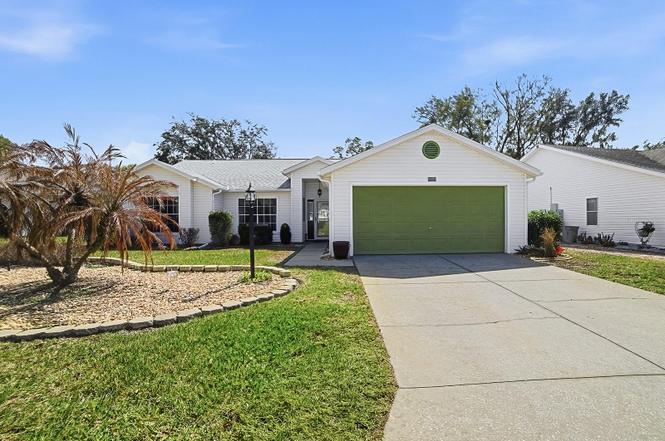
5535 Tangelo St · Leesburg, FL
Flood risk 1/10 · Minimal
- FEMA flood zone
- X (unshaded)
- Chance of flooding over 30 yrs
- 0.0%
- Est. flood insurance / yr
- $507 – $1,088
Fire risk 5/10 · Moderate
- Est. fire insurance / yr
- $947 – $1,759
Heat risk 8/10 · Major
- Hot days now (above 108°F)
- 6 days/yr
- Hot days in 30 yrs
- 18 days/yr
Wind risk 9/10 · Severe
- Chance of severe wind over 30 yrs
- 99.0%
Air-quality risk 2/10 · Minimal
- Unhealthy air days now
- 1 days/yr
- Unhealthy air days in 30 yrs
- 2 days/yr
Risk factors via First Street. Map © Google.
Why this score? — see what drove the D+ grade
The composite is a weighted blend of 9 inputs, each scored 0–100. Each bar is that input's sub-score; the figure is the points it added to the 100-point composite (weight × sub-score).
- ARV discount +15.0/15.0
- Cash flow +12.7/30.0
- Schools +4.2/10.0
- DSCR +3.8/10.0
- 1% rule +3.5/10.0
- Livability +3.1/5.0
- Condition / age +2.5/5.0
- Rent growth +2.3/5.0
- Appreciation +0.0/10.0
$270,000
🖨 Deal sheet (PDF) 📄 Offer letter ✓ Due diligence
Listing remarks MLS
#383 READY FOR IMMEDIATE OCCUPANCY!!! LIVING AND FAMILY ROOM.
Key facts
- Gated community
- Ample cabinetry
- Tile flooring
Tags
Property features AI
Finance
- Other: Community features include sidewalks, deed restrictions, special community restrictions, golf and golf-cart friendly
- Financial info: Total monthly HOA $185 (total annual ~$2,220); Lease restrictions apply
- HOA & community: HOA required (monthly fee $185); Association amenities include pool, clubhouse, fitness center, spa/hot tub, sauna, tennis, pickleball, basketball and shuffleboard courts, trails, storage, gated access, guarded/24-hour security, recreation facilities and management; Association fee includes guard/24-hour, common area taxes, pool, management, private road, and security; Buyer approval required; Pets allowed (cats and dogs, number limit); Senior community
Exterior
- Parking: Attached 2-car garage (18 x 20)
- Security: Guarded gate community; Security gate; Community security included in HOA
- Utilities: Public water; Public sewer; Electricity connected; Cable available; Water and sewer available/connected
- Home design: Single-family residence; One story; North-facing
- Construction: Vinyl siding with frame construction; Shingle roof; Slab foundation; Built as residential single-family
- Exterior features: Rear porch; Rain gutters; Level lot; Asphalt road frontage; Irrigation equipment
Interior
- Kitchen: Dishwasher; Disposal; Ice maker; Microwave; Range; Refrigerator; Exhaust fan; Electric water heater
- Bedrooms: 3 bedrooms
- Flooring: Carpet; Ceramic tile; Laminate
- Bathrooms: 2 full bathrooms
- Heating & cooling: Electric heating; Central air conditioning
- Interior features: Ceiling fans; Eat-in kitchen; High ceilings; Living room/dining room combo; Walk-in closets; Window treatments
- Laundry & utility: Washer and dryer (inside laundry)
Neighborhood map
What this means for you Summary
Snapshot
- This is a 2-bed/2.0-bath single-family listed at $270k.
Deal economics
- At list price, monthly cash flow is $-32 ($-380/yr) — negative.
- To cash-flow at today's rent, offer at most $264k (2.1% below list).
- To meet the 1% rule (rent ≥ 1% of price), the offer needs to be $229k (15.3% below list).
- Recommended offer: $229k (15.3% below list) — sets the bar for 1% rule.
- Cap rate 6.2% vs local median 4.4% in Leesburg — top-decile yield for the area; either an underpriced asset or a hidden risk that comps aren't pricing in. Stress-test before assuming the spread holds.
Location & tenants
- Location reads 62/100 on livability (#751 in FL) — a middle-class / working-renter tenant base. Strengths: cost of living A+, housing A+; Watch: crime D, amenities F, commute F.
- Lake (suburban): math 49% / reading 50% proficiency, ranked #37 of 73 in FL (top 51%) — families likely to look elsewhere, expect single-tenant / working-renter base with shorter leases.
- Zoned schools: Leesburg Elementary School (math 31% / reading 32%, grade F, #1,841 of 2,144 statewide, top 86%, 822 students, 71% FRL); Oak Park Middle School (math 32% / reading 36%, grade F, #426 of 571 statewide, top 75%, 575 students, 70% FRL); Leesburg High School (math 24% / reading 32%, grade F, #464 of 667 statewide, top 70%, 1,641 students, 58% FRL) — zoned schools average 66% FRL vs 49% district-wide (17 pts higher); higher-poverty schools than district average — tighter screening recommended.
- Zoned-school proficiency averages 31% at this address vs 50% district-wide (-18 pts) — the specific schools serving this property underperform the Lake average; the district grade overstates school quality for this exact location.
- Market conditions: Rents soft (-0.9%/yr); 798 active listings in the ZIP; 5 comparable units currently listed for rent nearby; rentals at typical pace (median 26d on market — plan ~3-4 weeks tenant-placement turnaround); 4,799 units permitted in Lake County in 2024 (814 in 5+ unit buildings).
- At $2,288/mo this rent would consume 47% of the median local household income ($58k/yr) (locally 1745% of renters already pay >50% of income on rent) — very limited rent-growth headroom before tenants either downsize or default.
Forward outlook
- Local home prices are declining (-3.0%/yr); year-one equity from $2k of loan paydown is wiped out by about $8k of value loss. Plan a longer hold.
- Lake County population projected at +37% by 2050 — long-run rental-demand tailwind backs the buy-and-hold thesis.
Negotiation context
- It's been on market 111 days — a 9% lower offer ($246k) is reasonable based on typical stale-listing flexibility.
- 2 sale attempts since 19y ago with the ask held roughly flat each time — persistent listings suggest the price (not the market) is what's stuck; bring a comps-based counter.
- Current owner paid $125k; list at $270k implies a 116% gain — meaningful room to come down on a strong offer.
Risks & watch-outs
- Climate carrying-cost: severe wind risk, 99% chance of damaging wind over 30y; moderate wildfire risk; extreme-heat days projected 6→18/yr by 2055 (HVAC capex compounding) — expect insurance premiums to compound above CPI over the hold.
Questions for the listing agent
- What do current leases actually rent for vs. the listed asking? Can we see a recent rent roll and the last 12 months of T-12 income?
- It's been on market 111 days. Have you received any prior offers? Is the seller open to a 15% concession, seller financing, or rate buy-down credit?
- What does the HOA fee cover, when was the last increase, and are there any pending special assessments or reserve-fund shortfalls?
- Why hasn't it sold? Are there any deal-killer items the seller is aware of (foundation, flood, title, zoning, code violations)?
- Is there a deadline driving the sale (1031 exchange, divorce, estate, relocation)? That informs how much negotiation room exists.
- Schools are D-rated, which usually means shorter tenancies and higher turnover. Who's the typical renter profile here, and what's been the actual vacancy rate?
- Crime grade is D in this area — have there been break-ins, vandalism, or insurance claims at this property in the last 3 years? What carrier currently insures it and at what premium?
- The area grade is low — what's the realistic commute time and amenity access for the typical tenant pool here? Any planned neighborhood developments (good or bad) we should know about?
- What's the average days-on-market for RENTAL listings here right now (not sales)? A rising rental-DOM trend means longer vacancies and softer asking-rent achievability than the comps imply.
- What's the recent tenant-quality profile in this submarket — average credit score on applications, eviction rate, late-payment / NSF rate, and stable-employment percentage? A property-management company in the area should have these aggregated.
- How much new for-sale + rental construction is in the pipeline within 1–3 miles? Heavy new supply typically softens prices + rents 12–24 months out; constrained supply supports both.
Investment metrics
- 1% rule
- 0.85% ✗
- Cap rate
- 6.15%
- Cash-on-cash
- -0.50%
- DSCR
- 0.98
- GRM
- 9.8
CMA / ARV
- ARV (on-the-fly)
- $381,480
- Comps found
- 2
Show comp detail 2 sales within ~0.75 mi
| Address | Dist | Beds/Ba | Sqft | Sold | Price | $/sf | Match |
|---|---|---|---|---|---|---|---|
| 24821 Pine Hl | 0.23mi | 2/2.0 | 1,994 (-2%) | 4mo | $257,100 | $129 | 82 |
| 4830 Sawgrass Lake Cir | 0.69mi | 3/2.0 (+1) | 1,907 (-6%) | 17mo | $356,000 | $187 | 38 |
Match score weights: distance 35% · size 25% · config 20% · recency 20%. Top-matched comps best support the ARV.
Projected returns pro-forma
-3.0% appreciation · 0.0% rent growth · sell at horizon
- IRR
- -20.5%
- Equity multiple
- 0.31×
- Total profit
- $-52,453
- Equity at exit
- $40,258
- IRR
- -22.1%
- Equity multiple
- 0.02×
- Total profit
- $-74,107
- Equity at exit
- $23,345
Cash invested: $75,600 (down + closing). Projections, not guarantees.
Landlord ↔ Tenant lean methodology
- Overall (STATE)
- 87 Strongly Landlord-Friendly
- State Florida
- 87 Strongly Landlord-Friendly · R+3
- County
- — inherits STATE
- City
- — inherits STATE
ZIP-level market 34748
- Home prices YoY
- -25.3%
- Rents YoY
- -0.9%
- Active inventory
- 798
- Price-to-rent
- 9.8×
Monthly cashflow live
- Estimated rent
- $2,288 high interval (Pro) →
- Mortgage (P&I)
- −$1,416
- Tax from tax record
- −$126 /mo · $1,508/yr
- Insurance
- −$112
- HOA
- −$185
- Vacancy / Maint / Mgmt
- −$480
- Net cashflow
- $-32
Break-even live
Sensitivity live
| Price | -10% $121 | -5% $45 | +0% $-32 | +5% $-108 | +10% $-184 |
|---|---|---|---|---|---|
| Rent | -10% $-212 | -5% $-122 | +0% $-32 | +5% $59 | +10% $149 |
| Rate | -1.0pp $104 | -0.5pp $37 | base $-32 | +0.5pp $-102 | +1.0pp $-173 |
UW: 25.0% down · 7.5% · 30yr · 1.5% tax · 5.0% vac · 8.0% maint · 8.0% mgmt
Financing live
Cash to close
- Down payment
- $67,500
- Closing costs
- $8,100
- Reserves months
- —
- Total cash needed
- —
Loan-product check · same deal, 3 products live
Conventional
25% down · 7.5% · 30yr
- Down + closing
- —
- Monthly P&I
- —
- Monthly cashflow
- —
- DSCR
- —
- Eligible?
- —
Personal DTI + credit; lowest rate.
DSCR
20% down · 8.5% · 30yr
- Down + closing
- —
- Monthly P&I
- —
- Monthly cashflow
- —
- DSCR
- —
- Eligible?
- —
No personal income docs; deal must DSCR.
Hard money
10% down · 12.0% · 12mo
- Down + closing
- —
- Monthly P&I
- —
- Monthly cashflow
- —
- DSCR
- —
- Eligible?
- —
Short-term bridge; refi at stabilization.
Rent comps 5 comps
| Address | Beds | Baths | Sqft | Rent | $/sqft | DOM | Units | Dist |
|---|---|---|---|---|---|---|---|---|
| 25049 Navel Ave Leesburg, FL | 2.0 | 2.0 | 1430 | $2,800 | $1.96 | 26d | 1 | 0.07mi |
| 5009 El Destino Dr Leesburg, FL | 2.0 | 2.0 | 1428 | $2,450 | $1.72 | 26d | 1 | 0.51mi |
| 4728 Belle Grv Leesburg, FL | 2.0 | 2.0 | 1480 | $1,700 | $1.15 | 26d | 1 | 0.99mi |
| 10140 Huntingnet Way Leesburg, FL | 3.0 | 2.0 | 1589 | $2,250 | $1.42 | 26d | 1 | 1.29mi |
| 4501 River Ridge Dr Leesburg, FL | 2.0 | 2.0 | 1467 | $1,725 | $1.18 | 7d | 1 | 1.42mi |
HOA detail
- Monthly dues
- $185 · $2,220/yr
Listing history 22 events
-
2026-06-21days on market $270,000 Active 111 DOM
-
2026-06-18days on market $270,000 Active 108 DOM
-
2026-06-17days on market $270,000 Active 107 DOM
-
2026-06-16days on market $270,000 Active 106 DOM
-
2026-06-15days on market $270,000 Active 105 DOM
-
2026-06-13days on market $270,000 Active 103 DOM
-
2026-06-09days on market $270,000 Active 99 DOM
-
2026-06-08days on market $270,000 Active 98 DOM
-
2026-06-07days on market $270,000 Active 97 DOM
-
2026-06-04days on market $270,000 Active 94 DOM
-
2026-06-03days on market $270,000 Active 93 DOM
-
2026-06-02days on market $270,000 Active 92 DOM
-
2026-06-01days on market $270,000 Active 91 DOM
-
2026-05-31days on market $270,000 Active 90 DOM
-
2026-04-29price $270,000
-
2026-03-02$275,000 Active
-
2014-10-15soldstatus $125,000
-
2007-12-28soldstatus $135,000 63-char remark
Show marketing remark (63 chars)
#383 READY FOR IMMEDIATE OCCUPANCY!!! LIVING AND FAMILY ROOM.
-
2007-12-28soldstatus $135,000
Show marketing remark (63 chars)
#383 READY FOR IMMEDIATE OCCUPANCY!!! LIVING AND FAMILY ROOM.
-
2007-08-22$147,000 63-char remark
Show marketing remark (63 chars)
#383 READY FOR IMMEDIATE OCCUPANCY!!! LIVING AND FAMILY ROOM.
-
1996-06-27soldstatus $115,900
-
1992-11-01soldstatus $97,800
ⓘ Source: listings_history table (triggers on properties + properties_extension) + one-shot
backfill from property_details.listing_events for pre-trigger history.
Tax reassessment forecast FL · Resets to sale price
- Current annual tax
- $1,508 · $126/mo
- Projected year-2 tax
- $2,241 · $187/mo
- Expected delta
- +$733/yr (+$61/mo · 48.6%)
ⓘ Screening estimate from a state-policy table — verify with the county assessor before closing.
Climate risk First Street
- Flood 1/10 Low FEMA zone X (unshaded) · 0% chance over 30 yrs
- Wildfire 5/10 Major
- Heat 8/10 Severe 6 d/yr ≥108°F today · 18 d/yr by 30 yrs out
- Wind 9/10 Extreme 99% chance of damaging wind over 30 yrs
- Air quality 2/10 Low 1 unhealthy d/yr today · 2 by 30 yrs out
Nearby sold comps map
Loading sold comps map…
Walkable amenities ~0.75 mi
Loading nearby amenities…
Taxation est. · year 1
- Rental income
- $27,455
- − Mortgage interest
- −$15,124
- − Property taxes
- −$1,508
- − Insurance
- −$1,350
- − Repairs & maintenance
- −$2,196
- − Management
- −$2,196
- − HOA
- −$2,220
- − Depreciation
- −$7,855
- Taxable loss
- −$4,995
- Est. tax savings @ 24.0%
- +$1,199
- After-tax cash flow
- $819/yr
For passive investors: Depreciation is non-cash, so a rental often shows a tax loss while cash-flowing — sheltering income. Rental losses are passive: they offset passive income freely, and up to $25,000/yr can offset ordinary (W-2) income if you actively participate and your MAGI is under $100k (phasing out to $0 by $150k); unused losses carry forward. On sale, claimed depreciation is recaptured at up to 25%, and gains may owe capital-gains tax (a 1031 exchange can defer both). Figures are a year-1 estimate at your 24.0% rate — not tax advice; consult a CPA.
Schools (NCES district)
- District
- Lake
- NCES district ID
- 1201050
- Math proficiency
- 49% ▼ -7.00%
- Reading proficiency
- 50% ▼ -4.00%
- Median HH income
- $46,632
- Composite
- 42.05/100
- National rank
- #3327
- State rank
- #37 of 73 in FL
Livability — Leesburg
- Score
- 62/100
- State rank
- #751
- US rank
- #16429
Category grades
Schools grade is shown separately in the Schools card above.
Census & demographics
- County
- Lake County · 364,602 people
- City population
- 70,232
- Metro
- Orlando-Kissimmee-Sanford, FL
- Population (ZIP)
- 48,095
- Household income
- $58,192
- Rent vs Own
- Severe rent burden
- 1745.0
Population outlook (Lake County) Hauer SSP2
- Today (2025)
- 386,640 people
- By 2030
- 417,107 · +7.9%
- By 2040
- 476,676 · +23.3%
- By 2050
- 531,296 · +37.4%
- By 2075
- 648,303 · +67.7%
- By 2100
- 698,530 · +80.7%
Race, ethnicity, and origin ACS 2023
- Neighborhood character
- Majority White (64%)
- Race & ethnicity
- White 64% Black 16% Hispanic / Latino 15% Two or more races 9% Asian 1%
- Hispanic origin (detail)
- Mexican 4% Puerto Rican 5% Cuban 3%
- Common ancestry
- Romanian 3% Lithuanian 3% Slovak 2%
- Foreign-born
- 9% · Canada, Vietnam, Jamaica
- Languages at home
- 88% English-only · Spanish 10% French/Haitian/Cajun 1%
Political lean MEDSL · Lake
- 2024 margin
- Strong R (+24.7) · D 37.3% · R 62.0%
- 2008→2024 swing
- -11.2pp toward R · 2008: -13.5pp · 2024: -24.7pp
- All cycles
- 2024: R+24.7 2020: R+20.0 2016: R+23.1 2012: R+17.1 2008: R+13.5
Not yet ingested
- Civics
- —
Market trends
- HPI YoY
- ▼ -88.97%
- Current HPI
- 262.1766
- Rent YoY
- ▼ -0.95%
- Metro
- Orlando-Kissimmee-Sanford, FL
- State GDP YoY
- ▲ 3.28%
- F500 in state
- 36
Industry mix (Fortune 500 HQ in FL)
| Industry | F500 HQs | Revenue |
|---|---|---|
| Industrial Technology | 2 | $29B |
|
||
| Insurance | 2 | $17B |
|
||
| Retail | 1 | $60B |
|
||
| Technology Distribution | 1 | $58B |
|
||
| Homebuilding | 1 | $35B |
|
||
| Technology Manufacturing | 1 | $35B |
|
||
Price history
+176.1% since first listed8 events — show timeline
- 2026-04-29 Price Changed $270,000 Stellar MLS as Distributed by MLS Grid
- 2026-03-02 Listed $275,000 Stellar MLS as Distributed by MLS Grid
- 2014-10-15 Sold (Public Records) $125,000 Public Records
- 2007-12-28 Sold (Public Records) $135,000 Public Records
- 2007-12-28 Sold (MLS) $135,000 Stellar MLS as Distributed by MLS Grid
- 2007-08-22 Listed $147,000 Stellar MLS as Distributed by MLS Grid
- 1996-06-27 Sold (Public Records) $115,900 Public Records
- 1992-11-01 Sold (Public Records) $97,800 Public Records
Property tax history
-0.1%/yrLatest (2025): $1,508 · -18.9% YoY. Source: county tax records.
Cash-flow waterfall
monthlySold comps — $/sqft
last 12 mo · ≤1 miLoading sold comps…