1965 Westside Hwy #117 · Lexington, WA
Flood risk 1/10 · Minimal
- FEMA flood zone
- X
- Chance of flooding over 30 yrs
- 0.0%
- Est. flood insurance / yr
- $507 – $1,088
Fire risk 3/10 · Minor
- Est. fire insurance / yr
- $604 – $1,122
Heat risk 3/10 · Minor
- Hot days now (above 89°F)
- 7 days/yr
- Hot days in 30 yrs
- 15 days/yr
Wind risk 1/10 · Minimal
- Chance of severe wind over 30 yrs
- —
Air-quality risk 7/10 · Major
- Unhealthy air days now
- 8 days/yr
- Unhealthy air days in 30 yrs
- 8 days/yr
Risk factors via First Street. Map © Google.
Why this score? — see what drove the C+ grade
The composite is a weighted blend of 9 inputs, each scored 0–100. Each bar is that input's sub-score; the figure is the points it added to the 100-point composite (weight × sub-score).
- Cash flow +30.0/30.0
- 1% rule +10.0/10.0
- DSCR +10.0/10.0
- Schools +4.0/10.0
- Rent growth +3.5/5.0
- Livability +2.5/5.0
- Condition / age +2.5/5.0
- ARV discount +0.8/15.0
- Appreciation +0.0/10.0
$114,900
🖨 Deal sheet (PDF) 📄 Offer letter ✓ Due diligence
Listing remarks
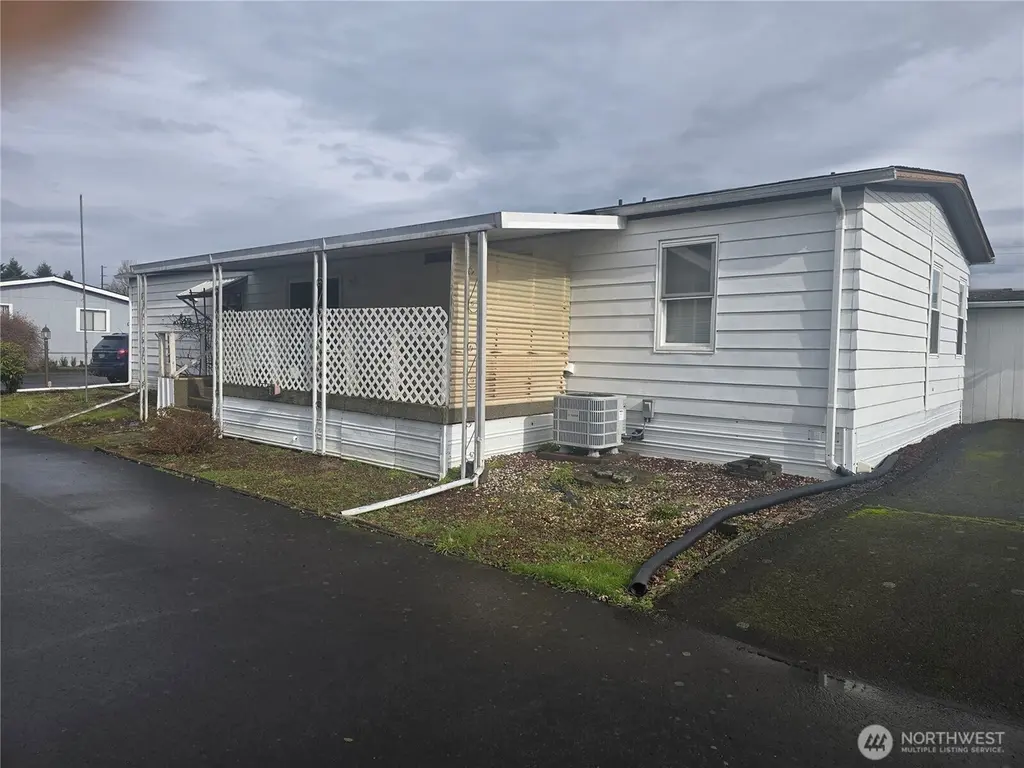
Come to the corner of Red Robin and Peacock Lane in the wonderful, quiet Tim-Wa Estates. Enjoy the neighborhood, the clubhouse and the friendly management. This well-kept 3-bedroom, 2-bath home has an open kitchen with a nice area for a TV room or dining table. The spacious living room has many windows with vaulted ceilings. The nice patio could be used for enjoying the peaceful summers. There is an additional shed with electricity and extra parking. The washer, dryer, Refrigerator, and Dishwasher are included. Living close to the Cowlitz River behind the dike brings you a unique opportunity. Just down the road from Riverside Park!
Key facts
- Extra parking
- Nice patio
- Vaulted ceilings
Tags
Neighborhood map
What this means for you Summary
Snapshot
- This is a 3-bed/2.0-bath manufactured listed at $115k.
Deal economics
- At list price, monthly cash flow is $1k ($15k/yr) — positive.
- The deal already cash-flows at list — no discount required.
- Meets the 1% rule at list price ($2k rent vs $115k).
- Recommended offer: $105k (9.0% below list) — sets the bar for market timing.
- Cap rate 19.0% vs local median 3.4% in Lexington — top-decile yield for the area; either an underpriced asset or a hidden risk that comps aren't pricing in. Stress-test before assuming the spread holds.
Location & tenants
- Location reads: area grade C — affects rentability + tenant quality, not the cash-flow math above.
- Kelso School District (suburban): math 35% / reading 53% proficiency, ranked #191 of 291 in WA (top 66%) — families likely to look elsewhere, expect single-tenant / working-renter base with shorter leases.
- Zoned schools: Huntington Middle School (539 students, 76% FRL); Kelso High School (1,424 students, 61% FRL) — zoned schools average 68% FRL vs 50% district-wide (19 pts higher); higher-poverty schools than district average — tighter screening recommended.
- Market conditions: Rents rising fast (+4.1%/yr); 219 active listings in the ZIP; 3 comparable units currently listed for rent nearby; rentals lingering (median 46d on market — plan ~5-8 weeks vacancy on turnover, expect pricing pressure); 100% of comp listings sitting > 30 days — soft ceiling on asking rent; solid renter incomes; 348 units permitted in Cowlitz County in 2024 (40 in 5+ unit buildings).
- This rent runs 38% of the median local income ($76k/yr) — at the standard rent-burdened threshold; future hikes will face affordability resistance.
Forward outlook
- Local home prices are declining (-3.0%/yr); year-one equity from $794 of loan paydown is wiped out by about $3k of value loss. Plan a longer hold.
- Cowlitz County population projected to shrink 8% by 2050 — rents likely to lag national; underwrite the cash flow, not the appreciation.
- At projected returns (-3.0% appreciation + 4.1% rent growth), your $32k cash investment doubles in ~3 years — after that, you're playing with house money.
Negotiation context
- It's been on market 98 days — a 9% lower offer ($105k) is reasonable based on typical stale-listing flexibility.
- 3 sale attempts since 14y ago; this cycle's ask has dropped $10k (8%) from the opening price — seller is motivated, your offer sets the floor, not the list.
- Current owner paid $10k; list at $115k implies a 1049% gain — meaningful room to come down on a strong offer.
Questions for the listing agent
- It's been on market 98 days. Have you received any prior offers? Is the seller open to a 9% concession, seller financing, or rate buy-down credit?
- Built in 1977 — when were the roof, HVAC, electrical panel, plumbing, and water heater last replaced?
- Why hasn't it sold? Are there any deal-killer items the seller is aware of (foundation, flood, title, zoning, code violations)?
- Is there a deadline driving the sale (1031 exchange, divorce, estate, relocation)? That informs how much negotiation room exists.
- What's the average days-on-market for RENTAL listings here right now (not sales)? A rising rental-DOM trend means longer vacancies and softer asking-rent achievability than the comps imply.
- What's the recent tenant-quality profile in this submarket — average credit score on applications, eviction rate, late-payment / NSF rate, and stable-employment percentage? A property-management company in the area should have these aggregated.
- How much new for-sale + rental construction is in the pipeline within 1–3 miles? Heavy new supply typically softens prices + rents 12–24 months out; constrained supply supports both.
Investment metrics
- 1% rule
- 2.09% ✓
- Cap rate
- 19.04%
- Cash-on-cash
- 45.51%
- DSCR
- 3.03
- GRM
- 4.0
CMA / ARV
- ARV (median comp)
- $100,000
- List price
- $114,900
- Delta
- 14.90%
- Verdict
- OVERPRICED
- Comps
- 7 within 1.0 mi
Show comp detail 2 sales within ~0.75 mi
| Address | Dist | Beds/Ba | Sqft | Sold | Price | $/sf | Match |
|---|---|---|---|---|---|---|---|
| 1965 Westside Hwy #6 | 0.10mi | 2/2.0 (-1) | 1,368 (-5%) | 9mo | $70,000 | $51 | 74 |
| 1965 West Side Hwy #61 | 0.12mi | 3/2.0 | 1,404 (-2%) | 24mo | $74,000 | $53 | 70 |
Match score weights: distance 35% · size 25% · config 20% · recency 20%. Top-matched comps best support the ARV.
Projected returns pro-forma
-3.0% appreciation · 4.1% rent growth · sell at horizon
- IRR
- 43.8%
- Equity multiple
- 2.92×
- Total profit
- $61,741
- Equity at exit
- $17,132
- IRR
- 50.3%
- Equity multiple
- 6.13×
- Total profit
- $164,939
- Equity at exit
- $9,934
Cash invested: $32,172 (down + closing). Projections, not guarantees.
Landlord ↔ Tenant lean methodology
- Overall (STATE)
- 28 Tenant-Leaning
- State Washington
- 28 Tenant-Leaning · D+8
- County
- — inherits STATE
- City
- — inherits STATE
ZIP-level market 98626
- Rents YoY
- 4.1%
- Active inventory
- 219
- Price-to-rent
- 4.0×
Monthly cashflow live
- Estimated rent
- $2,398 medium interval (Pro) →
- Mortgage (P&I)
- −$603
- Tax from tax record
- −$24 /mo · $284/yr
- Insurance
- −$48
- HOA
- −$0
- Vacancy / Maint / Mgmt
- −$504
- Net cashflow
- $1,220
Break-even live
Sensitivity live
| Price | -10% $1,285 | -5% $1,253 | +0% $1,220 | +5% $1,188 | +10% $1,155 |
|---|---|---|---|---|---|
| Rent | -10% $1,031 | -5% $1,125 | +0% $1,220 | +5% $1,315 | +10% $1,410 |
| Rate | -1.0pp $1,278 | -0.5pp $1,249 | base $1,220 | +0.5pp $1,190 | +1.0pp $1,160 |
UW: 25.0% down · 7.5% · 30yr · 1.5% tax · 5.0% vac · 8.0% maint · 8.0% mgmt
Financing live
Cash to close
- Down payment
- $28,725
- Closing costs
- $3,447
- Reserves months
- —
- Total cash needed
- —
Loan-product check · same deal, 3 products live
Conventional
25% down · 7.5% · 30yr
- Down + closing
- —
- Monthly P&I
- —
- Monthly cashflow
- —
- DSCR
- —
- Eligible?
- —
Personal DTI + credit; lowest rate.
DSCR
20% down · 8.5% · 30yr
- Down + closing
- —
- Monthly P&I
- —
- Monthly cashflow
- —
- DSCR
- —
- Eligible?
- —
No personal income docs; deal must DSCR.
Hard money
10% down · 12.0% · 12mo
- Down + closing
- —
- Monthly P&I
- —
- Monthly cashflow
- —
- DSCR
- —
- Eligible?
- —
Short-term bridge; refi at stabilization.
Rent comps 3 comps
| Address | Beds | Baths | Sqft | Rent | $/sqft | DOM | Units | Dist |
|---|---|---|---|---|---|---|---|---|
| 135 Lexington Ave Kelso, WA | 3.0 | 2.0 | 1682 | $2,895 | $1.72 | 45d | 1 | 0.88mi |
| 118 Chickadee Dr Kelso, WA | 3.0 | 2.0 | 1076 | $2,400 | $2.23 | 45d | 1 | 1.30mi |
| 104 Solomon Rd Kelso, WA | 1.0–2.0 | 1.0–2.0 | 893 | $1,950 | $2.18 | 45d | 7 | 1.40mi |
Listing history 26 events
-
2026-06-21days on market $114,900 Active 98 DOM
-
2026-06-19days on market $114,900 Active 96 DOM
-
2026-06-18days on market $114,900 Active 95 DOM
-
2026-06-17days on market $114,900 Active 94 DOM
-
2026-06-16days on market $114,900 Active 93 DOM
-
2026-06-15days on market $114,900 Active 92 DOM
-
2026-06-14days on market $114,900 Active 90 DOM
-
2026-06-13days on market $114,900 Active 89 DOM
-
2026-06-10days on market $114,900 Active 87 DOM
-
2026-06-09days on market $114,900 Active 86 DOM
-
2026-06-08days on market $114,900 Active 85 DOM
-
2026-06-07days on market $114,900 Active 84 DOM
-
2026-06-03days on market $114,900 Active 80 DOM
-
2026-06-02days on market $114,900 Active 79 DOM
-
2026-06-01days on market $114,900 Active 78 DOM
-
2026-05-31days on market $114,900 Active 77 DOM
-
2026-05-30days on market $114,900 Active 76 DOM
-
2026-03-15$124,900 Active
-
2013-04-03historical
-
2013-03-13soldstatus $10,000 Sold
-
2013-02-22status Pending
-
2013-01-10status Active
-
2013-01-02historical Expired
-
2012-12-20price $10,000
-
2012-09-06price $15,000
-
2012-07-05$27,500 Active
ⓘ Source: listings_history table (triggers on properties + properties_extension) + one-shot
backfill from property_details.listing_events for pre-trigger history.
Tax reassessment forecast WA · Resets to sale price
- Current annual tax
- $284 · $24/mo
- Projected year-2 tax
- $1,126 · $94/mo
- Expected delta
- +$842/yr (+$70/mo · 295.9%)
ⓘ Screening estimate from a state-policy table — verify with the county assessor before closing.
Climate risk First Street
- Flood 1/10 Low FEMA zone X · 0% chance over 30 yrs
- Wildfire 3/10 Moderate
- Heat 3/10 Moderate 7 d/yr ≥89°F today · 15 d/yr by 30 yrs out
- Wind 1/10 Low
- Air quality 7/10 Severe 8 unhealthy d/yr today · 8 by 30 yrs out
Nearby sold comps map
Loading sold comps map…
Walkable amenities ~0.75 mi
Loading nearby amenities…
Taxation est. · year 1
- Rental income
- $28,774
- − Mortgage interest
- −$6,436
- − Property taxes
- −$284
- − Insurance
- −$574
- − Repairs & maintenance
- −$2,302
- − Management
- −$2,302
- − Depreciation
- −$3,343
- Taxable income
- $13,533
- Est. tax owed @ 24.0%
- −$3,248
- After-tax cash flow
- $11,394/yr
For passive investors: Depreciation is non-cash, so a rental often shows a tax loss while cash-flowing — sheltering income. Rental losses are passive: they offset passive income freely, and up to $25,000/yr can offset ordinary (W-2) income if you actively participate and your MAGI is under $100k (phasing out to $0 by $150k); unused losses carry forward. On sale, claimed depreciation is recaptured at up to 25%, and gains may owe capital-gains tax (a 1031 exchange can defer both). Figures are a year-1 estimate at your 24.0% rate — not tax advice; consult a CPA.
Schools (NCES district)
- District
- Kelso School District
- NCES district ID
- 5300003
- Math proficiency
- 35% ▼ -2.00%
- Reading proficiency
- 53% ▼ -1.00%
- Median HH income
- $47,840
- Composite
- 39.83/100
- National rank
- #7963
- State rank
- #191 of 291 in WA
Livability — Lexington
No livability data for this city. (Only ~50 U.S. cities are tracked.)
Census & demographics
- Census place
- Lexington, WA
- County
- Cowlitz County · 77,527 people
- Metro
- Longview, WA
- Population (ZIP)
- 26,892
- Household income
- $75,528
- Rent vs Own
- Severe rent burden
- 722.0
Population outlook (Cowlitz County) Hauer SSP2
- Today (2025)
- 104,780 people
- By 2030
- 103,980 · -0.8%
- By 2040
- 100,769 · -3.8%
- By 2050
- 96,685 · -7.7%
- By 2075
- 86,454 · -17.5%
- By 2100
- 74,052 · -29.3%
Race, ethnicity, and origin ACS 2023
- Neighborhood character
- Predominantly White (85%)
- Race & ethnicity
- White 85% Hispanic / Latino 7% Two or more races 7% Native American 2% Asian 1%
- Hispanic origin (detail)
- Mexican 5%
- Common ancestry
- Portuguese 5% Slovak 4% Italian 3%
- Foreign-born
- 3% · Canada
- Languages at home
- 95% English-only · Spanish 3% Tagalog/Filipino 1%
Political lean MEDSL · Cowlitz
- 2024 margin
- R (+19.9) · D 38.7% · R 58.6% · Other 2.7%
- 2008→2024 swing
- -31.1pp toward R · 2008: 11.2pp · 2024: -19.9pp
- All cycles
- 2024: R+19.9 2020: R+17.4 2016: R+13.7 2012: D+4.4 2008: D+11.2
Not yet ingested
- Civics
- —
Market trends
- HPI YoY
- ▼ -321.36%
- Current HPI
- 262.8196
- Rent YoY
- ▲ 4.10%
- Metro
- Longview, WA
- State GDP YoY
- ▲ 4.65%
- F500 in state
- 22
Industry mix (Fortune 500 HQ in WA)
| Industry | F500 HQs | Revenue |
|---|---|---|
| Retail | 2 | $269B |
|
||
| Technology / Retail | 1 | $638B |
|
||
| Technology | 1 | $245B |
|
||
| Telecommunications | 1 | $38B |
|
||
| Food / Beverage | 1 | $36B |
|
||
| Automotive / Trucks | 1 | $34B |
|
||
Price history
+354.2% since first listed9 events — show timeline
- 2026-03-15 Listed $124,900 NWMLS as Distributed by MLS Grid
- 2013-04-03 Delisted — NWMLS as Distributed by MLS Grid
- 2013-03-13 Sold (MLS) $10,000 NWMLS as Distributed by MLS Grid
- 2013-02-22 Pending — NWMLS as Distributed by MLS Grid
- 2013-01-10 Relisted — NWMLS as Distributed by MLS Grid
- 2013-01-02 Delisted — NWMLS as Distributed by MLS Grid
- 2012-12-20 Price Changed $10,000 NWMLS as Distributed by MLS Grid
- 2012-09-06 Price Changed $15,000 NWMLS as Distributed by MLS Grid
- 2012-07-05 Listed $27,500 NWMLS as Distributed by MLS Grid
Property tax history
-1.6%/yrLatest (2026): $284 · -0.4% YoY. Source: county tax records.
Cash-flow waterfall
monthlySold comps — $/sqft
last 12 mo · ≤1 miLoading sold comps…