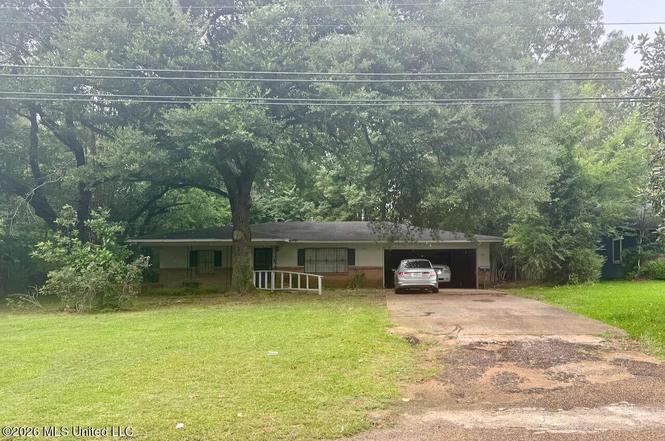
355 W Magnolia Rd · Jackson, MS
Flood risk 1/10 · Minimal
- FEMA flood zone
- X (unshaded)
- Chance of flooding over 30 yrs
- 0.0%
- Est. flood insurance / yr
- $507 – $1,088
Fire risk 1/10 · Minimal
- Est. fire insurance / yr
- $1,241 – $2,305
Heat risk 7/10 · Major
- Hot days now (above 109°F)
- 7 days/yr
- Hot days in 30 yrs
- 20 days/yr
Wind risk 8/10 · Major
- Chance of severe wind over 30 yrs
- 80.0%
Air-quality risk 1/10 · Minimal
- Unhealthy air days now
- 0 days/yr
- Unhealthy air days in 30 yrs
- 0 days/yr
Risk factors via First Street. Map © Google.
Why this score? — see what drove the C grade
The composite is a weighted blend of 9 inputs, each scored 0–100. Each bar is that input's sub-score; the figure is the points it added to the 100-point composite (weight × sub-score).
- Cash flow +25.4/30.0
- Appreciation +10.0/10.0
- DSCR +8.4/10.0
- 1% rule +6.5/10.0
- Livability +3.4/5.0
- Rent growth +2.5/5.0
- Condition / age +2.5/5.0
- Schools +1.1/10.0
- ARV discount +0.0/15.0
$113,200
🖨 Deal sheet 📄 Offer letter ✓ Due diligence
Listing remarks
Investment opportunity available in Jackson. This tenant-occupied property offers 3 bedrooms, 2 bathrooms, and approximately 1,528 square feet. The property is currently leased, making it a potential option for buyers looking for a property with an existing tenant in place.
Key facts
- 0.32 acre lot
- 2 garage spots
- Built 1969
Property features AI
Finance
- Other: Lot approximately 0.32 acres
- Financial info: $1,567 annual taxes (2025)
Exterior
- Parking: 2 total parking spaces; 2-car garage
- Security: Security system
- Utilities: Public water; Public sewer; Cable connected; Electricity connected; Water connected; Sewer connected
- Home design: Single-family house; One level
- Construction: Brick construction; Slab foundation; Built (year from public records)
- Exterior features: Asphalt roof
Interior
- Kitchen: Oven
- Bathrooms: 2 full bathrooms
- Heating & cooling: Central heating; Central air conditioning
- Interior features: Move-in ready; Security system
Neighborhood map
What this means for you Summary
Snapshot
- This is a 3-bed/2.0-bath single-family listed at $113k.
Deal economics
- At list price, monthly cash flow is $259 ($3k/yr) — positive.
- The deal already cash-flows at list — no discount required.
- Meets the 1% rule at list price ($1k rent vs $113k).
Location & tenants
- Location reads 68/100 on livability (#66 in MS) — a middle-class / working-renter tenant base. Strengths: commute A+, cost of living A+, housing A+; Watch: amenities F, employment F, health & safety F.
- Jackson Public School District (urban): math 9% / reading 18% proficiency, ranked #112 of 130 in MS (top 86%) — low school quality limits family demand, transient renter base, plan for 1-2y turnover; 88% free/reduced lunch — lower-income household profile, screen leases tightly.
- Zoned schools: John Hopkins Elementary School (math 2% / reading 12%, grade F, #337 of 375 statewide, top 94%, 280 students, 100% FRL); Provine High School (math 4% / reading 15%, grade F, #179 of 197 statewide, top 92%, 774 students, 100% FRL).
- Market conditions: 165 active listings in the ZIP; 3 comparable units currently listed for rent nearby; rentals leasing fast (median 14d on market — plan ~1-2 weeks tenant-placement turnaround); lower-income renter base — watch delinquency; 167 units permitted in Hinds County in 2024 (0 in 5+ unit buildings).
- This rent runs 43% of the median local income ($36k/yr) — at the standard rent-burdened threshold; future hikes will face affordability resistance.
Forward outlook
- In year one you build about $12k of equity ($783 loan paydown + $11k appreciation (10.0% local appreciation)).
- Hinds County population projected to shrink 6% by 2050 — rents likely to lag national; underwrite the cash flow, not the appreciation.
- At projected returns (10.0% appreciation + 3.0% rent growth), your $32k cash investment doubles in ~2 years — after that, you're playing with house money.
- By year 3, paydown + projected appreciation supports a ~$31k cash-out refi (75% LTV) — recoverable capital for the next deal without selling this one.
Negotiation context
- Only 7 days on market — expect competitive offers; lowballing is unlikely to land.
- 4 sale attempts since 23y ago with the ask held roughly flat each time — persistent listings suggest the price (not the market) is what's stuck; bring a comps-based counter.
Risks & watch-outs
- Climate carrying-cost: severe wind risk, 80% chance of damaging wind over 30y; extreme-heat days projected 7→20/yr by 2055 (HVAC capex compounding) — expect insurance premiums to compound above CPI over the hold.
Questions for the listing agent
- Built in 1969 — when were the roof, HVAC, electrical panel, plumbing, and water heater last replaced?
- Is there a deadline driving the sale (1031 exchange, divorce, estate, relocation)? That informs how much negotiation room exists.
- Schools are F-rated, which usually means shorter tenancies and higher turnover. Who's the typical renter profile here, and what's been the actual vacancy rate?
- What's the average days-on-market for RENTAL listings here right now (not sales)? A rising rental-DOM trend means longer vacancies and softer asking-rent achievability than the comps imply.
- What's the recent tenant-quality profile in this submarket — average credit score on applications, eviction rate, late-payment / NSF rate, and stable-employment percentage? A property-management company in the area should have these aggregated.
- How much new for-sale + rental construction is in the pipeline within 1–3 miles? Heavy new supply typically softens prices + rents 12–24 months out; constrained supply supports both.
Investment metrics
- 1% rule
- 1.15% ✓
- Cap rate
- 9.04%
- Cash-on-cash
- 9.82%
- DSCR
- 1.44
- GRM
- 7.2
CMA / ARV
- ARV (on-the-fly)
- $88,624
- Comps found
- 12
Show comp detail 12 sales within ~0.75 mi
| Address | Dist | Beds/Ba | Sqft | Sold | Price | $/sf | Match |
|---|---|---|---|---|---|---|---|
| 5721 Magnolia Dr | 0.22mi | 3/2.0 | 1,571 (+3%) | 0mo | $70,000 | $45 | 84 |
| 5554 Clinton Blvd | 0.44mi | 3/2.0 | 1,537 (+1%) | 13mo | $199,900 | $130 | 68 |
| 344 Queen Margaret Ln | 0.21mi | 3/2.0 | 1,300 (-15%) | 1mo | $74,900 | $58 | 65 |
| 131 Queen Joanna Ln | 0.37mi | 3/2.0 | 1,376 (-10%) | 6mo | $68,000 | $49 | 61 |
| 506 Lowder Dr | 0.32mi | 3/1.5 | 1,318 (-14%) | 4mo | $62,500 | $47 | 57 |
| 5219 Queen Eleanor Ln | 0.67mi | 3/2.0 | 1,424 (-7%) | 2mo | $108,500 | $76 | 56 |
| 5585 Queen Eleanor Ln | 0.32mi | 3/1.5 | 1,348 (-12%) | 11mo | $95,000 | $70 | 54 |
| 120 Queen Joanna Ln | 0.40mi | 3/2.0 | 1,700 (+11%) | 11mo | $84,900 | $50 | 54 |
| 5270 Mattox St | 0.59mi | 4/1.5 (+1) | 1,499 (-2%) | 11mo | $117,900 | $79 | 53 |
| 237 Queen Anne Ln | 0.30mi | 3/1.5 | 1,300 (-15%) | 8mo | $44,500 | $34 | 52 |
| 5151 Ginger Dr | 0.67mi | 3/2.0 | 1,400 (-8%) | 8mo | $95,000 | $68 | 48 |
| 664 Queen Julianna Ln | 0.56mi | 4/1.5 (+1) | 1,300 (-15%) | 2mo | $65,000 | $50 | 40 |
Match score weights: distance 35% · size 25% · config 20% · recency 20%. Top-matched comps best support the ARV.
Projected returns pro-forma
10.0% appreciation · 3.0% rent growth · sell at horizon
- IRR
- 31.5%
- Equity multiple
- 3.47×
- Total profit
- $78,178
- Equity at exit
- $101,980
- IRR
- 27.2%
- Equity multiple
- 7.85×
- Total profit
- $217,262
- Equity at exit
- $219,923
Cash invested: $31,696 (down + closing). Projections, not guarantees.
Landlord ↔ Tenant lean methodology
- Overall (STATE)
- 90 Strongly Landlord-Friendly
- State Mississippi
- 90 Strongly Landlord-Friendly · R+11
- County
- — inherits STATE
- City
- — inherits STATE
ZIP-level market 39209
- Home prices YoY
- 7.7%
- Active inventory
- 165
- Price-to-rent
- 7.2×
Monthly cashflow live
- Estimated rent
- $1,305 medium interval (Pro) →
- Mortgage (P&I)
- −$594
- Tax from tax record
- −$131 /mo · $1,567/yr
- Insurance
- −$47
- HOA
- −$0
- Vacancy / Maint / Mgmt
- −$274
- Net cashflow
- $259
Break-even live
UW: 25.0% down · 7.5% · 30yr · 1.5% tax · 5.0% vac · 8.0% maint · 8.0% mgmt
Financing live
Cash to close
- Down payment
- $28,300
- Closing costs
- $3,396
- Reserves months
- —
- Total cash needed
- —
Loan-product check · same deal, 3 products live
Conventional
25% down · 7.5% · 30yr
- Down + closing
- —
- Monthly P&I
- —
- Monthly cashflow
- —
- DSCR
- —
- Eligible?
- —
Personal DTI + credit; lowest rate.
DSCR
20% down · 8.5% · 30yr
- Down + closing
- —
- Monthly P&I
- —
- Monthly cashflow
- —
- DSCR
- —
- Eligible?
- —
No personal income docs; deal must DSCR.
Hard money
10% down · 12.0% · 12mo
- Down + closing
- —
- Monthly P&I
- —
- Monthly cashflow
- —
- DSCR
- —
- Eligible?
- —
Short-term bridge; refi at stabilization.
Rent comps 3 comps
| Address | Beds | Baths | Sqft | Rent | $/sqft | DOM | Units | Dist |
|---|---|---|---|---|---|---|---|---|
| 5629 Queen Mary Ln Jackson, MS | 3.0 | 2.0 | 1272 | $1,395 | $1.10 | 13d | 1 | 0.14mi |
| 5301 Queen Mary Ln Jackson, MS | 4.0 | 2.0 | 1100 | $1,338 | $1.22 | 13d | 1 | 0.56mi |
| 127 Barbara Ave Jackson, MS | 3.0 | 1.0 | 1584 | $850 | $0.54 | 21d | 1 | 1.17mi |
Listing history 7 events
-
2026-06-18days on market $113,200 Active 7 DOM
-
2026-06-17days on market $113,200 Active 6 DOM
-
2026-06-16days on market $113,200 Active 5 DOM
-
2026-06-15days on market $113,200 Active 4 DOM
-
2026-06-14days on market $113,200 Active 2 DOM
-
2026-06-13remarks 274-char remark
-
2026-06-13$113,200 Active 1 DOM
ⓘ Source: listings_history table (triggers on properties + properties_extension) + one-shot
backfill from property_details.listing_events for pre-trigger history.
Tax reassessment forecast MS · Resets to sale price
- Current annual tax
- $1,567 · $131/mo
- Projected year-2 tax
- $1,567 · $131/mo
- Expected delta
- $0/yr ($0/mo · 0.0%)
ⓘ Screening estimate from a state-policy table — verify with the county assessor before closing.
Climate risk First Street
- Flood 1/10 Low FEMA zone X (unshaded) · 0% chance over 30 yrs
- Wildfire 1/10 Low
- Heat 7/10 Severe 7 d/yr ≥109°F today · 20 d/yr by 30 yrs out
- Wind 8/10 Severe 80% chance of damaging wind over 30 yrs
- Air quality 1/10 Low 0 unhealthy d/yr today · 0 by 30 yrs out
Nearby sold comps map
Loading sold comps map…
Walkable amenities ~0.75 mi
Loading nearby amenities…
Taxation est. · year 1
- Rental income
- $15,656
- − Mortgage interest
- −$6,341
- − Property taxes
- −$1,567
- − Insurance
- −$566
- − Repairs & maintenance
- −$1,252
- − Management
- −$1,252
- − Depreciation
- −$3,293
- Taxable income
- $1,384
- Est. tax owed @ 24.0%
- −$332
- After-tax cash flow
- $2,779/yr
For passive investors: Depreciation is non-cash, so a rental often shows a tax loss while cash-flowing — sheltering income. Rental losses are passive: they offset passive income freely, and up to $25,000/yr can offset ordinary (W-2) income if you actively participate and your MAGI is under $100k (phasing out to $0 by $150k); unused losses carry forward. On sale, claimed depreciation is recaptured at up to 25%, and gains may owe capital-gains tax (a 1031 exchange can defer both). Figures are a year-1 estimate at your 24.0% rate — not tax advice; consult a CPA.
Schools (NCES district)
- District
- Jackson Public School District
- NCES district ID
- 2802190
- Math proficiency
- 9% ▼ -14.00%
- Reading proficiency
- 18% ▼ -7.00%
- Median HH income
- $33,234
- Composite
- 10.89/100
- National rank
- #9755
- State rank
- #112 of 130 in MS
Livability — Jackson
- Score
- 68/100
- State rank
- #66
- US rank
- #9695
Category grades
Schools grade is shown separately in the Schools card above.
Census & demographics
- Census place
- Jackson, MS
- County
- Hinds County · 167,040 people
- City population
- 140,204
- Metro
- Jackson, MS
- Population (ZIP)
- 25,776
- Household income
- $36,344
- Rent vs Own
- Severe rent burden
- 1627.0
Population outlook (Hinds County) Hauer SSP2
- Today (2025)
- 242,528 people
- By 2030
- 241,113 · -0.6%
- By 2040
- 235,557 · -2.9%
- By 2050
- 226,946 · -6.4%
- By 2075
- 199,995 · -17.5%
- By 2100
- 164,165 · -32.3%
Race, ethnicity, and origin ACS 2023
- Neighborhood character
- Predominantly Black (90%)
- Race & ethnicity
- Black 90% White 7% Two or more races 2% Hispanic / Latino 1%
- Foreign-born
- 1% · Canada
- Languages at home
- 98% English-only · Spanish 2%
Political lean MEDSL · Hinds
- 2024 margin
- Solid D (+46.1) · D 72.4% · R 26.3% · Other 1.4%
- 2008→2024 swing
- +7.1pp toward D · 2008: 39.0pp · 2024: 46.1pp
- All cycles
- 2024: D+46.1 2020: D+48.3 2016: D+43.7 2012: D+45.1 2008: D+39.0
Not yet ingested
- Civics
- —
Market trends
- HPI YoY
- ▲ 22.28%
- Current HPI
- 312.6754
- Rent YoY
- —
- Metro
- Jackson, MS
- State GDP YoY
- —
- F500 in state
- 0
Price history
+61.7% since first listed11 events — show timeline
- 2026-06-11 Listed $113,200 MLSU
- 2023-12-09 Rental Removed $1,050 APPFOLIO
- 2023-11-17 Listed for Rent $1,050 APPFOLIO
- 2021-10-01 Listing Removed — MLSU
- 2021-10-01 Listing Removed — MLSU
- 2020-07-24 Sold (Public Records) — Public Records
- 2005-02-01 Sold (Public Records) — Public Records
- 2004-09-14 Listed $68,000 MLSU
- 2003-07-30 Listed $70,000 MLSU
- 1987-07-31 Sold (Public Records) — Public Records
- 1977-08-29 Sold (Public Records) — Public Records
Property tax history
+7.6%/yrLatest (2025): $1,567 · +2.5% YoY. Source: county tax records.
Cash-flow waterfall
monthlySold comps — $/sqft
last 12 mo · ≤1 miLoading sold comps…