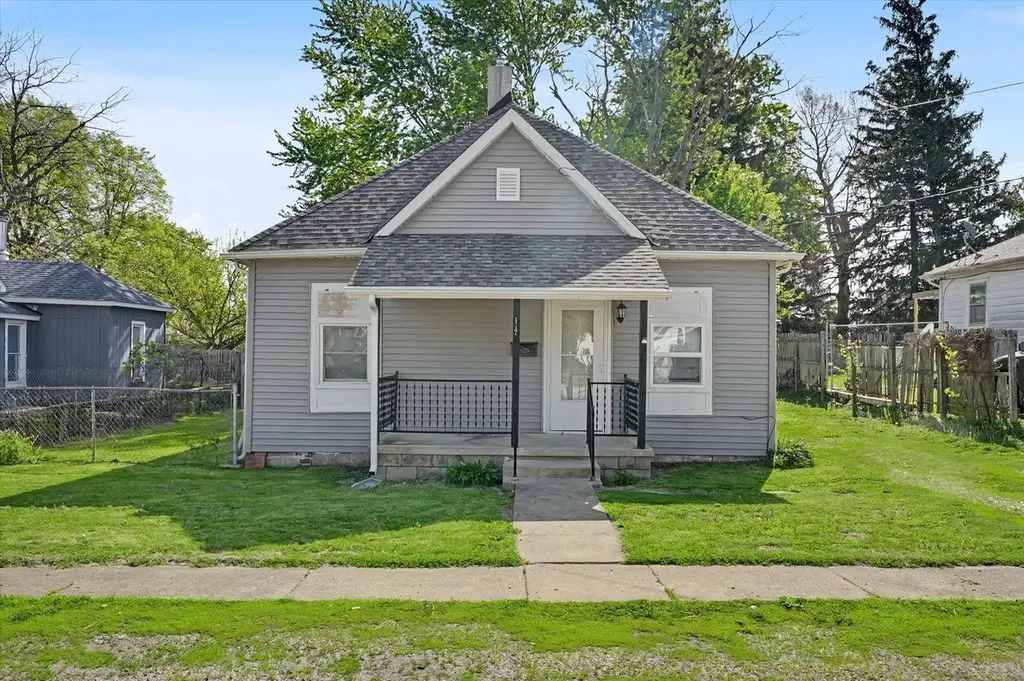
117 N Scott St · Westville, IL
Flood risk 4/10 · Minor
- FEMA flood zone
- X (unshaded)
- Chance of flooding over 30 yrs
- 0.22%
- Est. flood insurance / yr
- $473 – $860
Fire risk 1/10 · Minimal
- Est. fire insurance / yr
- $804 – $1,492
Heat risk 3/10 · Minor
- Hot days now (above 104°F)
- 7 days/yr
- Hot days in 30 yrs
- 18 days/yr
Wind risk 2/10 · Minimal
- Chance of severe wind over 30 yrs
- 1.0%
Air-quality risk 2/10 · Minimal
- Unhealthy air days now
- 1 days/yr
- Unhealthy air days in 30 yrs
- 1 days/yr
Risk factors via First Street. Map © Google.
Why this score? — see what drove the C- grade
The composite is a weighted blend of 9 inputs, each scored 0–100. Each bar is that input's sub-score; the figure is the points it added to the 100-point composite (weight × sub-score).
- Cash flow +15.8/30.0
- ARV discount +13.6/15.0
- Appreciation +5.5/10.0
- DSCR +4.9/10.0
- 1% rule +4.0/10.0
- Livability +3.5/5.0
- Rent growth +2.5/5.0
- Condition / age +2.5/5.0
- Schools +0.8/10.0
$79,900
🖨 Deal sheet 📄 Offer letter ✓ Due diligence
Listing remarks MLS
Welcome home to this move-in ready 2-bedroom, 1 bath home in Westville! This well-maintained property features newer windows, a roof replaced in 2019, and a functional layout. Enjoy a large fenced-in yard perfect for pets or entertaining plus a one-car detached garage for added convenience. Great opportunity for homeowners or investors! Call for your private tour before it's too late! 217-778-3092
Key facts
- Newer windows
- Roof replaced
- Fenced-in yard
Tags
Property features AI
Finance
- Financial info: Tax exemptions: Homeowner
- HOA & community: No master association fee required
Exterior
- Parking: Detached owned garage (1 car)
- Utilities: Public water; Public sewer; Power: natural gas available for heating
- Home design: Detached single-family home; One-story
- Construction: Vinyl siding; Built before 1978 (approximately 81–90 years old)
- Exterior features: Lot dimensions approximately 40 x 88; Lot smaller than 0.25 acre
Interior
- Kitchen: Kitchen with linoleum flooring
- Bedrooms: 2 bedrooms (main level); Master bedroom on main level
- Flooring: Plank flooring in living room and bedrooms; Linoleum flooring in kitchen
- Bathrooms: 1 full bathroom
- Heating & cooling: Natural gas forced-air heating; Central air conditioning
- Interior features: Estimated living area; 4 total rooms
- Laundry & utility: Main-level laundry room (18 x 5)
Neighborhood map
What this means for you Summary
Snapshot
- This is a 2-bed/1.0-bath single-family listed at $80k.
Deal economics
- At list price, monthly cash flow is $37 ($444/yr) — positive.
- The deal already cash-flows at list — no discount required.
- To meet the 1% rule (rent ≥ 1% of price), the offer needs to be $72k (9.6% below list).
- Recommended offer: $72k (9.6% below list) — sets the bar for 1% rule.
Location & tenants
- Location reads 69/100 on livability (#404 in IL) — a middle-class / working-renter tenant base. Strengths: cost of living A+, housing A+, health & safety A+; Watch: employment D+, amenities F, commute F.
- Westville CUSD 2 (suburban): math 8% / reading 9% proficiency, ranked #590 of 620 in IL (top 95%) — low school quality limits family demand, transient renter base, plan for 1-2y turnover.
- Zoned schools: Westville Jr High School (math 8% / reading 8%, grade F, #612 of 665 statewide, top 93%, 177 students, 0% FRL); Westville High School (math 8% / reading 8%, grade F, #589 of 693 statewide, top 86%, 350 students, 0% FRL) — zoned schools average 0% FRL vs 54% district-wide (54 pts lower); this property's tenant base skews higher-income than the district average.
- Market conditions: 15 active listings in the ZIP; 3 comparable units currently listed for rent nearby; rentals leasing fast (median 13d on market — plan ~1-2 weeks tenant-placement turnaround); 8 units permitted in Vermilion County in 2024 (0 in 5+ unit buildings).
Forward outlook
- In year one you build about $1k of equity ($552 loan paydown + $805 appreciation (1.0% local appreciation)).
- Vermilion County population projected at -24% by 2050 — secular population decline; favor cash flow + early exit over multi-decade hold.
- At projected returns (1.0% appreciation + 3.0% rent growth), your $22k cash investment doubles in ~9 years — after that, you're playing with house money.
Negotiation context
- It's been on market 56 days — a 3% lower offer ($78k) is reasonable based on typical stale-listing flexibility.
- 4 sale attempts since 3y ago; this cycle's ask has dropped $10k (11%) from the opening price — seller is motivated, your offer sets the floor, not the list.
- Current owner paid $60k; 33% above their basis — modest negotiation headroom, anchor on the comps not their cost.
Risks & watch-outs
- Watch-outs: built in 1941 — expect roof / HVAC / electrical / plumbing capex.
Questions for the listing agent
- It's been on market 56 days. Have you received any prior offers? Is the seller open to a 10% concession, seller financing, or rate buy-down credit?
- Built in 1941 — when were the roof, HVAC, electrical panel, plumbing, and water heater last replaced?
- Is there a deadline driving the sale (1031 exchange, divorce, estate, relocation)? That informs how much negotiation room exists.
- Schools are F-rated, which usually means shorter tenancies and higher turnover. Who's the typical renter profile here, and what's been the actual vacancy rate?
- What's the average days-on-market for RENTAL listings here right now (not sales)? A rising rental-DOM trend means longer vacancies and softer asking-rent achievability than the comps imply.
- What's the recent tenant-quality profile in this submarket — average credit score on applications, eviction rate, late-payment / NSF rate, and stable-employment percentage? A property-management company in the area should have these aggregated.
- How much new for-sale + rental construction is in the pipeline within 1–3 miles? Heavy new supply typically softens prices + rents 12–24 months out; constrained supply supports both.
Investment metrics
- 1% rule
- 0.90% ✗
- Cap rate
- 6.85%
- Cash-on-cash
- 1.98%
- DSCR
- 1.09
- GRM
- 9.2
CMA / ARV
- ARV (median comp)
- $92,428
- List price
- $79,900
- Delta
- -13.55%
- Verdict
- UNDERPRICED
- Comps
- 20 within 1.0 mi
Show comp detail 3 sales within ~0.75 mi
| Address | Dist | Beds/Ba | Sqft | Sold | Price | $/sf | Match |
|---|---|---|---|---|---|---|---|
| 125 Illinois Ave | 0.58mi | 2/1.0 | 900 (+6%) | 6mo | $121,250 | $135 | 58 |
| 204 Pennsylvania Ave | 0.46mi | 2/1.0 | 900 (+6%) | 22mo | $88,000 | $98 | 49 |
| 520 Indiana Ave | 0.65mi | 3/2.0 (+1) | 970 (+14%) | 12mo | $178,000 | $184 | 27 |
Match score weights: distance 35% · size 25% · config 20% · recency 20%. Top-matched comps best support the ARV.
Projected returns pro-forma
1.01% appreciation · 3.0% rent growth · sell at horizon
- IRR
- 3.4%
- Equity multiple
- 1.17×
- Total profit
- $3,877
- Equity at exit
- $27,307
- IRR
- 7.9%
- Equity multiple
- 1.96×
- Total profit
- $21,445
- Equity at exit
- $36,311
Cash invested: $22,372 (down + closing). Projections, not guarantees.
Landlord ↔ Tenant lean methodology
- Overall (STATE)
- 43 Moderately Tenant-Leaning
- State Illinois
- 43 Moderately Tenant-Leaning · D+7
- County
- — inherits STATE
- City
- — inherits STATE
ZIP-level market 61883
- Home prices YoY
- 0.4%
- Active inventory
- 15
- Price-to-rent
- 9.2×
Monthly cashflow live
- Estimated rent
- $722 medium interval (Pro) →
- Mortgage (P&I)
- −$419
- Tax from tax record
- −$81 /mo · $974/yr
- Insurance
- −$33
- HOA
- −$0
- Vacancy / Maint / Mgmt
- −$152
- Net cashflow
- $37
Break-even live
UW: 25.0% down · 7.5% · 30yr · 1.5% tax · 5.0% vac · 8.0% maint · 8.0% mgmt
Financing live
Cash to close
- Down payment
- $19,975
- Closing costs
- $2,397
- Reserves months
- —
- Total cash needed
- —
Loan-product check · same deal, 3 products live
Conventional
25% down · 7.5% · 30yr
- Down + closing
- —
- Monthly P&I
- —
- Monthly cashflow
- —
- DSCR
- —
- Eligible?
- —
Personal DTI + credit; lowest rate.
DSCR
20% down · 8.5% · 30yr
- Down + closing
- —
- Monthly P&I
- —
- Monthly cashflow
- —
- DSCR
- —
- Eligible?
- —
No personal income docs; deal must DSCR.
Hard money
10% down · 12.0% · 12mo
- Down + closing
- —
- Monthly P&I
- —
- Monthly cashflow
- —
- DSCR
- —
- Eligible?
- —
Short-term bridge; refi at stabilization.
Rent comps 3 comps
| Address | Beds | Baths | Sqft | Rent | $/sqft | DOM | Units | Dist |
|---|---|---|---|---|---|---|---|---|
| 215 Cook St Westville, IL | 1.0 | 1.0 | 700 | $650 | $0.93 | 12d | 1 | 0.13mi |
| 3 Church St Westville, IL | 3.0 | 1.0 | 1100 | $995 | $0.90 | 12d | 1 | 0.74mi |
| 220 Kentucky Ave Westville, IL | 2.0 | 1.0 | 900 | $875 | $0.97 | 3d | 1 | 0.83mi |
Listing history 34 events
-
2026-06-19days on market $79,900 Active 56 DOM
-
2026-06-18days on market $79,900 Active 55 DOM
-
2026-06-17days on market $79,900 Active 54 DOM
-
2026-06-16days on market $79,900 Active 53 DOM
-
2026-06-15days on market $79,900 Active 52 DOM
-
2026-06-14days on market $79,900 Active 50 DOM
-
2026-06-13days on market $79,900 Active 49 DOM
-
2026-06-10days on market $79,900 Active 47 DOM
-
2026-06-09days on market $79,900 Active 46 DOM
-
2026-06-08days on market $79,900 Active 45 DOM
-
2026-06-07days on market $79,900 Active 44 DOM
-
2026-06-05days on market $79,900 Active 41 DOM
-
2026-06-03days on market $79,900 Active 40 DOM
-
2026-06-02days on market $79,900 Active 39 DOM
-
2026-06-01days on market $79,900 Active 38 DOM
-
2026-05-31days on market $79,900 Active 37 DOM
-
2026-05-30days on market $79,900 Active 36 DOM
-
2026-05-11price $79,900 392-char remark
Show marketing remark (401 chars)
Welcome home to this move-in ready 2-bedroom, 1 bath home in Westville! This well-maintained property features newer windows, a roof replaced in 2019, and a functional layout. Enjoy a large fenced-in yard perfect for pets or entertaining plus a one-car detached garage for added convenience. Great opportunity for homeowners or investors! Call for your private tour before it's too late! 217-778-3092
-
2026-05-05price $79,900 392-char remark
-
2026-04-24$89,900 Active 392-char remark
-
2026-04-24historical
-
2026-04-22$89,900 Active 392-char remark
Show marketing remark (401 chars)
Welcome home to this move-in ready 2-bedroom, 1 bath home in Westville! This well-maintained property features newer windows, a roof replaced in 2019, and a functional layout. Enjoy a large fenced-in yard perfect for pets or entertaining plus a one-car detached garage for added convenience. Great opportunity for homeowners or investors! Call for your private tour before it's too late! 217-778-3092
-
2023-09-01soldstatus $60,000 Closed
-
2023-09-01soldstatus $60,000 Closed
-
2023-09-01soldstatus $60,000
-
2023-08-27status Pending
-
2023-08-22historical
-
2023-08-05status Pending
-
2023-08-05status Pending
-
2023-07-16historical Contingent - Continue to Show
-
2023-07-16historical Active Under Contract
-
2023-07-12$59,000 Active
-
2023-07-12$59,000 Active
-
2007-01-19soldstatus $38,000
ⓘ Source: listings_history table (triggers on properties + properties_extension) + one-shot
backfill from property_details.listing_events for pre-trigger history.
Tax reassessment forecast IL · Partial reset (capped growth)
- Current annual tax
- $974 · $81/mo
- Projected year-2 tax
- $1,394 · $116/mo
- Expected delta
- +$420/yr (+$35/mo · 43.1%)
ⓘ Screening estimate from a state-policy table — verify with the county assessor before closing.
Climate risk First Street
- Flood 4/10 Moderate FEMA zone X (unshaded) · 22% chance over 30 yrs
- Wildfire 1/10 Low
- Heat 3/10 Moderate 7 d/yr ≥104°F today · 18 d/yr by 30 yrs out
- Wind 2/10 Low 100% chance of damaging wind over 30 yrs
- Air quality 2/10 Low 1 unhealthy d/yr today · 1 by 30 yrs out
Nearby sold comps map
Loading sold comps map…
Walkable amenities ~0.75 mi
Loading nearby amenities…
Taxation est. · year 1
- Rental income
- $8,664
- − Mortgage interest
- −$4,476
- − Property taxes
- −$974
- − Insurance
- −$400
- − Repairs & maintenance
- −$693
- − Management
- −$693
- − Depreciation
- −$2,324
- Taxable loss
- −$895
- Est. tax savings @ 24.0%
- +$215
- After-tax cash flow
- $659/yr
For passive investors: Depreciation is non-cash, so a rental often shows a tax loss while cash-flowing — sheltering income. Rental losses are passive: they offset passive income freely, and up to $25,000/yr can offset ordinary (W-2) income if you actively participate and your MAGI is under $100k (phasing out to $0 by $150k); unused losses carry forward. On sale, claimed depreciation is recaptured at up to 25%, and gains may owe capital-gains tax (a 1031 exchange can defer both). Figures are a year-1 estimate at your 24.0% rate — not tax advice; consult a CPA.
Schools (NCES district)
- District
- Westville CUSD 2
- NCES district ID
- 1710820
- Math proficiency
- 8% ▼ -4.00%
- Reading proficiency
- 9% ▼ -4.00%
- Median HH income
- $41,214
- Composite
- 7.54/100
- National rank
- #9949
- State rank
- #590 of 620 in IL
Livability — Westville
- Score
- 69/100
- State rank
- #404
- US rank
- #8382
Category grades
Schools grade is shown separately in the Schools card above.
Census & demographics
- Census place
- Westville, IL
- City population
- 4,424
- Population (ZIP)
- 4,424
Population outlook (Vermilion County) Hauer SSP2
- Today (2025)
- 72,775 people
- By 2030
- 69,235 · -4.9%
- By 2040
- 62,360 · -14.3%
- By 2050
- 55,539 · -23.7%
- By 2075
- 40,606 · -44.2%
- By 2100
- 26,985 · -62.9%
Race, ethnicity, and origin ACS 2023
- Neighborhood character
- Predominantly White (95%)
- Race & ethnicity
- White 95% Two or more races 2% Hispanic / Latino 1%
- Common ancestry
- Romanian 4% Lithuanian 3% Slovak 2%
- Foreign-born
- 1%
- Languages at home
- 98% English-only · Spanish 2%
Political lean MEDSL · Vermilion
- 2024 margin
- Solid R (+35.7) · D 31.4% · R 67.0% · Other 1.6%
- 2008→2024 swing
- -36.2pp toward R · 2008: 0.6pp · 2024: -35.7pp
- All cycles
- 2024: R+35.7 2020: R+32.9 2016: R+29.2 2012: R+15.7 2008: D+0.6
Not yet ingested
- Civics
- —
Market trends
- HPI YoY
- ▲ 1.01%
- Current HPI
- 230.8944
- Rent YoY
- —
- Metro
- —
- State GDP YoY
- ▲ 1.59%
- F500 in state
- 60
Industry mix (Fortune 500 HQ in IL)
| Industry | F500 HQs | Revenue |
|---|---|---|
| Insurance | 4 | $201B |
|
||
| Consumer Goods | 4 | $87B |
|
||
| Industrial Machinery | 3 | $64B |
|
||
| Healthcare | 2 | $55B |
|
||
| Retail / Pharmacy | 1 | $148B |
|
||
| Agriculture / Food | 1 | $86B |
|
||
Price history
+110.3% since first listed17 events — show timeline
- 2026-05-11 Price Changed $79,900 CIBR
- 2026-05-05 Price Changed $79,900 MRED as Distributed by MLS Grid
- 2026-04-24 Listing Removed — MRED as Distributed by MLS Grid
- 2026-04-24 Listed $89,900 MRED as Distributed by MLS Grid
- 2026-04-22 Listed $89,900 CIBR
- 2023-09-01 Sold (Public Records) $60,000 Public Records
- 2023-09-01 Sold (MLS) $60,000 CIBR
- 2023-09-01 Sold (MLS) $60,000 MRED as Distributed by MLS Grid
- 2023-08-27 Pending — CIBR
- 2023-08-22 Delisted — CIBR
- 2023-08-05 Pending — MRED as Distributed by MLS Grid
- 2023-08-05 Pending — CIBR
- 2023-07-16 Contingent — MRED as Distributed by MLS Grid
- 2023-07-16 Contingent — CIBR
- 2023-07-12 Listed $59,000 CIBR
- 2023-07-12 Listed $59,000 MRED as Distributed by MLS Grid
- 2007-01-19 Sold (Public Records) $38,000 Public Records
Property tax history
+17.8%/yrLatest (2024): $974 · +13.6% YoY. Source: county tax records.
Cash-flow waterfall
monthlySold comps — $/sqft
last 12 mo · ≤1 miLoading sold comps…