1513 Spreckels St Unit B-4 · Urban Honolulu, HI
Flood risk 1/10 · Minimal
- FEMA flood zone
- X (unshaded)
- Chance of flooding over 30 yrs
- 0.0%
- Est. flood insurance / yr
- $507 – $1,088
Fire risk No data
- Est. fire insurance / yr
- —
Heat risk No data
- Hot days now (above threshold)
- —
- Hot days in 30 yrs
- —
Wind risk No data
- Chance of severe wind over 30 yrs
- —
Air-quality risk 1/10 · Minimal
- Unhealthy air days now
- —
- Unhealthy air days in 30 yrs
- —
Risk factors via First Street. Map © Google.
Why this score? — see what drove the C grade
The composite is a weighted blend of 9 inputs, each scored 0–100. Each bar is that input's sub-score; the figure is the points it added to the 100-point composite (weight × sub-score).
- Cash flow +14.5/30.0
- ARV discount +14.4/15.0
- Appreciation +6.4/10.0
- 1% rule +4.9/10.0
- DSCR +4.4/10.0
- Rent growth +3.8/5.0
- Schools +3.7/10.0
- Livability +2.5/5.0
- Condition / age +2.5/5.0
$280,000
🖨 Deal sheet 📄 Offer letter ✓ Due diligence
Listing remarks MLS
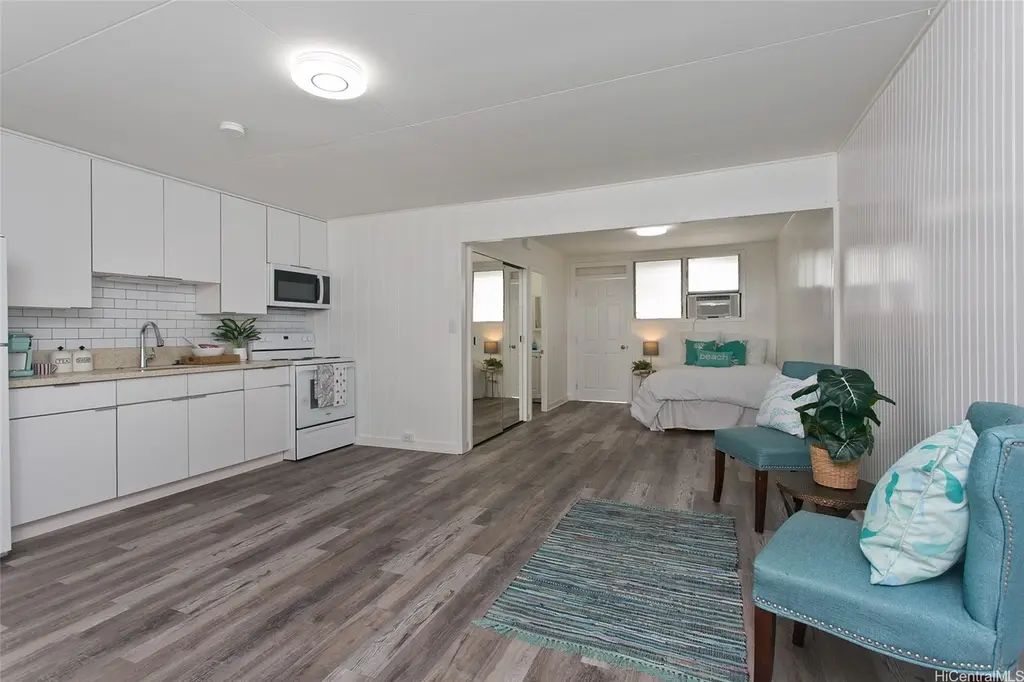
Great Location!! Punahou surf is located in one of the most highly desired Punahou area, close to Punahou and Maryknoll schools, UH Manoa, Kapiolani Hospital with quick access to the freeway . This boutique condo has many nice upgrades laminate flooring new kitchen appliances from 2023, has not been used , refrigerator, microwave hood, stove and oven . upgraded kitchen cabinets and bathroom cabinets . washer hook up in back lanai. Move -in ready for your personal touches . Easy to show
Key facts
- Laminate flooring
- Boutique condo
- $464 HOA
Tags
Neighborhood map
What this means for you Summary
Snapshot
- This is a 1-bed/1.0-bath condo listed at $280k.
Deal economics
- At list price, monthly cash flow is $63 ($758/yr) — positive.
- The deal already cash-flows at list — no discount required.
- To meet the 1% rule (rent ≥ 1% of price), the offer needs to be $276k (1.4% below list).
- Recommended offer: $255k (9.0% below list) — sets the bar for market timing.
- Cap rate 6.6% vs local median 1.5% in Urban Honolulu — top-decile yield for the area; either an underpriced asset or a hidden risk that comps aren't pricing in. Stress-test before assuming the spread holds.
Location & tenants
- Location reads: area grade C — affects rentability + tenant quality, not the cash-flow math above.
- Hawaii Department Of Education (suburban): math 32% / reading 50% proficiency, ranked #1 of 1 in HI (top 100%) — families likely to look elsewhere, expect single-tenant / working-renter base with shorter leases.
- Market conditions: Rents rising fast (+5.3%/yr); 177 active listings in the ZIP; 7 comparable units currently listed for rent nearby; rentals at typical pace (median 16d on market — plan ~3-4 weeks tenant-placement turnaround); solid renter incomes; 1,638 units permitted in Honolulu County in 2024 (793 in 5+ unit buildings).
- This rent runs 35% of the median local income ($96k/yr) — at the standard rent-burdened threshold; future hikes will face affordability resistance.
Forward outlook
- In year one you build about $10k of equity ($2k loan paydown + $8k appreciation (2.7% local appreciation)).
- Honolulu County population projected at +17% by 2050 — long-run rental-demand tailwind backs the buy-and-hold thesis.
- At projected returns (2.7% appreciation + 5.3% rent growth), your $78k cash investment doubles in ~6 years — after that, you're playing with house money.
- By year 4, paydown + projected appreciation supports a ~$32k cash-out refi (75% LTV) — recoverable capital for the next deal without selling this one.
Negotiation context
- It's been on market 114 days — a 9% lower offer ($255k) is reasonable based on typical stale-listing flexibility.
- Current owner paid $61k; list at $280k implies a 361% gain — meaningful room to come down on a strong offer.
Questions for the listing agent
- It's been on market 114 days. Have you received any prior offers? Is the seller open to a 9% concession, seller financing, or rate buy-down credit?
- Built in 1960 — when were the roof, HVAC, electrical panel, plumbing, and water heater last replaced?
- What does the HOA fee cover, when was the last increase, and are there any pending special assessments or reserve-fund shortfalls?
- Any open or pending special assessments — roof, HVAC, plumbing, elevator, façade? What's the per-unit balance and payoff schedule, and is the seller paying it off at close or rolling it to the buyer?
- Why hasn't it sold? Are there any deal-killer items the seller is aware of (foundation, flood, title, zoning, code violations)?
- Is there a deadline driving the sale (1031 exchange, divorce, estate, relocation)? That informs how much negotiation room exists.
- What's the average days-on-market for RENTAL listings here right now (not sales)? A rising rental-DOM trend means longer vacancies and softer asking-rent achievability than the comps imply.
- What's the recent tenant-quality profile in this submarket — average credit score on applications, eviction rate, late-payment / NSF rate, and stable-employment percentage? A property-management company in the area should have these aggregated.
- How much new apartment / multifamily construction is in the pipeline within 1–3 miles? Heavy new supply (>2% of stock underway) typically softens rents 12–24 months out; light construction supports rent growth.
Investment metrics
- 1% rule
- 0.99% ✗
- Cap rate
- 6.56%
- Cash-on-cash
- 0.97%
- DSCR
- 1.04
- GRM
- 8.4
CMA / ARV
- ARV (median comp)
- $330,826
- List price
- $280,000
- Delta
- -15.36%
- Verdict
- UNDERPRICED
- Comps
- 20 within 1.0 mi
Projected returns pro-forma
2.71% appreciation · 5.35% rent growth · sell at horizon
- IRR
- 9.0%
- Equity multiple
- 1.51×
- Total profit
- $40,304
- Equity at exit
- $121,341
- IRR
- 13.0%
- Equity multiple
- 2.97×
- Total profit
- $154,296
- Equity at exit
- $183,530
Cash invested: $78,400 (down + closing). Projections, not guarantees.
Landlord ↔ Tenant lean methodology
- Overall (STATE)
- 37 Tenant-Leaning
- State Hawaii
- 37 Tenant-Leaning · D+13
- County
- — inherits STATE
- City
- — inherits STATE
ZIP-level market 96822
- Home prices YoY
- 1.0%
- Rents YoY
- 5.3%
- Active inventory
- 177
- Price-to-rent
- 8.4×
Monthly cashflow live
- Estimated rent
- $2,762 high interval (Pro) →
- Mortgage (P&I)
- −$1,468
- Tax from tax record
- −$70 /mo · $839/yr
- Insurance
- −$117
- HOA
- −$464
- Vacancy / Maint / Mgmt
- −$580
- Net cashflow
- $63
Break-even live
UW: 25.0% down · 7.5% · 30yr · 1.5% tax · 5.0% vac · 8.0% maint · 8.0% mgmt
Financing live
Cash to close
- Down payment
- $70,000
- Closing costs
- $8,400
- Reserves months
- —
- Total cash needed
- —
Loan-product check · same deal, 3 products live
Conventional
25% down · 7.5% · 30yr
- Down + closing
- —
- Monthly P&I
- —
- Monthly cashflow
- —
- DSCR
- —
- Eligible?
- —
Personal DTI + credit; lowest rate.
DSCR
20% down · 8.5% · 30yr
- Down + closing
- —
- Monthly P&I
- —
- Monthly cashflow
- —
- DSCR
- —
- Eligible?
- —
No personal income docs; deal must DSCR.
Hard money
10% down · 12.0% · 12mo
- Down + closing
- —
- Monthly P&I
- —
- Monthly cashflow
- —
- DSCR
- —
- Eligible?
- —
Short-term bridge; refi at stabilization.
Rent comps 7 comps
| Address | Beds | Baths | Sqft | Rent | $/sqft | DOM | Units | Dist |
|---|---|---|---|---|---|---|---|---|
| 1568 Pensacola St Honolulu, HI | 1.0–2.0 | 1.0 | 523 | $2,280 | $4.36 | 23d | 1 | 0.72mi |
| 902 University Ave Unit C Honolulu, HI | 2.0 | 1.0 | 415 | $2,318 | $5.58 | 23d | 1 | 0.94mi |
| 440 Olohana St Unit 1327711P Honolulu, HI | 1.0 | 1.0 | 355 | $3,741 | $10.54 | 2d | 1 | 1.21mi |
| 440 Olohana St Unit 1327703P Honolulu, HI | 1.0 | 1.0 | 355 | $4,055 | $11.42 | 11d | 1 | 1.21mi |
| 987 Queen St Honolulu, HI | 2.0 | 1.0–2.0 | 554 | $4,000 | $7.22 | 16d | 8 | 1.43mi |
| 987 Queen St Honolulu, HI | 2.0 | 1.0–2.0 | 554 | $3,925 | $7.08 | 17d | 9 | 1.43mi |
| 987 Queen St Honolulu, HI | 1.0 | 1.0 | 453 | $3,800 | $8.39 | 10d | 9 | 1.43mi |
HOA detail condo
- Monthly dues
- $464 · $5,568/yr
- Assessments
- None detected in remarks — confirm with the listing agent.
Listing history 17 events
-
2026-06-18days on market $280,000 Active 114 DOM
-
2026-06-17days on market $280,000 Active 113 DOM
-
2026-06-16days on market $280,000 Active 112 DOM
-
2026-06-15days on market $280,000 Active 111 DOM
-
2026-06-13days on market $280,000 Active 109 DOM
-
2026-06-13days on market $280,000 Active 108 DOM
-
2026-06-10days on market $280,000 Active 106 DOM
-
2026-06-09days on market $280,000 Active 105 DOM
-
2026-06-08days on market $280,000 Active 104 DOM
-
2026-06-07days on market $280,000 Active 103 DOM
-
2026-06-05days on market $280,000 Active 100 DOM
-
2026-06-03days on market $280,000 Active 99 DOM
-
2026-06-02days on market $280,000 Active 98 DOM
-
2026-06-01days on market $280,000 Active 97 DOM
-
2026-05-31days on market $280,000 Active 96 DOM
-
2026-02-24$280,000 Active 495-char remark
Show marketing remark (495 chars)
Great Location!! Punahou surf is located in one of the most highly desired Punahou area, close to Punahou and Maryknoll schools, UH Manoa, Kapiolani Hospital with quick access to the freeway . This boutique condo has many nice upgrades laminate flooring new kitchen appliances from 2023, has not been used , refrigerator, microwave hood, stove and oven . upgraded kitchen cabinets and bathroom cabinets . washer hook up in back lanai. Move -in ready for your personal touches . Easy to show
-
1982-04-01soldstatus $60,800
ⓘ Source: listings_history table (triggers on properties + properties_extension) + one-shot
backfill from property_details.listing_events for pre-trigger history.
Tax reassessment forecast HI · Partial reset (capped growth)
- Current annual tax
- $839 · $70/mo
- Projected year-2 tax
- $839 · $70/mo
- Expected delta
- $0/yr ($0/mo · 0.0%)
ⓘ Screening estimate from a state-policy table — verify with the county assessor before closing.
Climate risk First Street
- Flood 1/10 Low FEMA zone X (unshaded) · 0% chance over 30 yrs
- Air quality 1/10 Low
Nearby sold comps map
Loading sold comps map…
Walkable amenities ~0.75 mi
Loading nearby amenities…
Taxation est. · year 1
- Rental income
- $33,145
- − Mortgage interest
- −$15,684
- − Property taxes
- −$839
- − Insurance
- −$1,400
- − Repairs & maintenance
- −$2,652
- − Management
- −$2,652
- − HOA
- −$5,568
- − Depreciation
- −$8,145
- Taxable loss
- −$3,795
- Est. tax savings @ 24.0%
- +$911
- After-tax cash flow
- $1,668/yr
For passive investors: Depreciation is non-cash, so a rental often shows a tax loss while cash-flowing — sheltering income. Rental losses are passive: they offset passive income freely, and up to $25,000/yr can offset ordinary (W-2) income if you actively participate and your MAGI is under $100k (phasing out to $0 by $150k); unused losses carry forward. On sale, claimed depreciation is recaptured at up to 25%, and gains may owe capital-gains tax (a 1031 exchange can defer both). Figures are a year-1 estimate at your 24.0% rate — not tax advice; consult a CPA.
Schools (NCES district)
- District
- Hawaii Department Of Education
- NCES district ID
- 1500030
- Math proficiency
- 32% ▼ -10.00%
- Reading proficiency
- 50% ▼ -3.00%
- Median HH income
- $69,005
- Composite
- 37.07/100
- National rank
- #4504
- State rank
- #1 of 1 in HI
Livability — Urban Honolulu
No livability data for this city. (Only ~50 U.S. cities are tracked.)
Census & demographics
- Census place
- Urban Honolulu, HI
- County
- Honolulu County · 963,448 people
- City population
- 309,956
- Metro
- Urban Honolulu, HI
- Population (ZIP)
- 43,747
- Household income
- $95,947
- Rent vs Own
- Severe rent burden
- 2139.0
Population outlook (Honolulu County) Hauer SSP2
- Today (2025)
- 1,072,641 people
- By 2030
- 1,110,460 · +3.5%
- By 2040
- 1,181,593 · +10.2%
- By 2050
- 1,257,584 · +17.2%
- By 2075
- 1,501,120 · +39.9%
- By 2100
- 1,764,430 · +64.5%
Race, ethnicity, and origin ACS 2023
- Neighborhood character
- Highly diverse neighborhood (Simpson 0.72)
- Race & ethnicity
- Asian 48% White 21% Two or more races 20% Pacific Islander 7% Hispanic / Latino 5% Black 1%
- Hispanic origin (detail)
- Mexican 2% Puerto Rican 1%
- Common ancestry
- Russian 2% Lithuanian 1% Romanian 1%
- Foreign-born
- 20% · South Korea, China, Vietnam
- Languages at home
- 73% English-only · Other Asian/Pacific 11% Chinese 4% Korean 3%
Political lean MEDSL · Honolulu
- 2024 margin
- Strong D (+21.6) · D 59.9% · R 38.3% · Other 1.8%
- 2008→2024 swing
- -19.4pp toward R · 2008: 41.1pp · 2024: 21.6pp
- All cycles
- 2024: D+21.6 2020: D+26.9 2016: D+29.9 2012: D+39.1 2008: D+41.1
Not yet ingested
- Civics
- —
Market trends
- HPI YoY
- ▲ 2.71%
- Current HPI
- 273.9456
- Rent YoY
- ▲ 5.35%
- Metro
- Urban Honolulu, HI
- State GDP YoY
- —
- F500 in state
- 0
Price history
+360.5% since first listed2 events — show timeline
- 2026-02-24 Listed $280,000 HiCentral MLS
- 1982-04-01 Sold (Public Records) $60,800 Public Records
Property tax history
+2.7%/yrLatest (2022): $839 · -6.5% YoY. Source: county tax records.
Cash-flow waterfall
monthlySold comps — $/sqft
last 12 mo · ≤1 miLoading sold comps…