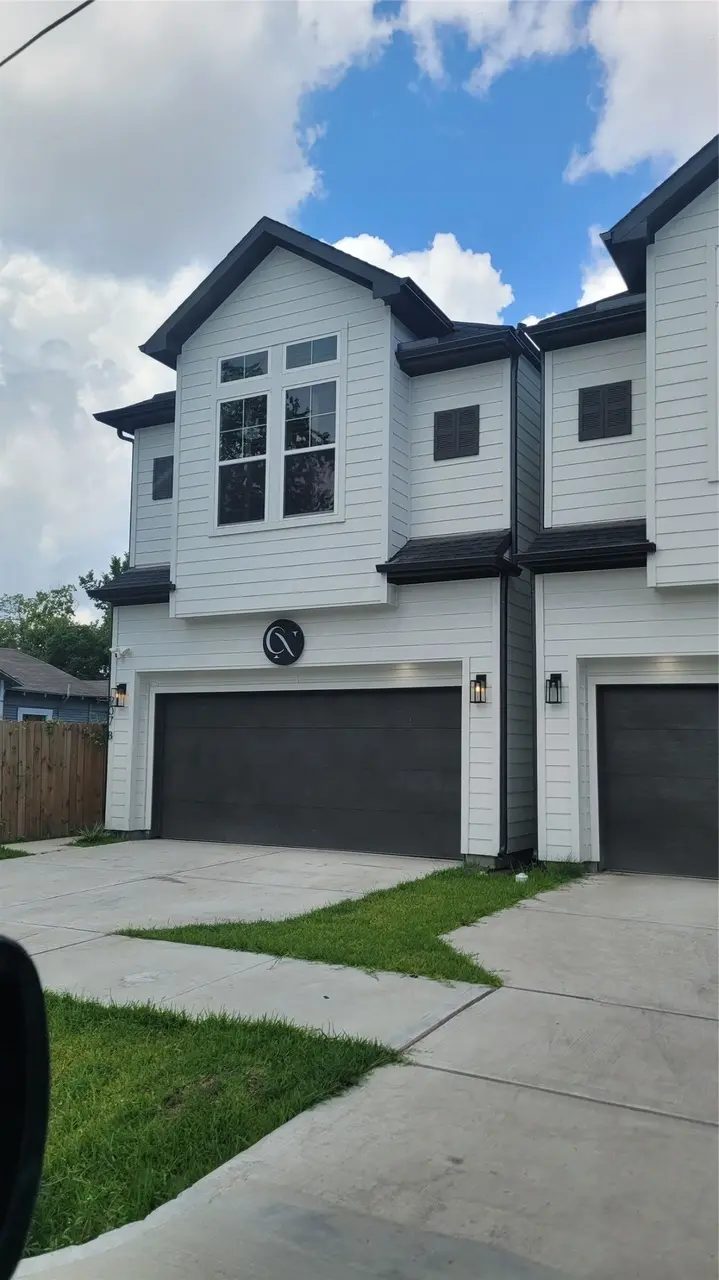
4217 Hare St Unit A · Houston, TX
Flood risk 1/10 · Minimal
- FEMA flood zone
- X (unshaded)
- Chance of flooding over 30 yrs
- 0.0%
- Est. flood insurance / yr
- $507 – $1,088
Fire risk 1/10 · Minimal
- Est. fire insurance / yr
- $1,222 – $2,270
Heat risk 9/10 · Severe
- Hot days now (above 109°F)
- 7 days/yr
- Hot days in 30 yrs
- 22 days/yr
Wind risk 9/10 · Severe
- Chance of severe wind over 30 yrs
- 99.0%
Air-quality risk 3/10 · Minor
- Unhealthy air days now
- 2 days/yr
- Unhealthy air days in 30 yrs
- 3 days/yr
Risk factors via First Street. Map © Google.
Why this score? — see what drove the D grade
The composite is a weighted blend of 9 inputs, each scored 0–100. Each bar is that input's sub-score; the figure is the points it added to the 100-point composite (weight × sub-score).
- ARV discount +12.4/15.0
- Appreciation +10.0/10.0
- Cash flow +6.1/30.0
- Livability +3.7/5.0
- Rent growth +3.6/5.0
- Schools +2.7/10.0
- Condition / age +2.5/5.0
- 1% rule +2.1/10.0
- DSCR +0.4/10.0
$367,999
🖨 Deal sheet 📄 Offer letter ✓ Due diligence
Listing remarks
A new modern city living in this newly built 3-bedroom, 2.5-bath home located in a vibrant, fast-growing neighborhood. The open-concept living and dining area flows into a sleek kitchen with stainless steel appliances and contemporary finishes, This home is perfect for everyday living or entertaining. Upstairs features three spacious bedrooms, including a serene primary suite with a private bath. Enjoy a low-maintenance outdoor space and the convenience of being just minutes from downtown dining, shopping, and entertainment offering the ideal blend of urban energy and residential comfort.
Key facts
- Open-concept living
- Garage
- Built 2023
Tags
Property features AI
Finance
- Other: Seller disclosures and Municipal Utility District disclosure available
- Financial info: Lease considered
Exterior
- Parking: Attached garage
- Utilities: Public water; Public sewer
- Home design: Residential property; 2 stories; Entry level: First floor; Built in 2023
- Construction: Stone and stucco construction; Composition roof; Slab foundation
- Exterior features: Concrete road/driveway
Interior
- Kitchen: Convection oven; Dishwasher; Disposal; Microwave; Refrigerator; Trash compactor
- Bedrooms: Primary bedroom on second level (approx. 18 x 13.4); Bedroom on second level (approx. 11 x 13.4); Bedroom on second level (approx. 12 x 13.4)
- Bathrooms: 2 full bathrooms; 1 half bathroom (first level)
- Heating & cooling: Central heating (electric and gas); Central air conditioning (electric and gas)
- Interior features: Primary bedroom with private bath; 6 total rooms
- Laundry & utility: Washer; Dryer
Neighborhood map
What this means for you Summary
Snapshot
- This is a 3-bed/2.5-bath single-family listed at $368k.
Deal economics
- At list price, monthly cash flow is $-690 ($-8k/yr) — negative.
- To cash-flow at today's rent, offer at most $246k (33.1% below list).
- To meet the 1% rule (rent ≥ 1% of price), the offer needs to be $262k (28.9% below list).
- Recommended offer: $246k (33.1% below list) — sets the bar for cash-flow.
- Cap rate 4.0% vs local median 3.2% in Houston — meaningfully above typical; check what's discounted (condition, days-on-market, listing class) to confirm the premium yield is real.
Location & tenants
- Location reads 74/100 on livability (#184 in TX, #4,771 nationally) — a middle-class / working-renter tenant base. Strengths: amenities A+, cost of living A+, housing A+; Watch: crime F.
- Houston ISD (urban): math 27% / reading 35% proficiency, ranked #593 of 826 in TX (top 72%) — families likely to look elsewhere, expect single-tenant / working-renter base with shorter leases; 71% free/reduced lunch — lower-income household profile, screen leases tightly.
- Zoned schools: Henderson N El (math 12% / reading 8%, grade F, #4,259 of 4,322 statewide, top 99%, 227 students, 100% FRL); Mcreynolds Middle (math 10% / reading 17%, grade F, #1,602 of 1,662 statewide, top 97%, 398 students, 98% FRL); Wheatley H S (math 17% / reading 19%, grade F, #1,445 of 1,632 statewide, top 89%, 643 students, 95% FRL) — zoned schools average 98% FRL vs 71% district-wide (26 pts higher); higher-poverty schools than district average — tighter screening recommended.
- Zoned-school proficiency averages 14% at this address vs 31% district-wide (-17 pts) — the specific schools serving this property underperform the Houston ISD average; the district grade overstates school quality for this exact location.
- Market conditions: Rents rising fast (+4.3%/yr); 337 active listings in the ZIP; 23 comparable units currently listed for rent nearby; rentals at typical pace (median 21d on market — plan ~3-4 weeks tenant-placement turnaround); 43% of comp listings sitting > 30 days — soft ceiling on asking rent; 29,883 units permitted in Harris County in 2024 (8,621 in 5+ unit buildings).
- At $2,616/mo this rent would consume 63% of the median local household income ($50k/yr) (locally 969% of renters already pay >50% of income on rent) — very limited rent-growth headroom before tenants either downsize or default.
Forward outlook
- In year one you build about $39k of equity ($3k loan paydown + $37k appreciation (10.0% local appreciation)).
- Harris County population projected at +47% by 2050 — long-run rental-demand tailwind backs the buy-and-hold thesis.
- By year 2, paydown + projected appreciation supports a ~$63k cash-out refi (75% LTV) — recoverable capital for the next deal without selling this one.
Negotiation context
- It's been on market 72 days — a 6% lower offer ($346k) is reasonable based on typical stale-listing flexibility.
- 10 sale attempts since 6y ago; this cycle's ask is 12167% above the opening price — seller raised mid-cycle; expect resistance to lowballs.
Risks & watch-outs
- Climate carrying-cost: severe wind risk, 99% chance of damaging wind over 30y; extreme-heat days projected 7→22/yr by 2055 (HVAC capex compounding) — expect insurance premiums to compound above CPI over the hold.
Questions for the listing agent
- What do current leases actually rent for vs. the listed asking? Can we see a recent rent roll and the last 12 months of T-12 income?
- It's been on market 72 days. Have you received any prior offers? Is the seller open to a 33% concession, seller financing, or rate buy-down credit?
- Why hasn't it sold? Are there any deal-killer items the seller is aware of (foundation, flood, title, zoning, code violations)?
- Is there a deadline driving the sale (1031 exchange, divorce, estate, relocation)? That informs how much negotiation room exists.
- Schools are D-rated, which usually means shorter tenancies and higher turnover. Who's the typical renter profile here, and what's been the actual vacancy rate?
- Crime grade is F in this area — have there been break-ins, vandalism, or insurance claims at this property in the last 3 years? What carrier currently insures it and at what premium?
- The area grade is low — what's the realistic commute time and amenity access for the typical tenant pool here? Any planned neighborhood developments (good or bad) we should know about?
- What's the average days-on-market for RENTAL listings here right now (not sales)? A rising rental-DOM trend means longer vacancies and softer asking-rent achievability than the comps imply.
- What's the recent tenant-quality profile in this submarket — average credit score on applications, eviction rate, late-payment / NSF rate, and stable-employment percentage? A property-management company in the area should have these aggregated.
- How much new for-sale + rental construction is in the pipeline within 1–3 miles? Heavy new supply typically softens prices + rents 12–24 months out; constrained supply supports both.
Investment metrics
- 1% rule
- 0.71% ✗
- Cap rate
- 4.04%
- Cash-on-cash
- -8.03%
- DSCR
- 0.64
- GRM
- 11.7
CMA / ARV
- ARV (on-the-fly)
- $413,343
- Comps found
- 12
Show comp detail 12 sales within ~0.75 mi
| Address | Dist | Beds/Ba | Sqft | Sold | Price | $/sf | Match |
|---|---|---|---|---|---|---|---|
| 4439 Gunter St | 0.17mi | 3/2.5 | 2,027 (-7%) | 2mo | $325,000 | $160 | 78 |
| 4441 Gunter St | 0.18mi | 3/2.5 | 2,027 (-7%) | 2mo | $329,000 | $162 | 78 |
| 4430 Edmund St | 0.23mi | 3/3.5 | 2,023 (-8%) | 2mo | $394,990 | $195 | 71 |
| 3306 Cline St | 0.53mi | 3/3.5 | 2,154 (-2%) | 1mo | $390,000 | $181 | 68 |
| 515 Schweikhardt St | 0.32mi | 3/3.5 | 2,401 (+10%) | 2mo | $400,000 | $167 | 63 |
| 3415 Stonewall St | 0.50mi | 3/2.5 | 1,969 (-10%) | 1mo | $369,000 | $187 | 59 |
| 3409 Stonewall St | 0.51mi | 3/2.5 | 1,969 (-10%) | 1mo | $349,900 | $178 | 59 |
| 3209 Baer St Unit B | 0.55mi | 3/3.5 | 1,996 (-9%) | 1mo | $464,900 | $233 | 55 |
| 3209 Baer St Unit A | 0.55mi | 3/3.5 | 1,990 (-9%) | 1mo | $464,900 | $234 | 55 |
| 1266 Finnigan Dr | 0.56mi | 3/3.5 | 1,988 (-9%) | 2mo | $375,000 | $189 | 53 |
| 411 Grove St Unit C | 0.56mi | 3/2.5 | 1,903 (-13%) | 2mo | $375,000 | $197 | 51 |
| 3605 New Orleans St | 0.63mi | 3/2.5 | 1,884 (-14%) | 1mo | $374,900 | $199 | 46 |
Match score weights: distance 35% · size 25% · config 20% · recency 20%. Top-matched comps best support the ARV.
Projected returns pro-forma
10.0% appreciation · 4.27% rent growth · sell at horizon
- IRR
- 19.0%
- Equity multiple
- 2.55×
- Total profit
- $160,057
- Equity at exit
- $331,523
- IRR
- 17.8%
- Equity multiple
- 5.98×
- Total profit
- $513,453
- Equity at exit
- $714,941
Cash invested: $103,040 (down + closing). Projections, not guarantees.
Landlord ↔ Tenant lean methodology
- Overall (STATE)
- 87 Strongly Landlord-Friendly
- State Texas
- 87 Strongly Landlord-Friendly · R+5
- County
- — inherits STATE
- City
- — inherits STATE
ZIP-level market 77020
- Home prices YoY
- 29.1%
- Rents YoY
- 4.3%
- Active inventory
- 337
- Price-to-rent
- 11.7×
Monthly cashflow live
- Estimated rent
- $2,616 high interval (Pro) →
- Mortgage (P&I)
- −$1,930
- Tax from tax record
- −$673 /mo · $8,076/yr
- Insurance
- −$153
- HOA
- −$0
- Vacancy / Maint / Mgmt
- −$549
- Net cashflow
- $-690
Break-even live
UW: 25.0% down · 7.5% · 30yr · 1.5% tax · 5.0% vac · 8.0% maint · 8.0% mgmt
Financing live
Cash to close
- Down payment
- $92,000
- Closing costs
- $11,040
- Reserves months
- —
- Total cash needed
- —
Loan-product check · same deal, 3 products live
Conventional
25% down · 7.5% · 30yr
- Down + closing
- —
- Monthly P&I
- —
- Monthly cashflow
- —
- DSCR
- —
- Eligible?
- —
Personal DTI + credit; lowest rate.
DSCR
20% down · 8.5% · 30yr
- Down + closing
- —
- Monthly P&I
- —
- Monthly cashflow
- —
- DSCR
- —
- Eligible?
- —
No personal income docs; deal must DSCR.
Hard money
10% down · 12.0% · 12mo
- Down + closing
- —
- Monthly P&I
- —
- Monthly cashflow
- —
- DSCR
- —
- Eligible?
- —
Short-term bridge; refi at stabilization.
Rent comps 23 comps
| Address | Beds | Baths | Sqft | Rent | $/sqft | DOM | Units | Dist |
|---|---|---|---|---|---|---|---|---|
| 4109 Hare St Unit A Houston, TX | 4.0 | 2.5 | 1913 | $6,950 | $3.63 | 43d | 1 | 0.11mi |
| 4109 Hare St Unit 1019559P Houston, TX | 4.0 | 2.5 | 1905 | $6,852 | $3.60 | 7d | 1 | 0.11mi |
| 1222 Upton St Houston, TX | 3.0 | 4.0 | 2055 | $2,600 | $1.27 | 43d | 1 | 0.30mi |
| 3419 Gillespie St Houston, TX | 3.0 | 3.5 | 2168 | $2,300 | $1.06 | 43d | 1 | 0.43mi |
| 3410 Baer St Houston, TX | 3.0 | 4.0 | 2040 | $3,500 | $1.72 | 43d | 1 | 0.44mi |
| 308 Grove St Houston, TX | 3.0 | 3.0 | 1701 | $2,350 | $1.38 | 7d | 1 | 0.55mi |
| 1513 Cage St Houston, TX | 3.0 | 2.0 | 1467 | $1,550 | $1.06 | 43d | 1 | 0.60mi |
| 1303 Bayou St Unit C Houston, TX | 3.0 | 3.0 | 1869 | $3,200 | $1.71 | 43d | 1 | 0.64mi |
| 611 Sydnor St Houston, TX | 3.0 | 4.0 | 2157 | $2,400 | $1.11 | 43d | 1 | 0.65mi |
| 1307 Bayou St Unit B Houston, TX | 3.0 | 3.0 | 1814 | $2,400 | $1.32 | 7d | 1 | 0.65mi |
| 4706 Hershe St Houston, TX | 3.0 | 2.5 | 2283 | $3,300 | $1.45 | 43d | 1 | 0.67mi |
| 2905 Baer St Unit 1047953P Houston, TX | 3.0 | 2.5 | 1991 | $3,094 | $1.55 | 5d | 1 | 0.74mi |
| 4712 Rawley St Unit a Houston, TX | 3.0 | 2.0 | 1501 | $2,070 | $1.38 | 20d | 1 | 0.76mi |
| 4712 Rawley St Unit B Houston, TX | 3.0 | 2.5 | 1501 | $2,045 | $1.36 | 20d | 1 | 0.76mi |
| 5217 Noble St Houston, TX | 3.0 | 2.5 | 1897 | $2,750 | $1.45 | 43d | 1 | 1.01mi |
| 2105 Sam Wilson St Houston, TX | 3.0 | 2.5 | 1416 | $6,750 | $4.77 | 43d | 1 | 1.12mi |
| 5605 Mulvey St Unit 1019610P Houston, TX | 3.0 | 2.5 | 1410 | $4,237 | $3.00 | 3d | 1 | 1.13mi |
| 1023 Hahlo St Houston, TX | 4.0 | 2.0 | 1434 | $1,775 | $1.24 | 5d | 1 | 1.13mi |
| 4509 Courtney St Houston, TX | 4.0 | 1.0 | 1456 | $1,150 | $0.79 | 22d | 1 | 1.27mi |
| 2115 Runnels St Unit 3174 Houston, TX | 3.0 | 2.0 | 1839 | $3,056 | $1.66 | 12d | 1 | 1.27mi |
| 2115 Runnels St Unit 2148 Houston, TX | 3.0 | 2.0 | 1839 | $3,045 | $1.66 | 11d | 1 | 1.27mi |
| 2115 Runnels St Unit 3187 Houston, TX | 3.0 | 2.0 | 1839 | $3,013 | $1.64 | 2d | 1 | 1.27mi |
| 2414 East Dr Unit Canal St unit Houston, TX | 3.0 | 3.5 | 2063 | $2,950 | $1.43 | 7d | 1 | 1.35mi |
Listing history 47 events
-
2026-06-18days on market $367,999 Active 72 DOM
-
2026-06-17price $367,999 Active 71 DOM
-
2026-06-17days on market $377,999 Active 71 DOM
-
2026-06-16days on market $377,999 Active 70 DOM
-
2026-06-15days on market $377,999 Active 69 DOM
-
2026-06-13days on market $377,999 Active 67 DOM
-
2026-06-10days on market $377,999 Active 63 DOM
-
2026-06-08days on market $377,999 Active 62 DOM
-
2026-06-07pricedays on market $377,999 Active 61 DOM
-
2026-06-04days on market $378,999 Active 58 DOM
-
2026-06-01days on market $378,999 Active 55 DOM
-
2026-05-31days on market $378,999 Active 54 DOM
-
2026-05-22price $2,700
-
2026-05-18price $2,750
-
2026-05-17status Active
-
2026-05-17price $378,999
-
2026-05-05price $2,800
-
2026-05-04price $382,599
-
2026-04-26price $2,850
-
2026-04-24historical
-
2026-04-21price $2,900
-
2026-04-20price $382,999
-
2026-03-17$3,000
-
2026-03-15$384,999 Active
-
2025-04-25soldstatus
-
2025-04-01historical $2,800
-
2025-02-15$2,800
-
2023-12-18historical
-
2023-12-16historical $3,200
-
2023-12-15historical
-
2023-11-19$3,200
-
2023-10-26price $475,000
-
2023-10-26price $475,000
-
2023-10-05$485,000 Active
-
2023-10-01status Active
-
2023-09-30price $485,000
-
2023-09-30historical
-
2023-08-08historical
-
2023-08-08historical
-
2023-07-11$489,990 Active
-
2023-06-30$489,990 Active
-
2023-06-08historical
-
2020-09-18soldstatus Sold
-
2020-09-04soldstatus
-
2020-08-08status Pending
-
2020-04-18$79,900 Active
-
1988-01-02soldstatus
ⓘ Source: listings_history table (triggers on properties + properties_extension) + one-shot
backfill from property_details.listing_events for pre-trigger history.
Tax reassessment forecast TX · Resets to sale price
- Current annual tax
- $8,076 · $673/mo
- Projected year-2 tax
- $8,076 · $673/mo
- Expected delta
- $0/yr ($0/mo · 0.0%)
ⓘ Screening estimate from a state-policy table — verify with the county assessor before closing.
Climate risk First Street
- Flood 1/10 Low FEMA zone X (unshaded) · 0% chance over 30 yrs
- Wildfire 1/10 Low
- Heat 9/10 Extreme 7 d/yr ≥109°F today · 22 d/yr by 30 yrs out
- Wind 9/10 Extreme 99% chance of damaging wind over 30 yrs
- Air quality 3/10 Moderate 2 unhealthy d/yr today · 3 by 30 yrs out
Nearby sold comps map
Loading sold comps map…
Walkable amenities ~0.75 mi
Loading nearby amenities…
Taxation est. · year 1
- Rental income
- $31,391
- − Mortgage interest
- −$20,614
- − Property taxes
- −$8,076
- − Insurance
- −$1,840
- − Repairs & maintenance
- −$2,511
- − Management
- −$2,511
- − Depreciation
- −$10,705
- Taxable loss
- −$14,867
- Est. tax savings @ 24.0%
- +$3,568
- After-tax cash flow
- $-4,707/yr
For passive investors: Depreciation is non-cash, so a rental often shows a tax loss while cash-flowing — sheltering income. Rental losses are passive: they offset passive income freely, and up to $25,000/yr can offset ordinary (W-2) income if you actively participate and your MAGI is under $100k (phasing out to $0 by $150k); unused losses carry forward. On sale, claimed depreciation is recaptured at up to 25%, and gains may owe capital-gains tax (a 1031 exchange can defer both). Figures are a year-1 estimate at your 24.0% rate — not tax advice; consult a CPA.
Schools (NCES district)
- District
- Houston ISD
- NCES district ID
- 4823640
- Math proficiency
- 27% ▼ -18.00%
- Reading proficiency
- 35% ▼ -6.00%
- Median HH income
- $46,054
- Composite
- 26.63/100
- National rank
- #7173
- State rank
- #593 of 826 in TX
Livability — Houston
- Score
- 74/100
- State rank
- #184
- US rank
- #4771
Category grades
Schools grade is shown separately in the Schools card above.
Census & demographics
- Census place
- Houston, TX
- County
- Harris County · 4,702,590 people
- City population
- 3,226,434
- Metro
- Houston-The Woodlands-Sugar Land, TX
- Population (ZIP)
- 23,686
- Household income
- $50,119
- Rent vs Own
- Severe rent burden
- 969.0
Population outlook (Harris County) Hauer SSP2
- Today (2025)
- 5,571,493 people
- By 2030
- 6,089,821 · +9.3%
- By 2040
- 7,142,806 · +28.2%
- By 2050
- 8,185,864 · +46.9%
- By 2075
- 10,574,329 · +89.8%
- By 2100
- 12,109,958 · +117.4%
Race, ethnicity, and origin ACS 2023
- Neighborhood character
- Predominantly Hispanic (69%)
- Race & ethnicity
- Hispanic / Latino 69% Black 24% Two or more races 22% White 5% Asian 1%
- Hispanic origin (detail)
- Mexican 60%
- Common ancestry
- Swiss 1%
- Foreign-born
- 23% · Canada
- Languages at home
- 39% English-only · Spanish 59% Other Indo-European 1%
Political lean MEDSL · Harris
- 2024 margin
- Lean D (+5.5) · D 52.0% · R 46.4% · Other 1.6%
- 2008→2024 swing
- +3.9pp toward D · 2008: 1.6pp · 2024: 5.5pp
- All cycles
- 2024: D+5.5 2020: D+13.3 2016: D+12.4 2012: D+0.1 2008: D+1.6
Not yet ingested
- Civics
- —
Market trends
- HPI YoY
- ▲ 55.64%
- Current HPI
- 246.5578
- Rent YoY
- ▲ 4.27%
- Metro
- Houston-The Woodlands-Sugar Land, TX
- State GDP YoY
- ▲ 3.95%
- F500 in state
- 110
Industry mix (Fortune 500 HQ in TX)
| Industry | F500 HQs | Revenue |
|---|---|---|
| Energy | 16 | $1,198B |
|
||
| Technology | 5 | $198B |
|
||
| Engineering / Construction | 4 | $72B |
|
||
| Energy Services | 3 | $60B |
|
||
| Utilities | 3 | $41B |
|
||
| Healthcare | 2 | $330B |
|
||
Price history
-96.6% since first listed35 events — show timeline
- 2026-05-22 Price Changed $2,700 HARMLS
- 2026-05-18 Price Changed $2,750 HARMLS
- 2026-05-17 Relisted — HARMLS
- 2026-05-17 Price Changed $378,999 HARMLS
- 2026-05-05 Price Changed $2,800 HARMLS
- 2026-05-04 Price Changed $382,599 HARMLS
- 2026-04-26 Price Changed $2,850 HARMLS
- 2026-04-24 Listing Removed — HARMLS
- 2026-04-21 Price Changed $2,900 HARMLS
- 2026-04-20 Price Changed $382,999 HARMLS
- 2026-03-17 Listed for Rent $3,000 HARMLS
- 2026-03-15 Listed $384,999 HARMLS
- 2025-04-25 Sold (Public Records) — Public Records
- 2025-04-01 Rental Removed $2,800 RENTSPREE
- 2025-02-15 Listed for Rent $2,800 RENTSPREE
- 2023-12-18 Listing Removed — HARMLS
- 2023-12-16 Rental Removed $3,200 HARMLS
- 2023-12-15 Listing Removed — HARMLS
- 2023-11-19 Listed for Rent $3,200 HARMLS
- 2023-10-26 Price Changed $475,000 HARMLS
- 2023-10-26 Price Changed $475,000 HARMLS
- 2023-10-05 Listed $485,000 HARMLS
- 2023-10-01 Relisted — HARMLS
- 2023-09-30 Price Changed $485,000 HARMLS
- 2023-09-30 Coming Soon — HARMLS
- 2023-08-08 Listing Removed — HARMLS
- 2023-08-08 Listing Removed — HARMLS
- 2023-07-11 Listed $489,990 HARMLS
- 2023-06-30 Listed $489,990 HARMLS
- 2023-06-08 Coming Soon — HARMLS
- 2020-09-18 Sold (MLS) — HARMLS
- 2020-09-04 Sold (Public Records) — Public Records
- 2020-08-08 Pending — HARMLS
- 2020-04-18 Listed $79,900 HARMLS
- 1988-01-02 Sold (Public Records) — Public Records
Property tax history
+24.5%/yrLatest (2025): $8,076 · +17.3% YoY. Source: county tax records.
Cash-flow waterfall
monthlySold comps — $/sqft
last 12 mo · ≤1 miLoading sold comps…