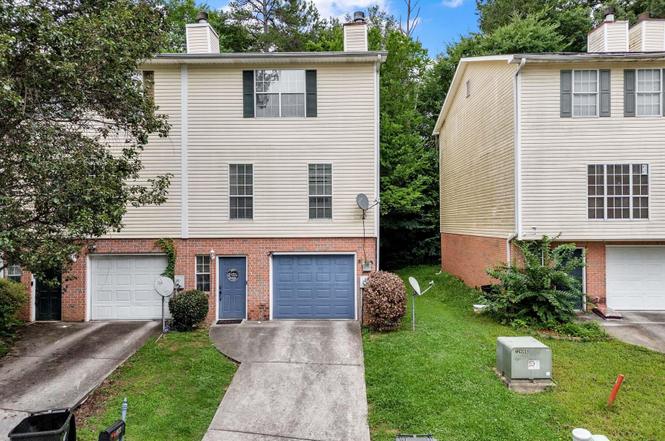
1937 Live Oak Trce · Grayson Valley, AL
Flood risk 1/10 · Minimal
- FEMA flood zone
- X (unshaded)
- Chance of flooding over 30 yrs
- 0.0%
- Est. flood insurance / yr
- $507 – $1,088
Fire risk 4/10 · Minor
- Est. fire insurance / yr
- $916 – $1,700
Heat risk 5/10 · Moderate
- Hot days now (above 105°F)
- 7 days/yr
- Hot days in 30 yrs
- 19 days/yr
Wind risk 6/10 · Moderate
- Chance of severe wind over 30 yrs
- 27.0%
Air-quality risk 5/10 · Moderate
- Unhealthy air days now
- 7 days/yr
- Unhealthy air days in 30 yrs
- 9 days/yr
Risk factors via First Street. Map © Google.
Why this score? — see what drove the C- grade
The composite is a weighted blend of 9 inputs, each scored 0–100. Each bar is that input's sub-score; the figure is the points it added to the 100-point composite (weight × sub-score).
- Cash flow +25.6/30.0
- DSCR +8.5/10.0
- 1% rule +5.5/10.0
- Rent growth +3.8/5.0
- Livability +3.2/5.0
- Condition / age +2.5/5.0
- Schools +1.8/10.0
- ARV discount +0.0/15.0
- Appreciation +0.0/10.0
$145,000
🖨 Deal sheet (PDF) 📄 Offer letter ✓ Due diligence
Listing remarks MLS
$5000 allowance for closing costs or upgrades with full price offer. Large 3 bedroom and 2.5 bath townhome close to everything. This home has new paint, new roof, large open kitchen with laundry room, living room with fireplace and 3 bedrooms on second story with 2 baths. House is one of the few with a garage with garage door opener. Why rent when you can own this beautiful townhouse and enjoy the benefits of home ownership? Make plans to see it today because it will not last long
Key facts
- End unit townhome
- Stainless appliances
- Huge living room
Tags
Property features AI
Finance
- HOA & community: Located in Country Walk subdivision
Exterior
- Parking: Front garage entry; One garage space (basement level); Driveway parking
- Utilities: Public water; Connected sewer; Underground utilities; Spectrum internet available; Double-paned windows for energy efficiency
- Home design: Existing single-family residence; Basement foundation; Daylight basement; Deck facing open yard
- Construction: Siding (other) exterior; Basement foundation
- Exterior features: Fenced yard; Open deck
Interior
- Kitchen: Laminate countertops; Built-in dishwasher; Garbage disposal; Eating area
- Bedrooms: Master bedroom located on upper level; Additional bedrooms located on upper level
- Flooring: Carpet; Hardwood laminate; Tile flooring
- Bathrooms: Two full bathrooms; One half bathroom; Master bath on upper level; Garden tub and tub/shower combo
- Heating & cooling: Dual heating systems with electric heat; Central cooling (dual systems)
- Interior features: Smooth ceilings; Split bedroom layout; Some window treatments to remain; Wood-burning masonry fireplace in the living room; Eating area off the kitchen; Full daylight basement (mostly unfinished) with a finished area
- Laundry & utility: Main-level laundry room; Washer hookup; Electric dryer hookup; Electric water heater
Neighborhood map
What this means for you Summary
Snapshot
- This is a 3-bed/2.5-bath townhouse listed at $145k.
Deal economics
- At list price, monthly cash flow is $342 ($4k/yr) — positive.
- The deal already cash-flows at list — no discount required.
- Meets the 1% rule at list price ($2k rent vs $145k).
- Cap rate 9.1% vs local median 5.5% in Grayson Valley — top-decile yield for the area; either an underpriced asset or a hidden risk that comps aren't pricing in. Stress-test before assuming the spread holds.
Location & tenants
- Location reads 65/100 on livability (#139 in AL) — a middle-class / working-renter tenant base. Strengths: cost of living A+, housing B+; Watch: amenities F, commute F, employment D-.
- Jefferson County (suburban): math 9% / reading 32% proficiency, ranked #104 of 129 in AL (top 81%) — low school quality limits family demand, transient renter base, plan for 1-2y turnover.
- Zoned schools: Clay Elementary School (math 10% / reading 40%, grade F, #414 of 627 statewide, top 66%, 632 students, 48% FRL); Claychalkville High School (math 6% / reading 9%, grade F, #261 of 305 statewide, top 87%, 1,361 students, 56% FRL) — zoned schools at 52% FRL track the district average.
- Market conditions: Rents rising fast (+5.4%/yr); 114 active listings in the ZIP; 38 comparable units currently listed for rent nearby; rentals at typical pace (median 25d on market — plan ~3-4 weeks tenant-placement turnaround); 42% of comp listings sitting > 30 days — soft ceiling on asking rent; 2,114 units permitted in Jefferson County in 2024 (556 in 5+ unit buildings).
Forward outlook
- Local home prices are declining (-3.0%/yr); year-one equity from $1k of loan paydown is wiped out by about $4k of value loss. Plan a longer hold.
- Jefferson County population projected to shrink 4% by 2050 — rents likely to lag national; underwrite the cash flow, not the appreciation.
- At projected returns (-3.0% appreciation + 5.4% rent growth), your $41k cash investment doubles in ~9 years — after that, you're playing with house money.
Negotiation context
- Only 1 days on market — expect competitive offers; lowballing is unlikely to land.
- Current owner paid $105k; 38% above their basis — modest negotiation headroom, anchor on the comps not their cost.
Risks & watch-outs
- Climate carrying-cost: major wind risk, 27% chance of damaging wind over 30y; extreme-heat days projected 7→19/yr by 2055 (HVAC capex compounding) — expect insurance premiums to compound above CPI over the hold.
Questions for the listing agent
- Is there a deadline driving the sale (1031 exchange, divorce, estate, relocation)? That informs how much negotiation room exists.
- Schools are D-rated, which usually means shorter tenancies and higher turnover. Who's the typical renter profile here, and what's been the actual vacancy rate?
- What's the average days-on-market for RENTAL listings here right now (not sales)? A rising rental-DOM trend means longer vacancies and softer asking-rent achievability than the comps imply.
- What's the recent tenant-quality profile in this submarket — average credit score on applications, eviction rate, late-payment / NSF rate, and stable-employment percentage? A property-management company in the area should have these aggregated.
- How much new for-sale + rental construction is in the pipeline within 1–3 miles? Heavy new supply typically softens prices + rents 12–24 months out; constrained supply supports both.
Investment metrics
- 1% rule
- 1.05% ✓
- Cap rate
- 9.13%
- Cash-on-cash
- 10.12%
- DSCR
- 1.45
- GRM
- 7.9
CMA / ARV
- ARV (on-the-fly)
- $101,840
- Comps found
- 3
Show comp detail 3 sales within ~0.75 mi
| Address | Dist | Beds/Ba | Sqft | Sold | Price | $/sf | Match |
|---|---|---|---|---|---|---|---|
| 1919 Live Oak Trce | 0.05mi | 3/2.5 | 1,676 (+10%) | 3mo | $145,000 | $87 | 78 |
| 1909 Live Oak Trce | 0.07mi | 2/2.5 (-1) | 1,424 (-6%) | 22mo | $95,000 | $67 | 63 |
| 1608 Park Ter | 0.58mi | 2/2.0 (-1) | 1,452 (-4%) | 4mo | $65,000 | $45 | 55 |
Match score weights: distance 35% · size 25% · config 20% · recency 20%. Top-matched comps best support the ARV.
Projected returns pro-forma
-3.0% appreciation · 5.39% rent growth · sell at horizon
- IRR
- 1.3%
- Equity multiple
- 1.05×
- Total profit
- $2,004
- Equity at exit
- $21,620
- IRR
- 12.9%
- Equity multiple
- 2.13×
- Total profit
- $45,771
- Equity at exit
- $12,537
Cash invested: $40,600 (down + closing). Projections, not guarantees.
Landlord ↔ Tenant lean methodology
- Overall (STATE)
- 90 Strongly Landlord-Friendly
- State Alabama
- 90 Strongly Landlord-Friendly · R+15
- County
- — inherits STATE
- City
- — inherits STATE
ZIP-level market 35235
- Home prices YoY
- -21.1%
- Rents YoY
- 5.4%
- Active inventory
- 114
- Price-to-rent
- 7.9×
Monthly cashflow live
- Estimated rent
- $1,527 high interval (Pro) →
- Mortgage (P&I)
- −$760
- Tax from tax record
- −$43 /mo · $519/yr
- Insurance
- −$60
- HOA
- −$0
- Vacancy / Maint / Mgmt
- −$321
- Net cashflow
- $342
Break-even live
Sensitivity live
| Price | -10% $424 | -5% $383 | +0% $342 | +5% $301 | +10% $260 |
|---|---|---|---|---|---|
| Rent | -10% $222 | -5% $282 | +0% $342 | +5% $403 | +10% $463 |
| Rate | -1.0pp $415 | -0.5pp $379 | base $342 | +0.5pp $305 | +1.0pp $267 |
UW: 25.0% down · 7.5% · 30yr · 1.5% tax · 5.0% vac · 8.0% maint · 8.0% mgmt
Financing live
Cash to close
- Down payment
- $36,250
- Closing costs
- $4,350
- Reserves months
- —
- Total cash needed
- —
Loan-product check · same deal, 3 products live
Conventional
25% down · 7.5% · 30yr
- Down + closing
- —
- Monthly P&I
- —
- Monthly cashflow
- —
- DSCR
- —
- Eligible?
- —
Personal DTI + credit; lowest rate.
DSCR
20% down · 8.5% · 30yr
- Down + closing
- —
- Monthly P&I
- —
- Monthly cashflow
- —
- DSCR
- —
- Eligible?
- —
No personal income docs; deal must DSCR.
Hard money
10% down · 12.0% · 12mo
- Down + closing
- —
- Monthly P&I
- —
- Monthly cashflow
- —
- DSCR
- —
- Eligible?
- —
Short-term bridge; refi at stabilization.
Rent comps 38 comps
| Address | Beds | Baths | Sqft | Rent | $/sqft | DOM | Units | Dist |
|---|---|---|---|---|---|---|---|---|
| 1830 Christian St Birmingham, AL | 3.0 | 2.0 | 1468 | $1,375 | $0.94 | 4d | 1 | 0.19mi |
| 1748 Sonia Dr Birmingham, AL | 4.0 | 2.0 | 1401 | $1,395 | $1.00 | 44d | 1 | 0.21mi |
| 1817 Lyle Dr Birmingham, AL | 4.0 | 2.0 | 1361 | $1,605 | $1.18 | 24d | 1 | 0.22mi |
| 1760 Sonia Dr Birmingham, AL | 3.0 | 2.0 | 1550 | $1,635 | $1.05 | 2d | 1 | 0.25mi |
| 1819 Valley Run Cir Birmingham, AL | 4.0 | 2.5 | 1694 | $1,761 | $1.04 | 44d | 1 | 0.25mi |
| 1808 Brewster Rd Birmingham, AL | 4.0 | 2.0 | 1548 | $1,515 | $0.98 | 44d | 1 | 0.31mi |
| 1868 Carraway St Birmingham, AL | 3.0 | 2.0 | 1819 | $1,500 | $0.82 | 24d | 1 | 0.40mi |
| 2025 Brewster Rd Birmingham, AL | 3.0 | 2.0 | 1369 | $1,450 | $1.06 | 24d | 1 | 0.42mi |
| 1733 Molly Dr Birmingham, AL | 4.0 | 1.5 | 1570 | $1,460 | $0.93 | 11d | 1 | 0.59mi |
| 1935 Springlake Ct Unit 1 Birmingham, AL | 2.0 | 1.5 | 1152 | $1,095 | $0.95 | 44d | 1 | 0.63mi |
| 856 Parkbrook Trl Birmingham, AL | 1.0–3.0 | 1.0–2.0 | 925 | $1,180 | $1.28 | 3d | 10 | 0.83mi |
| 1761 Big Mountain Dr Birmingham, AL | 4.0 | 2.0 | 1632 | $1,575 | $0.97 | 45d | 1 | 0.84mi |
| 1845 Stonehenge Dr Birmingham, AL | 3.0 | 2.0 | 1358 | $1,323 | $0.97 | 15d | 1 | 0.86mi |
| 600 20th Ct NE Center Point, AL | 3.0 | 2.0 | 1878 | $1,650 | $0.88 | 24d | 1 | 0.92mi |
| 1753 Tall Oak Cir Birmingham, AL | 3.0 | 2.0 | 1380 | $1,225 | $0.89 | 4d | 1 | 0.96mi |
| 1729 Tall Oak Cir Birmingham, AL | 3.0 | 2.0 | 1403 | $1,630 | $1.16 | 2d | 1 | 0.97mi |
| 2202 Cheshire Dr Birmingham, AL | 3.0 | 2.5 | 1536 | $1,325 | $0.86 | 3d | 1 | 1.00mi |
| 2258 Cheshire Dr Birmingham, AL | 2.0 | 2.0 | 1152 | $1,050 | $0.91 | 44d | 1 | 1.03mi |
| 2415 Ormond Dr Center Point, AL | 3.0 | 1.5 | 1194 | $1,295 | $1.08 | 44d | 1 | 1.05mi |
| 5531 Saint James St Birmingham, AL | 2.0 | 1.5 | 1072 | $950 | $0.89 | 44d | 1 | 1.12mi |
| 5528 Saint James St Birmingham, AL | 2.0 | 1.5 | 1072 | $1,150 | $1.07 | 44d | 1 | 1.13mi |
| 1516 Highland Dr Birmingham, AL | 4.0 | 2.0 | 1104 | $1,675 | $1.52 | 15d | 1 | 1.14mi |
| 2232 6th St NE Center Point, AL | 3.0 | 1.0 | 1550 | $1,150 | $0.74 | 44d | 1 | 1.16mi |
| 2487 Hampstead Dr Birmingham, AL | 2.0 | 1.5 | 1163 | $995 | $0.86 | 4d | 1 | 1.17mi |
| 2543 Hampstead Dr Birmingham, AL | 2.0 | 2.5 | 1272 | $1,123 | $0.88 | 24d | 1 | 1.18mi |
| 2463 Hampstead Dr Birmingham, AL | 2.0 | 1.5 | 1100 | $1,127 | $1.02 | 4d | 1 | 1.18mi |
| 413 20th Ct NE Center Point, AL | 3.0 | 1.5 | 1540 | $1,375 | $0.89 | 44d | 1 | 1.19mi |
| 1700 Serene Dr Birmingham, AL | 4.0 | 1.5 | 1543 | $1,630 | $1.06 | 3d | 1 | 1.21mi |
| 1421 Brewster Cir Birmingham, AL | 3.0 | 2.0 | 1439 | $1,525 | $1.06 | 2d | 1 | 1.28mi |
| 2350 Grayson Valley Cir Birmingham, AL | 3.0 | 2.5 | 1380 | $1,595 | $1.16 | 44d | 1 | 1.29mi |
| 2358 Grayson Valley Cir Birmingham, AL | 3.0 | 3.0 | 1320 | $1,503 | $1.14 | 12d | 1 | 1.30mi |
| 2249 4th Place Cir NE Center Point, AL | 3.0 | 1.5 | 1400 | $1,400 | $1.00 | 44d | 1 | 1.30mi |
| 2345 Grayson Valley Cir Birmingham, AL | 2.0 | 1.5 | 1056 | $1,150 | $1.09 | 4d | 1 | 1.32mi |
| 5240 Jean Dr Pinson, AL | 4.0 | 2.0 | 1714 | $1,695 | $0.99 | 44d | 1 | 1.32mi |
| 940 Pine Hill Rd Birmingham, AL | 3.0 | 2.0 | 1926 | $1,475 | $0.77 | 44d | 1 | 1.34mi |
| 1409 Medina Ln Birmingham, AL | 3.0 | 2.0 | 2113 | $1,600 | $0.76 | 44d | 1 | 1.36mi |
| 1440 Hickory Ln Birmingham, AL | 3.0 | 2.0 | 1448 | $1,625 | $1.12 | 2d | 1 | 1.40mi |
| 5010 Darlene Dr Pinson, AL | 3.0 | 2.0 | 1914 | $1,550 | $0.81 | 24d | 1 | 1.48mi |
Listing history 2 events
-
2026-06-18remarks 699-char remark
-
2026-06-18$145,000 Coming Soon 1 DOM
ⓘ Source: listings_history table (triggers on properties + properties_extension) + one-shot
backfill from property_details.listing_events for pre-trigger history.
Tax reassessment forecast AL · Resets to sale price
- Current annual tax
- $519 · $43/mo
- Projected year-2 tax
- $594 · $50/mo
- Expected delta
- +$75/yr (+$6/mo · 14.5%)
ⓘ Screening estimate from a state-policy table — verify with the county assessor before closing.
Climate risk First Street
- Flood 1/10 Low FEMA zone X (unshaded) · 0% chance over 30 yrs
- Wildfire 4/10 Moderate
- Heat 5/10 Major 7 d/yr ≥105°F today · 19 d/yr by 30 yrs out
- Wind 6/10 Major 27% chance of damaging wind over 30 yrs
- Air quality 5/10 Major 7 unhealthy d/yr today · 9 by 30 yrs out
Nearby sold comps map
Loading sold comps map…
Walkable amenities ~0.75 mi
Loading nearby amenities…
Taxation est. · year 1
- Rental income
- $18,325
- − Mortgage interest
- −$8,122
- − Property taxes
- −$519
- − Insurance
- −$725
- − Repairs & maintenance
- −$1,466
- − Management
- −$1,466
- − Depreciation
- −$4,218
- Taxable income
- $1,808
- Est. tax owed @ 24.0%
- −$434
- After-tax cash flow
- $3,674/yr
For passive investors: Depreciation is non-cash, so a rental often shows a tax loss while cash-flowing — sheltering income. Rental losses are passive: they offset passive income freely, and up to $25,000/yr can offset ordinary (W-2) income if you actively participate and your MAGI is under $100k (phasing out to $0 by $150k); unused losses carry forward. On sale, claimed depreciation is recaptured at up to 25%, and gains may owe capital-gains tax (a 1031 exchange can defer both). Figures are a year-1 estimate at your 24.0% rate — not tax advice; consult a CPA.
Schools (NCES district)
- District
- Jefferson County
- NCES district ID
- 0101920
- Math proficiency
- 9% ▼ -24.00%
- Reading proficiency
- 32% ▼ -5.00%
- Median HH income
- $51,712
- Composite
- 18.4/100
- National rank
- #8937
- State rank
- #104 of 129 in AL
Livability — Grayson Valley
- Score
- 65/100
- State rank
- #139
- US rank
- #13418
Category grades
Schools grade is shown separately in the Schools card above.
Census & demographics
- Census place
- Grayson Valley, AL
- County
- Jefferson County · 527,445 people
- Metro
- Birmingham-Hoover, AL
- Population (ZIP)
- 20,526
- Household income
- $63,295
- Rent vs Own
- Severe rent burden
- 941.0
Population outlook (Jefferson County) Hauer SSP2
- Today (2025)
- 669,185 people
- By 2030
- 669,694 · +0.1%
- By 2040
- 661,388 · -1.2%
- By 2050
- 643,086 · -3.9%
- By 2075
- 577,267 · -13.7%
- By 2100
- 474,758 · -29.1%
Race, ethnicity, and origin ACS 2023
- Neighborhood character
- Majority Black (63%)
- Race & ethnicity
- Black 63% White 30% Two or more races 3% Asian 2% Hispanic / Latino 2%
- Common ancestry
- Slovak 2% Serbian 1% Italian 1%
- Foreign-born
- 3% · Canada
- Languages at home
- 96% English-only · Spanish 2% Other Asian/Pacific 1%
Political lean MEDSL · Jefferson
- 2024 margin
- D (+10.4) · D 54.6% · R 44.2% · Other 1.2%
- 2008→2024 swing
- +5.4pp toward D · 2008: 5.1pp · 2024: 10.4pp
- All cycles
- 2024: D+10.4 2020: D+13.2 2016: D+7.2 2012: D+6.0 2008: D+5.1
Not yet ingested
- Civics
- —
Market trends
- HPI YoY
- ▼ -54.62%
- Current HPI
- 204.6532
- Rent YoY
- ▲ 5.39%
- Metro
- Birmingham-Hoover, AL
- State GDP YoY
- ▲ 2.94%
- F500 in state
- 4
Industry mix (Fortune 500 HQ in AL)
| Industry | F500 HQs | Revenue |
|---|---|---|
| Financial Services | 1 | $8B |
|
||
| Healthcare | 1 | $5B |
|
||
Price history
+38.2% since first listed5 events — show timeline
- 2026-06-17 Coming Soon $145,000 Greater Alabama MLS
- 2019-01-14 Sold (Public Records) $104,999 Public Records
- 2019-01-11 Sold (MLS) $104,900 Greater Alabama MLS
- 2018-12-11 Contingent — Greater Alabama MLS
- 2018-12-04 Listed $104,900 Greater Alabama MLS
Property tax history
+0.0%/yrLatest (2025): $519 · -29.5% YoY. Source: county tax records.
Cash-flow waterfall
monthlySold comps — $/sqft
last 12 mo · ≤1 miLoading sold comps…