19 Pine St · Rochester, NH
Flood risk 1/10 · Minimal
- FEMA flood zone
- X (unshaded)
- Chance of flooding over 30 yrs
- 0.0%
- Est. flood insurance / yr
- $473 – $860
Fire risk 1/10 · Minimal
- Est. fire insurance / yr
- $507 – $941
Heat risk 4/10 · Minor
- Hot days now (above 97°F)
- 7 days/yr
- Hot days in 30 yrs
- 16 days/yr
Wind risk 4/10 · Minor
- Chance of severe wind over 30 yrs
- 18.0%
Air-quality risk 2/10 · Minimal
- Unhealthy air days now
- 1 days/yr
- Unhealthy air days in 30 yrs
- 1 days/yr
Risk factors via First Street. Map © Google.
Why this score? — see what drove the B- grade
The composite is a weighted blend of 9 inputs, each scored 0–100. Each bar is that input's sub-score; the figure is the points it added to the 100-point composite (weight × sub-score).
- Cash flow +23.7/30.0
- ARV discount +15.0/15.0
- DSCR +7.6/10.0
- 1% rule +6.2/10.0
- Livability +4.2/5.0
- Rent growth +3.6/5.0
- Schools +2.7/10.0
- Condition / age +2.5/5.0
- Appreciation +0.0/10.0
$225,000
🖨 Deal sheet (PDF) 📄 Offer letter ✓ Due diligence
Listing remarks
This property is eligible under the First Look Initiative. All Owner Occupant offers will be responded to after 7 days on the market and Investor offers will be responded to after 30 days. However, all offers can be submitted during the First Look period. It's time to bring this home back to life. With over 1600 SQ ft of living space over 2 stories. This home offers 3 bedrooms, 1 bathroom, living room, dining room, and a spacious kitchen. A viewing release must be signed and returned to our office before showing this property.
Key facts
- 2,178 sq ft lot
- Built 1901
- Listed 24 days
Property features AI
Finance
- Other: Lot number 158; Easement information unknown; Survey status unknown; Located downtown Rochester (directions: Downtown Rochester to N. Main St., left on Pine St.; house is on the right)
- Financial info: Property is foreclosed / bank-owned / REO
Exterior
- Utilities: Public water; Public sewer; Circuit breaker electrical service; No internet service listed
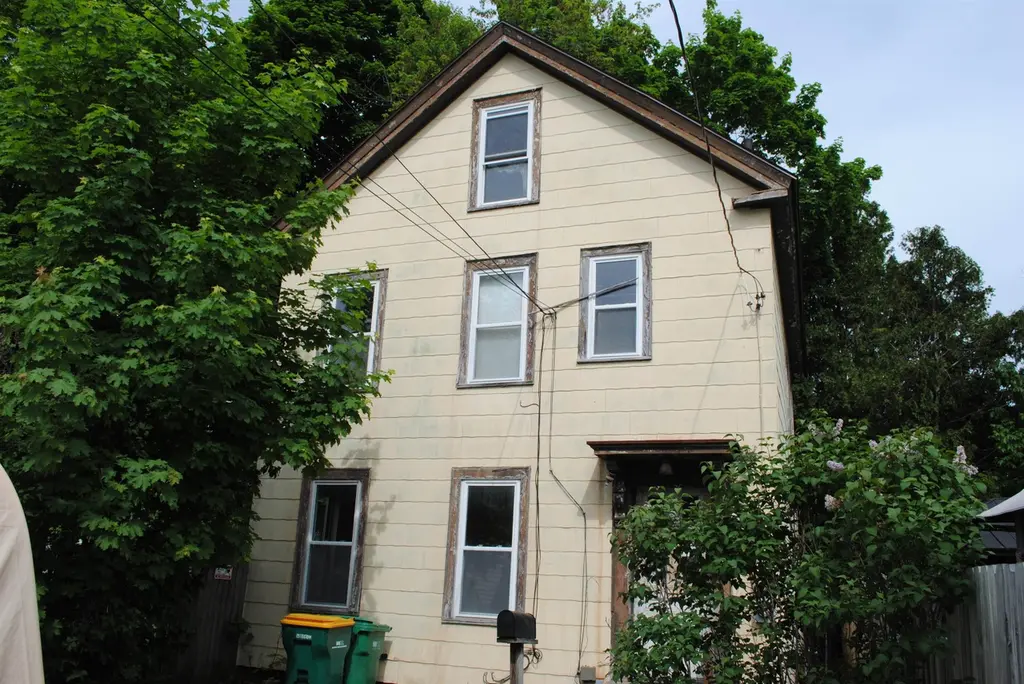
- Home design: New Englander architectural style; Existing single-family structure; Yellow exterior; Shingle roof
- Construction: Wood frame construction; Built in 1901
- Exterior features: Located in town; In-town lot
Interior
- Bathrooms: One three-quarter bathroom
- Heating & cooling: Forced air heating
- Interior features: Six total rooms; Unfinished walk-up basement
Neighborhood map
What this means for you Summary
Snapshot
- This is a 3-bed/1.0-bath single-family listed at $225k.
Deal economics
- At list price, monthly cash flow is $426 ($5k/yr) — positive.
- The deal already cash-flows at list — no discount required.
- Meets the 1% rule at list price ($3k rent vs $225k).
- Recommended offer: $222k (1.5% below list) — sets the bar for market timing.
- Cap rate 8.6% vs local median 3.3% in Rochester — top-decile yield for the area; either an underpriced asset or a hidden risk that comps aren't pricing in. Stress-test before assuming the spread holds.
Location & tenants
- Location reads 84/100 on livability (#8 in NH, #698 nationally) — a professional / high-income tenant draw. Strengths: crime A+, commute A+, cost of living A+; Watch: amenities C-.
- Rochester School District (suburban): math 27% / reading 35% proficiency, ranked #83 of 98 in NH (top 85%) — families likely to look elsewhere, expect single-tenant / working-renter base with shorter leases.
- Market conditions: Rents rising fast (+4.2%/yr); 109 active listings in the ZIP; 17 comparable units currently listed for rent nearby; rentals at typical pace (median 25d on market — plan ~3-4 weeks tenant-placement turnaround); solid renter incomes; 951 units permitted in Strafford County in 2024 (551 in 5+ unit buildings).
- This rent runs 39% of the median local income ($79k/yr) — at the standard rent-burdened threshold; future hikes will face affordability resistance.
Forward outlook
- Local home prices are declining (-3.0%/yr); year-one equity from $2k of loan paydown is wiped out by about $7k of value loss. Plan a longer hold.
- Strafford County population projected at +7% by 2050 — modest demand growth; plan on rents tracking national, not racing it.
Negotiation context
- It's been on market 25 days — a 2% lower offer ($222k) is reasonable based on typical stale-listing flexibility.
Risks & watch-outs
- Watch-outs: built in 1901 — expect roof / HVAC / electrical / plumbing capex.
Questions for the listing agent
- Built in 1901 — when were the roof, HVAC, electrical panel, plumbing, and water heater last replaced?
- Is there a deadline driving the sale (1031 exchange, divorce, estate, relocation)? That informs how much negotiation room exists.
- What's the average days-on-market for RENTAL listings here right now (not sales)? A rising rental-DOM trend means longer vacancies and softer asking-rent achievability than the comps imply.
- What's the recent tenant-quality profile in this submarket — average credit score on applications, eviction rate, late-payment / NSF rate, and stable-employment percentage? A property-management company in the area should have these aggregated.
- How much new for-sale + rental construction is in the pipeline within 1–3 miles? Heavy new supply typically softens prices + rents 12–24 months out; constrained supply supports both.
Investment metrics
- 1% rule
- 1.12% ✓
- Cap rate
- 8.57%
- Cash-on-cash
- 8.12%
- DSCR
- 1.36
- GRM
- 7.4
CMA / ARV
- ARV (on-the-fly)
- $419,100
- Comps found
- 12
Show comp detail 12 sales within ~0.75 mi
| Address | Dist | Beds/Ba | Sqft | Sold | Price | $/sf | Match |
|---|---|---|---|---|---|---|---|
| 11 Lyons St | 0.51mi | 3/1.0 | 1,680 (+2%) | 0mo | $453,000 | $270 | 73 |
| 51 Chestnut St | 0.19mi | 2/2.0 (-1) | 1,613 (-2%) | 8mo | $311,000 | $193 | 71 |
| 34 Leonard St | 0.58mi | 3/1.5 | 1,652 (+0%) | 11mo | $420,000 | $254 | 62 |
| 33 Linden St | 0.74mi | 3/2.0 | 1,648 (-0%) | 1mo | $473,500 | $287 | 61 |
| 81 Washington St | 0.44mi | 3/1.5 | 1,775 (+8%) | 5mo | $390,000 | $220 | 61 |
| 1 Farrington St | 0.71mi | 3/1.5 | 1,616 (-2%) | 4mo | $370,000 | $229 | 58 |
| 5 Saint James Ter | 0.75mi | 3/1.5 | 1,600 (-3%) | 1mo | $530,000 | $331 | 58 |
| 7 Amanda St | 0.54mi | 3/2.0 | 1,755 (+6%) | 10mo | $490,000 | $279 | 52 |
| 157 Wakefield St | 0.74mi | 4/2.0 (+1) | 1,662 (+1%) | 5mo | $300,000 | $181 | 51 |
| 99 Washington St | 0.52mi | 2/1.5 (-1) | 1,444 (-12%) | 2mo | $380,000 | $263 | 46 |
| 3 Fortier Dr | 0.49mi | 3/2.0 | 1,831 (+11%) | 11mo | $379,000 | $207 | 46 |
| 21 Lois St | 0.45mi | 4/1.5 (+1) | 1,883 (+14%) | 9mo | $215,000 | $114 | 41 |
Match score weights: distance 35% · size 25% · config 20% · recency 20%. Top-matched comps best support the ARV.
Projected returns pro-forma
-3.0% appreciation · 4.22% rent growth · sell at horizon
- IRR
- -2.5%
- Equity multiple
- 0.90×
- Total profit
- $-6,120
- Equity at exit
- $33,548
- IRR
- 8.5%
- Equity multiple
- 1.68×
- Total profit
- $43,035
- Equity at exit
- $19,454
Cash invested: $63,000 (down + closing). Projections, not guarantees.
Landlord ↔ Tenant lean methodology
- Overall (STATE)
- 56 Moderately Landlord-Leaning
- State New Hampshire
- 56 Moderately Landlord-Leaning · D+1
- County
- — inherits STATE
- City
- — inherits STATE
ZIP-level market 03867
- Home prices YoY
- -22.0%
- Rents YoY
- 4.2%
- Active inventory
- 109
- Price-to-rent
- 7.4×
Monthly cashflow live
- Estimated rent
- $2,527 high interval (Pro) →
- Mortgage (P&I)
- −$1,180
- Tax from tax record
- −$297 /mo · $3,559/yr
- Insurance
- −$94
- HOA
- −$0
- Vacancy / Maint / Mgmt
- −$531
- Net cashflow
- $426
Break-even live
Sensitivity live
| Price | -10% $554 | -5% $490 | +0% $426 | +5% $363 | +10% $299 |
|---|---|---|---|---|---|
| Rent | -10% $227 | -5% $326 | +0% $426 | +5% $526 | +10% $626 |
| Rate | -1.0pp $540 | -0.5pp $484 | base $426 | +0.5pp $368 | +1.0pp $309 |
UW: 25.0% down · 7.5% · 30yr · 1.5% tax · 5.0% vac · 8.0% maint · 8.0% mgmt
Financing live
Cash to close
- Down payment
- $56,250
- Closing costs
- $6,750
- Reserves months
- —
- Total cash needed
- —
Loan-product check · same deal, 3 products live
Conventional
25% down · 7.5% · 30yr
- Down + closing
- —
- Monthly P&I
- —
- Monthly cashflow
- —
- DSCR
- —
- Eligible?
- —
Personal DTI + credit; lowest rate.
DSCR
20% down · 8.5% · 30yr
- Down + closing
- —
- Monthly P&I
- —
- Monthly cashflow
- —
- DSCR
- —
- Eligible?
- —
No personal income docs; deal must DSCR.
Hard money
10% down · 12.0% · 12mo
- Down + closing
- —
- Monthly P&I
- —
- Monthly cashflow
- —
- DSCR
- —
- Eligible?
- —
Short-term bridge; refi at stabilization.
Rent comps 17 comps
| Address | Beds | Baths | Sqft | Rent | $/sqft | DOM | Units | Dist |
|---|---|---|---|---|---|---|---|---|
| 10 Gagne St Rochester, NH | 2.0 | 1.5 | 1500 | $2,400 | $1.60 | 0d | 1 | 0.21mi |
| 20 Fownes Mill Ct Rochester, NH | 2.0 | 2.0 | 1200 | $2,350 | $1.96 | 44d | 1 | 0.23mi |
| 20 Fownes Mill Ct Rochester, NH | 2.0 | 2.0 | 1200 | $2,300 | $1.92 | 25d | 1 | 0.23mi |
| 58 Washington St Rochester, NH | 3.0 | 1.0 | 1120 | $2,300 | $2.05 | 6d | 1 | 0.34mi |
| 12 Beaver Way Unit 101 Rochester, NH | 2.0 | 1.5 | 1375 | $2,000 | $1.45 | 25d | 1 | 0.46mi |
| 27 Knight St Unit 2 Rochester, NH | 3.0 | 1.0 | 1400 | $2,000 | $1.43 | 44d | 1 | 0.56mi |
| 7 Springfield Est Rochester, NH | 2.0 | 1.5 | 1200 | $2,200 | $1.83 | 0d | 1 | 0.64mi |
| 51 Eastern Ave Rochester, NH | 3.0 | 2.0 | 1957 | $3,295 | $1.68 | 6d | 1 | 0.72mi |
| 32 Emerson Ave Rochester, NH | 3.0 | 2.5 | 1525 | $3,350 | $2.20 | 0d | 7 | 1.00mi |
| 36 Hawthorne Way Unit F Rochester, NH | 3.0 | 2.5 | 1525 | $3,250 | $2.13 | 44d | 1 | 1.01mi |
| 36 Hawthorne Way Unit D Rochester, NH | 3.0 | 2.5 | 1525 | $3,250 | $2.13 | 5d | 1 | 1.01mi |
| 18 Hawthorne Way Unit F Rochester, NH | 3.0 | 2.5 | 1525 | $3,250 | $2.13 | 44d | 1 | 1.15mi |
| 43 Monroe Dr Unit 3 Rochester, NH | 3.0 | 2.5 | 1675 | $2,936 | $1.75 | 25d | 1 | 1.18mi |
| 63 Monroe Dr Unit 8 Rochester, NH | 3.0 | 2.0 | 1525 | $2,833 | $1.86 | 25d | 1 | 1.22mi |
| 6 Truman Cir Rochester, NH | 3.0 | 2.5 | 1675 | $2,936 | $1.75 | 0d | 1 | 1.24mi |
| 64 Monroe Dr Unit 5 Rochester, NH | 3.0 | 2.5 | 1675 | $2,936 | $1.75 | 44d | 1 | 1.25mi |
| 9 Elm Ct Rochester, NH | 2.0 | 1.0 | 1100 | $2,000 | $1.82 | 0d | 1 | 1.45mi |
Listing history 16 events
-
2026-06-21days on market $225,000 Active 25 DOM
-
2026-06-18days on market $225,000 Active 22 DOM
-
2026-06-17days on market $225,000 Active 21 DOM
-
2026-06-16days on market $225,000 Active 20 DOM
-
2026-06-15days on market $225,000 Active 19 DOM
-
2026-06-13days on market $225,000 Active 17 DOM
-
2026-06-13days on market $225,000 Active 16 DOM
-
2026-06-09days on market $225,000 Active 13 DOM
-
2026-06-08days on market $225,000 Active 12 DOM
-
2026-06-07days on market $225,000 Active 11 DOM
-
2026-06-04days on market $225,000 Active 8 DOM
-
2026-06-03days on market $225,000 Active 7 DOM
-
2026-06-02days on market $225,000 Active 6 DOM
-
2026-06-01days on market $225,000 Active 5 DOM
-
2026-05-31days on market $225,000 Active 4 DOM
-
2026-05-27$225,000 Active
ⓘ Source: listings_history table (triggers on properties + properties_extension) + one-shot
backfill from property_details.listing_events for pre-trigger history.
Tax reassessment forecast NH · Partial reset (capped growth)
- Current annual tax
- $3,559 · $297/mo
- Projected year-2 tax
- $4,232 · $353/mo
- Expected delta
- +$673/yr (+$56/mo · 18.9%)
ⓘ Screening estimate from a state-policy table — verify with the county assessor before closing.
Climate risk First Street
- Flood 1/10 Low FEMA zone X (unshaded) · 0% chance over 30 yrs
- Wildfire 1/10 Low
- Heat 4/10 Moderate 7 d/yr ≥97°F today · 16 d/yr by 30 yrs out
- Wind 4/10 Moderate 18% chance of damaging wind over 30 yrs
- Air quality 2/10 Low 1 unhealthy d/yr today · 1 by 30 yrs out
Nearby sold comps map
Loading sold comps map…
Walkable amenities ~0.75 mi
Loading nearby amenities…
Taxation est. · year 1
- Rental income
- $30,328
- − Mortgage interest
- −$12,603
- − Property taxes
- −$3,559
- − Insurance
- −$1,125
- − Repairs & maintenance
- −$2,426
- − Management
- −$2,426
- − Depreciation
- −$6,545
- Taxable income
- $1,642
- Est. tax owed @ 24.0%
- −$394
- After-tax cash flow
- $4,722/yr
For passive investors: Depreciation is non-cash, so a rental often shows a tax loss while cash-flowing — sheltering income. Rental losses are passive: they offset passive income freely, and up to $25,000/yr can offset ordinary (W-2) income if you actively participate and your MAGI is under $100k (phasing out to $0 by $150k); unused losses carry forward. On sale, claimed depreciation is recaptured at up to 25%, and gains may owe capital-gains tax (a 1031 exchange can defer both). Figures are a year-1 estimate at your 24.0% rate — not tax advice; consult a CPA.
Schools (NCES district)
- District
- Rochester School District
- NCES district ID
- 3305940
- Math proficiency
- 27% ▼ -15.00%
- Reading proficiency
- 35% ▼ -14.00%
- Median HH income
- $51,080
- Composite
- 27.11/100
- National rank
- #7039
- State rank
- #83 of 98 in NH
Livability — Rochester
- Score
- 84/100
- State rank
- #8
- US rank
- #698
Category grades
Schools grade is shown separately in the Schools card above.
Census & demographics
- Census place
- Rochester, NH
- County
- Strafford County · 75,181 people
- City population
- 22,732
- Metro
- Boston-Cambridge-Newton, MA-NH
- Population (ZIP)
- 22,732
- Household income
- $78,674
- Rent vs Own
- Severe rent burden
- 663.0
Population outlook (Strafford County) Hauer SSP2
- Today (2025)
- 132,503 people
- By 2030
- 135,377 · +2.2%
- By 2040
- 139,609 · +5.4%
- By 2050
- 141,803 · +7.0%
- By 2075
- 149,280 · +12.7%
- By 2100
- 148,667 · +12.2%
Race, ethnicity, and origin ACS 2023
- Neighborhood character
- Predominantly White (93%)
- Race & ethnicity
- White 93% Two or more races 4% Hispanic / Latino 2% Asian 1%
- Common ancestry
- Lithuanian 12% Romanian 2% Serbian 2%
- Foreign-born
- 3% · Canada
- Languages at home
- 96% English-only · Spanish 1% French/Haitian/Cajun 1%
Political lean MEDSL · Strafford
- 2024 margin
- D (+12.1) · D 55.5% · R 43.5% · Other 1.0%
- 2008→2024 swing
- -8.3pp toward R · 2008: 20.4pp · 2024: 12.1pp
- All cycles
- 2024: D+12.1 2020: D+15.2 2016: D+8.6 2012: D+14.5 2008: D+20.4
Not yet ingested
- Civics
- —
Market trends
- HPI YoY
- ▼ -107.34%
- Current HPI
- 379.5755
- Rent YoY
- ▲ 4.22%
- Metro
- Boston-Cambridge-Newton, MA-NH
- State GDP YoY
- —
- F500 in state
- 0
Price history
1 event — show timeline
- 2026-05-27 Listed $225,000 PrimeMLS
Property tax history
+4.0%/yrLatest (2025): $3,559 · +3.0% YoY. Source: county tax records.
Cash-flow waterfall
monthlySold comps — $/sqft
last 12 mo · ≤1 miLoading sold comps…