100 SW 195th Ave #90 · Hillsboro, OR
Flood risk 1/10 · Minimal
- FEMA flood zone
- X (unshaded)
- Chance of flooding over 30 yrs
- 0.0%
- Est. flood insurance / yr
- $507 – $1,088
Fire risk 1/10 · Minimal
- Est. fire insurance / yr
- $498 – $926
Heat risk 3/10 · Minor
- Hot days now (above 92°F)
- 7 days/yr
- Hot days in 30 yrs
- 14 days/yr
Wind risk 1/10 · Minimal
- Chance of severe wind over 30 yrs
- —
Air-quality risk 8/10 · Major
- Unhealthy air days now
- 11 days/yr
- Unhealthy air days in 30 yrs
- 11 days/yr
Risk factors via First Street. Map © Google.
Why this score? — see what drove the D+ grade
The composite is a weighted blend of 9 inputs, each scored 0–100. Each bar is that input's sub-score; the figure is the points it added to the 100-point composite (weight × sub-score).
- Cash flow +15.0/30.0
- ARV discount +7.5/15.0
- 1% rule +5.0/10.0
- DSCR +5.0/10.0
- Livability +4.4/5.0
- Schools +3.7/10.0
- Condition / age +2.5/5.0
- Rent growth +2.1/5.0
- Appreciation +0.0/10.0
$50,000
🖨 Deal sheet 📄 Offer letter ✓ Due diligence
Listing remarks
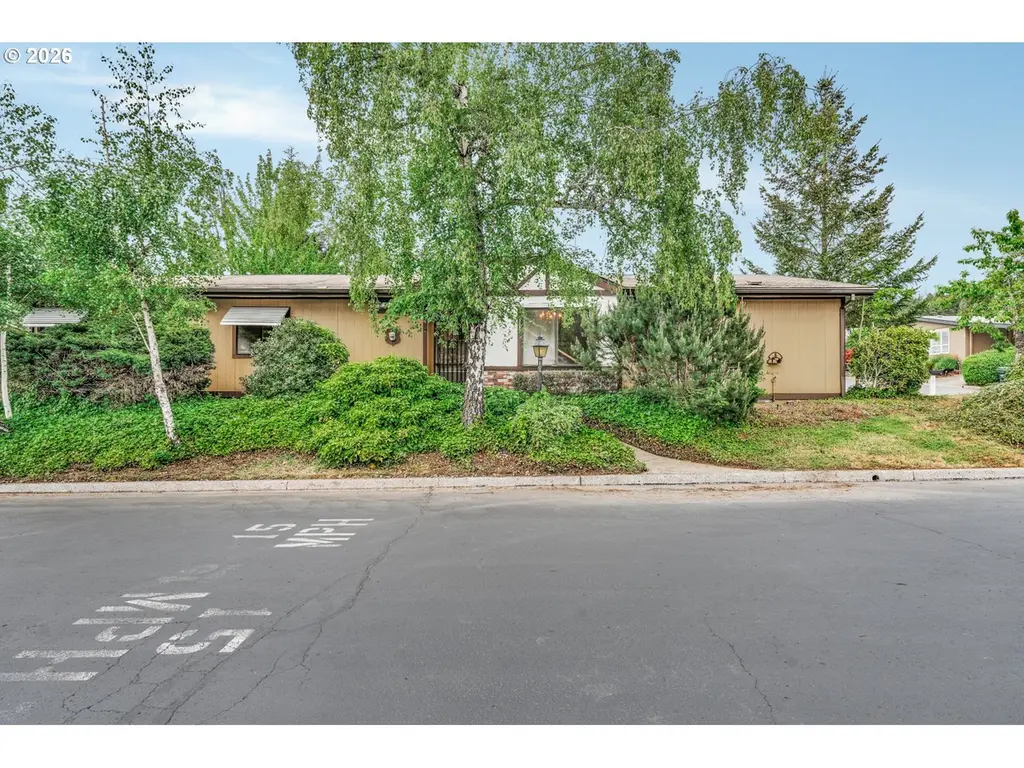
Welcome to easy living in the +55 gated Seminole Estates community! This spacious 3-bedroom, 2-bath manufactured home is full of character and comfort. From the moment you arrive, you’ll appreciate the charming setting, mature landscaping, covered carport, and oversized detached tool shed/workshop for all your storage and hobby needs. Inside, the vaulted-ceiling living room creates an open, airy feel and features a cozy gas fireplace with custom wood surround, perfect for relaxing evenings at home. Large sliding glass doors bring in natural light and open to the patio for seamless indoor-outdoor living. The generous kitchen offers lots of cabinet storage and counter space, a pantry, a
Key facts
- Gated community
- Covered carport
- Gas fireplace
Tags
Property features AI
Finance
- Other: Property is resale; Lot rent paid monthly
- Financial info: Monthly lot rent listed (monthly amount provided)
- HOA & community: Located in Seminole Estates (park) — senior community; Park limits pets to 2 pets under 30 lb.
Exterior
- Parking: Driveway parking; Carport (1 space)
- Utilities: Public water; Public sewer; Electric service
- Home design: Manufactured home in a park (residential); Single-level living (main level area reported); Built in 1984; No notable view
- Construction: Built in 1984; Metal roof; Manufactured home construction
- Exterior features: Metal roof; Patio; Tool shed; Gated and level lot; Paved road access; Other exterior description
Interior
- Kitchen: Dishwasher; Free-standing range; Range hood; Pantry
- Bedrooms: Primary bedroom on main level with ensuite bathroom, soaking tub and walk-in closet; Second bedroom on main level with closet and wall-to-wall carpet; Third bedroom on main level with closet and wall-to-wall carpet
- Flooring: Wall-to-wall carpet; Vinyl floor
- Bathrooms: Two full bathrooms (both on main level)
- Heating & cooling: Heat pump heating; No central cooling listed; Electric hot water
- Interior features: Laundry area with exterior entry and built-in features; Soaking tub; Vaulted ceilings; Wall-to-wall carpet in several rooms; Vinyl flooring in dining area
- Laundry & utility: Laundry on main level
Neighborhood map
What this means for you Summary
Snapshot
- This is a 3-bed/2.0-bath manufactured listed at $50k.
Deal economics
- At list price, monthly cash flow is $2k ($18k/yr) — positive.
- The deal already cash-flows at list — no discount required.
- Meets the 1% rule at list price ($2k rent vs $50k).
- Recommended offer: $49k (1.5% below list) — sets the bar for market timing.
- Cap rate 42.8% vs local median 2.9% in Hillsboro — top-decile yield for the area; either an underpriced asset or a hidden risk that comps aren't pricing in. Stress-test before assuming the spread holds.
Location & tenants
- Location reads 87/100 on livability (#13 in OR, #282 nationally) — a professional / high-income tenant draw. Strengths: amenities A+, commute A+, employment A+; Watch: crime D+, cost of living F.
- Hillsboro SD 1J (urban): math 35% / reading 46% proficiency, ranked #13 of 58 in OR (top 22%) — families likely to look elsewhere, expect single-tenant / working-renter base with shorter leases.
- Zoned schools: Imlay Elementary School (math 54% / reading 52%, grade C, #89 of 412 statewide, top 21%, 468 students, 35% FRL); Liberty High School (math 50% / reading 70%, grade C+, #23 of 143 statewide, top 19%, 1,454 students, 46% FRL) — zoned schools at 40% FRL track the district average.
- Zoned-school proficiency averages 56% at this address vs 40% district-wide (+16 pts) — the actual schools serving this property are materially stronger than the Hillsboro SD 1J average implies; a family-tenant draw the district grade alone would hide.
- Market conditions: Rents soft (-1.6%/yr); 245 active listings in the ZIP; 40 comparable units currently listed for rent nearby; rentals at typical pace (median 20d on market — plan ~3-4 weeks tenant-placement turnaround); solid renter incomes; 2,224 units permitted in Washington County in 2024 (242 in 5+ unit buildings).
Forward outlook
- Local home prices are declining (-3.0%/yr); year-one equity from $346 of loan paydown is wiped out by about $2k of value loss. Plan a longer hold.
- Washington County population projected at +33% by 2050 — long-run rental-demand tailwind backs the buy-and-hold thesis.
- At projected returns (-3.0% appreciation + 0.0% rent growth), your $14k cash investment doubles in ~1 year — after that, you're playing with house money.
Negotiation context
- It's been on market 15 days — a 2% lower offer ($49k) is reasonable based on typical stale-listing flexibility.
Questions for the listing agent
- Is there a deadline driving the sale (1031 exchange, divorce, estate, relocation)? That informs how much negotiation room exists.
- Crime grade is D in this area — have there been break-ins, vandalism, or insurance claims at this property in the last 3 years? What carrier currently insures it and at what premium?
- The area grade is low — what's the realistic commute time and amenity access for the typical tenant pool here? Any planned neighborhood developments (good or bad) we should know about?
- What's the average days-on-market for RENTAL listings here right now (not sales)? A rising rental-DOM trend means longer vacancies and softer asking-rent achievability than the comps imply.
- What's the recent tenant-quality profile in this submarket — average credit score on applications, eviction rate, late-payment / NSF rate, and stable-employment percentage? A property-management company in the area should have these aggregated.
- How much new for-sale + rental construction is in the pipeline within 1–3 miles? Heavy new supply typically softens prices + rents 12–24 months out; constrained supply supports both.
Investment metrics
- 1% rule
- 4.72% ✓
- Cap rate
- 42.79%
- Cash-on-cash
- 130.34%
- DSCR
- 6.80
- GRM
- 1.8
CMA / ARV
- ARV (median comp)
- $128,686
- List price
- $50,000
- Delta
- -61.15%
- Verdict
- UNDERPRICED
- Comps
- 20 within 1.0 mi
Show comp detail 12 sales within ~0.75 mi
| Address | Dist | Beds/Ba | Sqft | Sold | Price | $/sf | Match |
|---|---|---|---|---|---|---|---|
| 100 SW 195th Ave #90 | 0.00mi | 3/2.0 | 1,488 (0%) | 1mo | $46,000 | $31 | 99 |
| 100 SW 195th Ave #63 | 0.00mi | 3/2.0 | 1,512 (+2%) | 10mo | $120,000 | $79 | 89 |
| 100 SW 195th Ave #31 | 0.00mi | 2/2.0 (-1) | 1,536 (+3%) | 2mo | $79,900 | $52 | 88 |
| 100 SW 195th Ave #4 | 0.12mi | 2/2.0 (-1) | 1,440 (-3%) | 0mo | $139,000 | $97 | 84 |
| 100 SW 195th Ave #9 | 0.12mi | 3/2.0 | 1,440 (-3%) | 10mo | $145,000 | $101 | 81 |
| 100 SW 195th Ave #157 | 0.12mi | 2/2.0 (-1) | 1,536 (+3%) | 6mo | $102,000 | $66 | 79 |
| 100 SW 195th Ave #192 | 0.00mi | 2/2.0 (-1) | 1,536 (+3%) | 13mo | $89,000 | $58 | 79 |
| 100 SW 195th Ave #177 | 0.12mi | 3/2.0 | 1,450 (-3%) | 14mo | $133,000 | $92 | 78 |
| 100 SW 195th Ave #42 | 0.12mi | 2/2.0 (-1) | 1,440 (-3%) | 15mo | $111,000 | $77 | 72 |
| 100 SW 195th Ave #104 | 0.12mi | 3/2.0 | 1,296 (-13%) | 12mo | $130,000 | $100 | 62 |
| 8300 NE Quatama St #90 | 0.67mi | 3/2.0 | 1,620 (+9%) | 12mo | $60,000 | $37 | 44 |
| 8300 NE Quatama St #171 | 0.53mi | 3/2.0 | 1,296 (-13%) | 14mo | $185,500 | $143 | 42 |
Match score weights: distance 35% · size 25% · config 20% · recency 20%. Top-matched comps best support the ARV.
Projected returns pro-forma
-3.0% appreciation · 0.0% rent growth · sell at horizon
- IRR
- —
- Equity multiple
- 6.85×
- Total profit
- $81,868
- Equity at exit
- $7,455
- IRR
- —
- Equity multiple
- 13.10×
- Total profit
- $169,418
- Equity at exit
- $4,323
Cash invested: $14,000 (down + closing). Projections, not guarantees.
Landlord ↔ Tenant lean methodology
- Overall (STATE)
- 28 Tenant-Leaning
- State Oregon
- 28 Tenant-Leaning · D+6
- County
- — inherits STATE
- City
- — inherits STATE
ZIP-level market 97006
- Rents YoY
- -1.6%
- Active inventory
- 245
- Price-to-rent
- 1.8×
Monthly cashflow live
- Estimated rent
- $2,359 high interval (Pro) →
- Mortgage (P&I)
- −$262
- Tax from tax record
- −$60 /mo · $720/yr
- Insurance
- −$21
- HOA
- −$0
- Vacancy / Maint / Mgmt
- −$495
- Net cashflow
- $1,521
Break-even live
UW: 25.0% down · 7.5% · 30yr · 1.5% tax · 5.0% vac · 8.0% maint · 8.0% mgmt
Financing live
Cash to close
- Down payment
- $12,500
- Closing costs
- $1,500
- Reserves months
- —
- Total cash needed
- —
Loan-product check · same deal, 3 products live
Conventional
25% down · 7.5% · 30yr
- Down + closing
- —
- Monthly P&I
- —
- Monthly cashflow
- —
- DSCR
- —
- Eligible?
- —
Personal DTI + credit; lowest rate.
DSCR
20% down · 8.5% · 30yr
- Down + closing
- —
- Monthly P&I
- —
- Monthly cashflow
- —
- DSCR
- —
- Eligible?
- —
No personal income docs; deal must DSCR.
Hard money
10% down · 12.0% · 12mo
- Down + closing
- —
- Monthly P&I
- —
- Monthly cashflow
- —
- DSCR
- —
- Eligible?
- —
Short-term bridge; refi at stabilization.
Rent comps 40 comps
| Address | Beds | Baths | Sqft | Rent | $/sqft | DOM | Units | Dist |
|---|---|---|---|---|---|---|---|---|
| 410 SW Basilone Ter Beaverton, OR | 4.0 | 2.5 | 1642 | $2,675 | $1.63 | 16d | 1 | 0.21mi |
| 410 SW Basilone Ter Beaverton, OR | 4.0 | 2.5 | 1642 | $2,675 | $1.63 | 19d | 1 | 0.21mi |
| 380 NW Gina Way Beaverton, OR | 1.0–3.0 | 1.0–2.0 | 927 | $2,195 | $2.37 | 3d | 17 | 0.24mi |
| 456 SW 203rd Ter Beaverton, OR | 4.0 | 2.5 | 1727 | $2,925 | $1.69 | 43d | 1 | 0.26mi |
| 57 SW 206th Ave Beaverton, OR | 3.0 | 3.0 | 1200 | $2,450 | $2.04 | 14d | 1 | 0.28mi |
| 248 NW Prescott Pl Beaverton, OR | 3.0 | 3.0 | 1238 | $2,149 | $1.74 | 23d | 1 | 0.28mi |
| 43 SW 206th Ave Beaverton, OR | 3.0 | 2.5 | 1240 | $2,350 | $1.90 | 4d | 1 | 0.28mi |
| 20642 SW Bingo Ln Beaverton, OR | 3.0 | 2.5 | 1364 | $2,325 | $1.70 | 43d | 1 | 0.31mi |
| 650 201st Ave Aloha, OR | 2.0 | 2.0 | 985 | $1,688 | $1.71 | 3d | 5 | 0.32mi |
| 545 SW 201st Ave Beaverton, OR | 1.0–3.0 | 1.0–2.0 | 898 | $2,300 | $2.56 | 1d | 19 | 0.32mi |
| 719 SW Backcourt Pl Aloha, OR | 3.0 | 2.0 | 1384 | $2,325 | $1.68 | 43d | 1 | 0.37mi |
| 610 NE Garswood Ln Beaverton, OR | 3.0 | 2.5 | 1528 | $2,349 | $1.54 | 43d | 1 | 0.37mi |
| 630 NE Garswood Ln Beaverton, OR | 2.0 | 2.5 | 1249 | $1,999 | $1.60 | 21d | 1 | 0.38mi |
| 177 NW 208th Ave Beaverton, OR | 4.0 | 2.5 | 1824 | $2,700 | $1.48 | 23d | 1 | 0.43mi |
| 20674 SW Nantucket Ln Beaverton, OR | 3.0 | 2.5 | 1184 | $2,299 | $1.94 | 16d | 1 | 0.44mi |
| 20789 NW Painted Mountain Dr Beaverton, OR | 3.0 | 2.5 | 1753 | $2,375 | $1.35 | 43d | 1 | 0.44mi |
| 8712 NE Delamere Way Beaverton, OR | 3.0 | 2.5 | 1556 | $2,400 | $1.54 | 10d | 1 | 0.44mi |
| 283 NW 208th Ave Beaverton, OR | 3.0 | 2.5 | 1776 | $2,300 | $1.30 | 43d | 1 | 0.45mi |
| 762 SW 206th Pl Beaverton, OR | 2.0 | 1.5 | 1018 | $1,690 | $1.66 | 43d | 1 | 0.48mi |
| 577 SW 207th Ave Beaverton, OR | 3.0 | 2.5 | 1196 | $2,389 | $2.00 | 2d | 1 | 0.49mi |
| 20018 SW Monson St Beaverton, OR | 3.0 | 2.5 | 1484 | $2,395 | $1.61 | 43d | 1 | 0.51mi |
| 8650 NE Trailwalk Dr Hillsboro, OR | 1.0–3.0 | 1.0–2.0 | 963 | $2,090 | $2.17 | 1d | 29 | 0.52mi |
| 1090 NE 91st Ave Hillsboro, OR | 1.0–2.0 | 1.0–2.0 | 823 | $2,270 | $2.76 | 3d | 16 | 0.53mi |
| 1101 NE 89th Ave Hillsboro, OR | 1.0–3.0 | 1.0–2.0 | 1020 | $2,581 | $2.53 | 2d | 19 | 0.61mi |
| 472 NE Patricia Ann Pl Beaverton, OR | 2.0 | 2.5 | 1422 | $2,350 | $1.65 | 19d | 1 | 0.61mi |
| 9950 NE Gibbs Dr Hillsboro, OR | 4.0 | 1.0–2.0 | 1299 | $3,366 | $2.59 | 2d | 62 | 0.61mi |
| 1250 NE Compton Dr Hillsboro, OR | 2.0 | 2.0 | 996 | $2,379 | $2.39 | 11d | 1 | 0.62mi |
| 314 NE Edgeway Dr Beaverton, OR | 2.0 | 2.5 | 1300 | $2,395 | $1.84 | 23d | 1 | 0.63mi |
| 477 NE Edgeway Dr Beaverton, OR | 3.0 | 3.5 | 1600 | $2,300 | $1.44 | 2d | 1 | 0.63mi |
| 1390 NE Compton Dr Hillsboro, OR | 1.0–2.0 | 1.0–2.0 | 862 | $3,060 | $3.55 | 1d | 344 | 0.64mi |
| 10795 NE Gateway Pl Beaverton, OR | 2.0 | 2.5 | 1104 | $2,099 | $1.90 | 23d | 1 | 0.64mi |
| 8646 NE Trafalgar Ln Beaverton, OR | 3.0 | 2.0 | 1200 | $2,145 | $1.79 | 43d | 1 | 0.67mi |
| 8641 NE Trafalgar Ln Beaverton, OR | 3.0 | 2.0 | 1156 | $1,945 | $1.68 | 43d | 1 | 0.68mi |
| 10664 NE Holly St Hillsboro, OR | 2.0 | 2.0 | 960 | $2,000 | $2.08 | 23d | 1 | 0.72mi |
| 10667 NE Heritage Pkwy Hillsboro, OR | 1.0–3.0 | 1.0–2.0 | 914 | $2,332 | $2.55 | 2d | 13 | 0.74mi |
| 20849 SW Longacre St Beaverton, OR | 3.0 | 2.0 | 1160 | $2,399 | $2.07 | 43d | 1 | 0.74mi |
| 10834 NE Holly St Hillsboro, OR | 2.0 | 2.0 | 966 | $1,995 | $2.07 | 12d | 1 | 0.76mi |
| 965 NE Wheelock Pl Beaverton, OR | 2.0 | 2.5 | 1227 | $2,395 | $1.95 | 43d | 1 | 0.76mi |
| 421 NE 80th Ave Hillsboro, OR | 1.0–2.0 | 1.0–2.0 | 842 | $1,899 | $2.25 | 1d | 19 | 0.77mi |
| 131 NE 79th Ave Beaverton, OR | 2.0 | 3.0 | 1488 | $2,300 | $1.55 | 43d | 1 | 0.78mi |
Listing history 1 events
-
2026-05-07$50,000 Active 1715-char remark
ⓘ Source: listings_history table (triggers on properties + properties_extension) + one-shot
backfill from property_details.listing_events for pre-trigger history.
Tax reassessment forecast OR · Resets to sale price
- Current annual tax
- $720 · $60/mo
- Projected year-2 tax
- $720 · $60/mo
- Expected delta
- $0/yr ($0/mo · 0.0%)
ⓘ Screening estimate from a state-policy table — verify with the county assessor before closing.
Climate risk First Street
- Flood 1/10 Low FEMA zone X (unshaded) · 0% chance over 30 yrs
- Wildfire 1/10 Low
- Heat 3/10 Moderate 7 d/yr ≥92°F today · 14 d/yr by 30 yrs out
- Wind 1/10 Low
- Air quality 8/10 Severe 11 unhealthy d/yr today · 11 by 30 yrs out
Nearby sold comps map
Loading sold comps map…
Walkable amenities ~0.75 mi
Loading nearby amenities…
Taxation est. · year 1
- Rental income
- $28,308
- − Mortgage interest
- −$2,801
- − Property taxes
- −$720
- − Insurance
- −$250
- − Repairs & maintenance
- −$2,265
- − Management
- −$2,265
- − Depreciation
- −$1,455
- Taxable income
- $18,554
- Est. tax owed @ 24.0%
- −$4,453
- After-tax cash flow
- $13,794/yr
For passive investors: Depreciation is non-cash, so a rental often shows a tax loss while cash-flowing — sheltering income. Rental losses are passive: they offset passive income freely, and up to $25,000/yr can offset ordinary (W-2) income if you actively participate and your MAGI is under $100k (phasing out to $0 by $150k); unused losses carry forward. On sale, claimed depreciation is recaptured at up to 25%, and gains may owe capital-gains tax (a 1031 exchange can defer both). Figures are a year-1 estimate at your 24.0% rate — not tax advice; consult a CPA.
Schools (NCES district)
- District
- Hillsboro SD 1J
- NCES district ID
- 4100023
- Math proficiency
- 35% ▼ -4.00%
- Reading proficiency
- 46% ▼ -7.00%
- Median HH income
- $68,587
- Composite
- 36.64/100
- National rank
- #4617
- State rank
- #13 of 58 in OR
Livability — Hillsboro
- Score
- 87/100
- State rank
- #13
- US rank
- #282
Category grades
Schools grade is shown separately in the Schools card above.
Census & demographics
- County
- Washington County · 583,254 people
- City population
- 102,767
- Metro
- Portland-Vancouver-Hillsboro, OR-WA
- Population (ZIP)
- 46,463
- Household income
- $104,790
- Rent vs Own
- Severe rent burden
- 2200.0
Population outlook (Washington County) Hauer SSP2
- Today (2025)
- 674,042 people
- By 2030
- 721,804 · +7.1%
- By 2040
- 812,732 · +20.6%
- By 2050
- 895,143 · +32.8%
- By 2075
- 1,058,806 · +57.1%
- By 2100
- 1,131,692 · +67.9%
Race, ethnicity, and origin ACS 2023
- Neighborhood character
- Diverse neighborhood (Simpson 0.66)
- Race & ethnicity
- White 52% Asian 21% Hispanic / Latino 16% Two or more races 12% Black 3%
- Hispanic origin (detail)
- Mexican 12%
- Common ancestry
- Italian 4% Portuguese 3% Lithuanian 3%
- Foreign-born
- 22% · Canada, China, Vietnam
- Languages at home
- 71% English-only · Spanish 8% Other Asian/Pacific 6% Other Indo-European 5%
Political lean MEDSL · Washington
- 2024 margin
- Solid D (+34.0) · D 65.3% · R 31.3% · Other 3.4%
- 2008→2024 swing
- +11.8pp toward D · 2008: 22.1pp · 2024: 34.0pp
- All cycles
- 2024: D+34.0 2020: D+34.6 2016: D+26.7 2012: D+17.5 2008: D+22.1
Not yet ingested
- Civics
- —
Market trends
- HPI YoY
- ▼ -344.27%
- Current HPI
- 304.041
- Rent YoY
- ▼ -1.58%
- Metro
- Portland-Vancouver-Hillsboro, OR-WA
- State GDP YoY
- ▲ 2.05%
- F500 in state
- 2
Industry mix (Fortune 500 HQ in OR)
| Industry | F500 HQs | Revenue |
|---|---|---|
| Consumer Goods | 1 | $51B |
|
||
Price history
-8.0% since first listed3 events — show timeline
- 2026-05-27 Sold (MLS) $46,000 RMLS
- 2026-05-22 Pending — RMLS
- 2026-05-07 Listed $50,000 RMLS
Property tax history
+2.9%/yrLatest (2025): $720 · +1.5% YoY. Source: county tax records.
Cash-flow waterfall
monthlySold comps — $/sqft
last 12 mo · ≤1 miLoading sold comps…