487 Capital Dr · Hellam, PA
Flood risk 5/10 · Moderate
- FEMA flood zone
- X (unshaded)
- Chance of flooding over 30 yrs
- 0.66%
- Est. flood insurance / yr
- $507 – $1,088
Fire risk 3/10 · Minor
- Est. fire insurance / yr
- $511 – $949
Heat risk 5/10 · Moderate
- Hot days now (above 101°F)
- 7 days/yr
- Hot days in 30 yrs
- 15 days/yr
Wind risk 4/10 · Minor
- Chance of severe wind over 30 yrs
- 10.0%
Air-quality risk 3/10 · Minor
- Unhealthy air days now
- 3 days/yr
- Unhealthy air days in 30 yrs
- 5 days/yr
Risk factors via First Street. Map © Google.
Why this score? — see what drove the D grade
The composite is a weighted blend of 9 inputs, each scored 0–100. Each bar is that input's sub-score; the figure is the points it added to the 100-point composite (weight × sub-score).
- Cash flow +15.0/30.0
- ARV discount +7.5/15.0
- 1% rule +5.0/10.0
- DSCR +5.0/10.0
- Schools +4.5/10.0
- Rent growth +2.5/5.0
- Livability +2.5/5.0
- Condition / age +2.5/5.0
- Appreciation +0.0/10.0
$34,900
🖨 Deal sheet 📄 Offer letter ✓ Due diligence
Listing remarks MLS
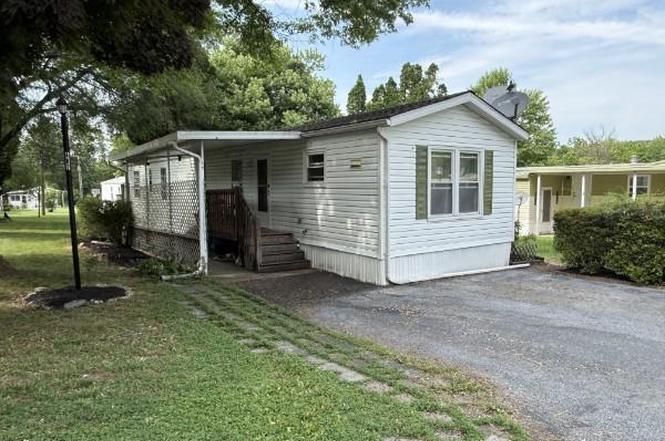
Welcome to this 14x66 Fleetwood which is move in ready located in Brookhaven Mobile Home Park. This home has three bedrooms and one bath and central air. This home has been nicely maintained and is move-in ready. The sellers are including the refrigerator stove and new dishwasher. There is a nice laundry room off of the kitchen as well. There is a nice covered patio and shed on the back of the property. This country setting park is very close to Route 30. All buyers must be park approved and adhere to the pet policy. The current lot rent is $568 a month which includes water sewer and snow removal.
Key facts
- Built-in cabinetry
- New ac furnace
- Large patio
Tags
Property features AI
Finance
- Other: Property manager present
- Financial info: Ground rent $670 per month (rented lot); Ownership interest: ground rent
Exterior
- Parking: Off-street parking
- Utilities: Public water; Public sewer; Electric service
- Home design: Manufactured home (single wide, Fleetwood); 14 ft wide by 66 ft long; Shingle roof; Above-grade finished living space
- Construction: Vinyl and aluminum siding
- Exterior features: Exterior lighting; Shed; Rented lot in Brookhaven MHP (ground rent paid monthly)
Interior
- Bedrooms: Three bedrooms on the main level
- Bathrooms: One full bathroom on the main level
- Heating & cooling: Forced air heating (natural gas); Central air conditioning (electric); Electric hot water
- Interior features: Paneled walls; No basement
Neighborhood map
What this means for you Summary
Snapshot
- This is a 3-bed/2.0-bath manufactured listed at $35k.
Deal economics
- At list price, monthly cash flow is $1k ($14k/yr) — positive.
- The deal already cash-flows at list — no discount required.
- Meets the 1% rule at list price ($2k rent vs $35k).
Location & tenants
- Location reads: area grade D — affects rentability + tenant quality, not the cash-flow math above.
- Eastern York SD (rural): math 40% / reading 64% proficiency, ranked #146 of 539 in PA (top 27%) — acceptable for families but not a draw, mixed tenant base, ~2y average lease.
- Market conditions: 174 active listings in the ZIP; solid renter incomes; 1,328 units permitted in York County in 2024 (338 in 5+ unit buildings).
Forward outlook
- Local home prices are declining (-3.0%/yr); year-one equity from $241 of loan paydown is wiped out by about $1k of value loss. Plan a longer hold.
- At projected returns (-3.0% appreciation + 3.0% rent growth), your $10k cash investment doubles in ~1 year — after that, you're playing with house money.
Negotiation context
- Only 8 days on market — expect competitive offers; lowballing is unlikely to land.
- 6 sale attempts since 21y ago; this cycle's ask has dropped $10k (22%) from the opening price — seller is motivated, your offer sets the floor, not the list.
Risks & watch-outs
- Climate carrying-cost: moderate flood risk; extreme-heat days projected 7→15/yr by 2055 (HVAC capex compounding) — expect insurance premiums to compound above CPI over the hold.
Questions for the listing agent
- Is there a deadline driving the sale (1031 exchange, divorce, estate, relocation)? That informs how much negotiation room exists.
- The area grade is low — what's the realistic commute time and amenity access for the typical tenant pool here? Any planned neighborhood developments (good or bad) we should know about?
- What's the average days-on-market for RENTAL listings here right now (not sales)? A rising rental-DOM trend means longer vacancies and softer asking-rent achievability than the comps imply.
- What's the recent tenant-quality profile in this submarket — average credit score on applications, eviction rate, late-payment / NSF rate, and stable-employment percentage? A property-management company in the area should have these aggregated.
- How much new for-sale + rental construction is in the pipeline within 1–3 miles? Heavy new supply typically softens prices + rents 12–24 months out; constrained supply supports both.
Investment metrics
- 1% rule
- 5.01% ✓
- Cap rate
- 44.99%
- Cash-on-cash
- 138.22%
- DSCR
- 7.15
- GRM
- 1.7
CMA / ARV
- ARV (on-the-fly)
- $13,860
- Comps found
- 1
Show comp detail 1 sale within ~0.75 mi
| Address | Dist | Beds/Ba | Sqft | Sold | Price | $/sf | Match |
|---|---|---|---|---|---|---|---|
| 104 Concord Ave | 0.15mi | 3/1.0 | 828 (-10%) | 22mo | $12,800 | $15 | 54 |
Match score weights: distance 35% · size 25% · config 20% · recency 20%. Top-matched comps best support the ARV.
Projected returns pro-forma
-3.0% appreciation · 3.0% rent growth · sell at horizon
- IRR
- —
- Equity multiple
- 7.76×
- Total profit
- $66,068
- Equity at exit
- $5,204
- IRR
- —
- Equity multiple
- 16.35×
- Total profit
- $149,985
- Equity at exit
- $3,018
Cash invested: $9,772 (down + closing). Projections, not guarantees.
Landlord ↔ Tenant lean methodology
- Overall (STATE)
- 62 Landlord-Friendly
- State Pennsylvania
- 62 Landlord-Friendly · EVEN
- County
- — inherits STATE
- City
- — inherits STATE
ZIP-level market 17406
- Home prices YoY
- -27.4%
- Active inventory
- 174
- Price-to-rent
- 1.7×
Monthly cashflow live
- Estimated rent
- $1,749 medium interval (Pro) →
- Mortgage (P&I)
- −$183
- Tax from tax record
- −$59 /mo · $706/yr
- Insurance
- −$15
- HOA
- −$0
- Vacancy / Maint / Mgmt
- −$367
- Net cashflow
- $1,126
Break-even live
UW: 25.0% down · 7.5% · 30yr · 1.5% tax · 5.0% vac · 8.0% maint · 8.0% mgmt
Financing live
Cash to close
- Down payment
- $8,725
- Closing costs
- $1,047
- Reserves months
- —
- Total cash needed
- —
Loan-product check · same deal, 3 products live
Conventional
25% down · 7.5% · 30yr
- Down + closing
- —
- Monthly P&I
- —
- Monthly cashflow
- —
- DSCR
- —
- Eligible?
- —
Personal DTI + credit; lowest rate.
DSCR
20% down · 8.5% · 30yr
- Down + closing
- —
- Monthly P&I
- —
- Monthly cashflow
- —
- DSCR
- —
- Eligible?
- —
No personal income docs; deal must DSCR.
Hard money
10% down · 12.0% · 12mo
- Down + closing
- —
- Monthly P&I
- —
- Monthly cashflow
- —
- DSCR
- —
- Eligible?
- —
Short-term bridge; refi at stabilization.
Listing history 7 events
-
2026-06-18days on market $34,900 Coming Soon 8 DOM
-
2026-06-17days on market $34,900 Coming Soon 7 DOM
-
2026-06-16days on market $34,900 Coming Soon 6 DOM
-
2026-06-15days on market $34,900 Coming Soon 5 DOM
-
2026-06-14days on market $34,900 Coming Soon 3 DOM
-
2026-06-13remarks 699-char remark
-
2026-06-13$34,900 Coming Soon 2 DOM
ⓘ Source: listings_history table (triggers on properties + properties_extension) + one-shot
backfill from property_details.listing_events for pre-trigger history.
Tax reassessment forecast PA · Partial reset (capped growth)
- Current annual tax
- $706 · $59/mo
- Projected year-2 tax
- $706 · $59/mo
- Expected delta
- $0/yr ($0/mo · 0.0%)
ⓘ Screening estimate from a state-policy table — verify with the county assessor before closing.
Climate risk First Street
- Flood 5/10 Major FEMA zone X (unshaded) · 66% chance over 30 yrs
- Wildfire 3/10 Moderate
- Heat 5/10 Major 7 d/yr ≥101°F today · 15 d/yr by 30 yrs out
- Wind 4/10 Moderate 10% chance of damaging wind over 30 yrs
- Air quality 3/10 Moderate 3 unhealthy d/yr today · 5 by 30 yrs out
Nearby sold comps map
Loading sold comps map…
Walkable amenities ~0.75 mi
Loading nearby amenities…
Taxation est. · year 1
- Rental income
- $20,992
- − Mortgage interest
- −$1,955
- − Property taxes
- −$706
- − Insurance
- −$174
- − Repairs & maintenance
- −$1,679
- − Management
- −$1,679
- − Depreciation
- −$1,015
- Taxable income
- $13,782
- Est. tax owed @ 24.0%
- −$3,308
- After-tax cash flow
- $10,199/yr
For passive investors: Depreciation is non-cash, so a rental often shows a tax loss while cash-flowing — sheltering income. Rental losses are passive: they offset passive income freely, and up to $25,000/yr can offset ordinary (W-2) income if you actively participate and your MAGI is under $100k (phasing out to $0 by $150k); unused losses carry forward. On sale, claimed depreciation is recaptured at up to 25%, and gains may owe capital-gains tax (a 1031 exchange can defer both). Figures are a year-1 estimate at your 24.0% rate — not tax advice; consult a CPA.
Schools (NCES district)
- District
- Eastern York SD
- NCES district ID
- 4208790
- Math proficiency
- 40% ▼ -18.00%
- Reading proficiency
- 64% ▼ -11.00%
- Median HH income
- $56,178
- Composite
- 44.94/100
- National rank
- #2712
- State rank
- #146 of 539 in PA
Livability — Hellam
No livability data for this city. (Only ~50 U.S. cities are tracked.)
Census & demographics
- County
- York County · 278,806 people
- Metro
- York-Hanover, PA
- Population (ZIP)
- 23,636
- Household income
- $83,521
- Rent vs Own
- Severe rent burden
- 296.0
Population outlook (York County) Hauer SSP2
- Today (2025)
- 454,205 people
- By 2030
- 457,407 · +0.7%
- By 2040
- 457,529 · +0.7%
- By 2050
- 448,261 · -1.3%
- By 2075
- 427,388 · -5.9%
- By 2100
- 384,218 · -15.4%
Race, ethnicity, and origin ACS 2023
- Neighborhood character
- Predominantly White (84%)
- Race & ethnicity
- White 84% Two or more races 6% Black 5% Hispanic / Latino 4%
- Common ancestry
- Romanian 3% Lithuanian 2% Slovak 2%
- Foreign-born
- 3% · Canada
- Languages at home
- 95% English-only · Spanish 2% Russian/Polish/Slavic 1% Arabic 1%
Political lean MEDSL · York
- 2024 margin
- Strong R (+25.3) · D 36.9% · R 62.1%
- 2008→2024 swing
- -11.7pp toward R · 2008: -13.6pp · 2024: -25.3pp
- All cycles
- 2024: R+25.3 2020: R+24.6 2016: R+29.3 2012: R+21.2 2008: R+13.6
Not yet ingested
- Civics
- —
Market trends
- HPI YoY
- ▼ -92.81%
- Current HPI
- 245.4821
- Rent YoY
- —
- Metro
- York-Hanover, PA
- State GDP YoY
- ▲ 1.68%
- F500 in state
- 34
Industry mix (Fortune 500 HQ in PA)
| Industry | F500 HQs | Revenue |
|---|---|---|
| Healthcare | 2 | $309B |
|
||
| Insurance | 2 | $27B |
|
||
| Telecommunications / Media | 1 | $124B |
|
||
| Industrial Distribution | 1 | $22B |
|
||
| Financial Services | 1 | $20B |
|
||
| Chemicals / Materials | 1 | $18B |
|
||
Price history
+52.4% since first listed21 events — show timeline
- 2026-06-10 Coming Soon $34,900 BRIGHT MLS
- 2022-11-30 Sold (MLS) $35,000 BRIGHT MLS
- 2022-11-11 Pending — BRIGHT MLS
- 2022-11-01 Price Changed $34,999 BRIGHT MLS
- 2022-10-25 Relisted — BRIGHT MLS
- 2022-10-11 Pending — BRIGHT MLS
- 2022-10-08 Price Changed $35,000 BRIGHT MLS
- 2022-09-27 Listed $45,000 BRIGHT MLS
- 2021-08-26 Sold (MLS) $30,000 BRIGHT MLS
- 2021-07-28 Contingent — BRIGHT MLS
- 2021-07-01 Listed $34,900 BRIGHT MLS
- 2021-05-20 Sold (MLS) $27,000 BRIGHT MLS
- 2021-05-19 Pending — BRIGHT MLS
- 2021-05-05 Contingent — BRIGHT MLS
- 2021-05-03 Listed $27,000 BRIGHT MLS
- 2007-09-28 Sold (MLS) $24,900 BRIGHT MLS
- 2007-08-30 Listing Removed — BRIGHT MLS
- 2007-08-22 Listed $24,900 BRIGHT MLS
- 2006-05-12 Sold (MLS) $20,000 BRIGHT MLS
- 2006-03-20 Listing Removed — BRIGHT MLS
- 2005-11-11 Listed $22,900 BRIGHT MLS
Property tax history
+3.4%/yrLatest (2026): $706 · +7.3% YoY. Source: county tax records.
Cash-flow waterfall
monthlySold comps — $/sqft
last 12 mo · ≤1 miLoading sold comps…