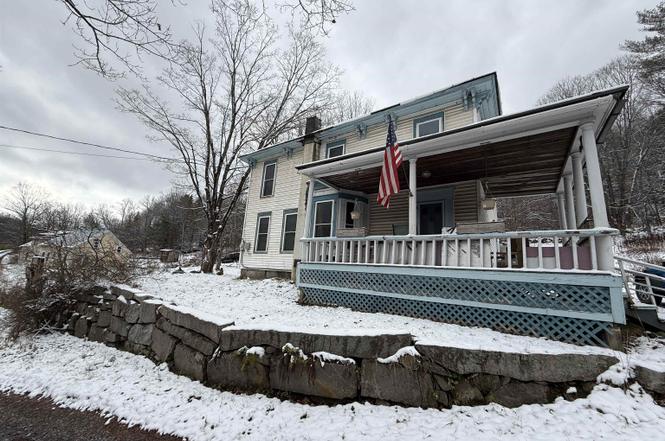
511 VT Route 25 · Topsham, VT
Flood risk 1/10 · Minimal
- FEMA flood zone
- X
- Chance of flooding over 30 yrs
- 0.0%
- Est. flood insurance / yr
- $473 – $860
Fire risk 1/10 · Minimal
- Est. fire insurance / yr
- $480 – $892
Heat risk 1/10 · Minimal
- Hot days now (above 87°F)
- 7 days/yr
- Hot days in 30 yrs
- 15 days/yr
Wind risk 2/10 · Minimal
- Chance of severe wind over 30 yrs
- 4.0%
Air-quality risk 2/10 · Minimal
- Unhealthy air days now
- 0 days/yr
- Unhealthy air days in 30 yrs
- 1 days/yr
Risk factors via First Street. Map © Google.
Why this score? — see what drove the D grade
The composite is a weighted blend of 9 inputs, each scored 0–100. Each bar is that input's sub-score; the figure is the points it added to the 100-point composite (weight × sub-score).
- Cash flow +10.6/30.0
- ARV discount +7.5/15.0
- Appreciation +6.0/10.0
- Schools +5.0/10.0
- DSCR +3.0/10.0
- 1% rule +2.5/10.0
- Rent growth +2.5/5.0
- Livability +2.5/5.0
- Condition / age +2.5/5.0
$199,000
🖨 Deal sheet (PDF) 📄 Offer letter ✓ Due diligence
Listing remarks
A rare in-town fixer-upper with incredible potential, this 4-bedroom, 2-bath home sits on 4 acres just minutes from Barre and Montpelier. Filled with character, the property features original hardwood floors, a woodstove, pellet stove, and a charming tin ceiling in the kitchen waiting to be restored to its former beauty. The covered front porch adds classic New Englander appeal, while the attached barn/garage provides excellent storage or workshop space. Conveying in as-is condition, this estate property is ideal for investors, rehabbers, or a handy homeowner looking to build sweat equity. With its generous acreage, convenient location, and solid historic bones, this home is ready to be bro
Key facts
- Covered front porch
- Tin ceiling
- Attached barn garage
Tags
Property features AI
Exterior
- Parking: 1-car garage
- Utilities: Drilled well water; Septic system; 100 Amp electrical service; DSL internet available; Other utilities listed
- Home design: New Englander style; Existing structure; Built in 1930; Standing seam metal roof
- Construction: Wood frame construction; Concrete foundation
- Exterior features: Hilly lot; In-town location; Rural setting; Circular driveway with right-of-way access; Public road frontage (approx. 100')
Interior
- Kitchen: Gas range; Refrigerator; Freezer; Dishwasher not listed
- Flooring: Hardwood; Vinyl
- Bathrooms: 2 full bathrooms
- Heating & cooling: Oil heat; Pellet stove; Wood heat
- Interior features: 7 rooms; Concrete unfinished basement with interior access
- Laundry & utility: Washer; Dryer
Neighborhood map
What this means for you Summary
Snapshot
- This is a 4-bed/2.0-bath other listed at $199k.
Deal economics
- At list price, monthly cash flow is $-99 ($-1k/yr) — negative.
- To cash-flow at today's rent, offer at most $181k (8.8% below list).
- To meet the 1% rule (rent ≥ 1% of price), the offer needs to be $150k (24.8% below list).
- Recommended offer: $150k (24.8% below list) — sets the bar for 1% rule.
Location & tenants
- Location reads: area grade D — affects rentability + tenant quality, not the cash-flow math above.
- Zoned schools: Waits River Valley Union School (math 32% / reading 47%, grade F, #96 of 192 statewide, top 57%, 263 students, 38% FRL).
- Market conditions: 11 active listings in the ZIP; 74 units permitted in Orange County in 2024 (28 in 5+ unit buildings).
Forward outlook
- In year one you build about $5k of equity ($1k loan paydown + $4k appreciation (2.0% local appreciation)).
- Orange County population projected at -18% by 2050 — secular population decline; favor cash flow + early exit over multi-decade hold.
- By year 7, paydown + projected appreciation supports a ~$35k cash-out refi (75% LTV) — recoverable capital for the next deal without selling this one.
Negotiation context
- It's been on market 165 days — a 12% lower offer ($175k) is reasonable based on typical stale-listing flexibility.
- Current owner paid $130k; list at $199k implies a 54% gain — meaningful room to come down on a strong offer.
Risks & watch-outs
- Watch-outs: built in 1930 — expect roof / HVAC / electrical / plumbing capex.
Questions for the listing agent
- What do current leases actually rent for vs. the listed asking? Can we see a recent rent roll and the last 12 months of T-12 income?
- It's been on market 165 days. Have you received any prior offers? Is the seller open to a 25% concession, seller financing, or rate buy-down credit?
- Built in 1930 — when were the roof, HVAC, electrical panel, plumbing, and water heater last replaced?
- Why hasn't it sold? Are there any deal-killer items the seller is aware of (foundation, flood, title, zoning, code violations)?
- Is there a deadline driving the sale (1031 exchange, divorce, estate, relocation)? That informs how much negotiation room exists.
- The area grade is low — what's the realistic commute time and amenity access for the typical tenant pool here? Any planned neighborhood developments (good or bad) we should know about?
- What's the average days-on-market for RENTAL listings here right now (not sales)? A rising rental-DOM trend means longer vacancies and softer asking-rent achievability than the comps imply.
- What's the recent tenant-quality profile in this submarket — average credit score on applications, eviction rate, late-payment / NSF rate, and stable-employment percentage? A property-management company in the area should have these aggregated.
- How much new for-sale + rental construction is in the pipeline within 1–3 miles? Heavy new supply typically softens prices + rents 12–24 months out; constrained supply supports both.
Investment metrics
- 1% rule
- 0.75% ✗
- Cap rate
- 5.69%
- Cash-on-cash
- -2.14%
- DSCR
- 0.90
- GRM
- 11.1
CMA / ARV
No comps found within radius.
Projected returns pro-forma
2.03% appreciation · 3.0% rent growth · sell at horizon
- IRR
- 2.5%
- Equity multiple
- 1.14×
- Total profit
- $7,545
- Equity at exit
- $78,778
- IRR
- 6.4%
- Equity multiple
- 1.87×
- Total profit
- $48,748
- Equity at exit
- $113,662
Cash invested: $55,720 (down + closing). Projections, not guarantees.
Landlord ↔ Tenant lean methodology
- Overall (STATE)
- 41 Moderately Tenant-Leaning
- State Vermont
- 41 Moderately Tenant-Leaning · D+15
- County
- — inherits STATE
- City
- — inherits STATE
ZIP-level market 05076
- Home prices YoY
- 2.2%
- Active inventory
- 11
- Price-to-rent
- 11.1×
Monthly cashflow live
- Estimated rent
- $1,497 medium interval (Pro) →
- Mortgage (P&I)
- −$1,044
- Tax from tax record
- −$156 /mo · $1,869/yr
- Insurance
- −$83
- HOA
- −$0
- Vacancy / Maint / Mgmt
- −$314
- Net cashflow
- $-99
Break-even live
Sensitivity live
| Price | -10% $13 | -5% $-43 | +0% $-99 | +5% $-156 | +10% $-212 |
|---|---|---|---|---|---|
| Rent | -10% $-218 | -5% $-159 | +0% $-99 | +5% $-40 | +10% $19 |
| Rate | -1.0pp $1 | -0.5pp $-49 | base $-99 | +0.5pp $-151 | +1.0pp $-203 |
UW: 25.0% down · 7.5% · 30yr · 1.5% tax · 5.0% vac · 8.0% maint · 8.0% mgmt
Financing live
Cash to close
- Down payment
- $49,750
- Closing costs
- $5,970
- Reserves months
- —
- Total cash needed
- —
Loan-product check · same deal, 3 products live
Conventional
25% down · 7.5% · 30yr
- Down + closing
- —
- Monthly P&I
- —
- Monthly cashflow
- —
- DSCR
- —
- Eligible?
- —
Personal DTI + credit; lowest rate.
DSCR
20% down · 8.5% · 30yr
- Down + closing
- —
- Monthly P&I
- —
- Monthly cashflow
- —
- DSCR
- —
- Eligible?
- —
No personal income docs; deal must DSCR.
Hard money
10% down · 12.0% · 12mo
- Down + closing
- —
- Monthly P&I
- —
- Monthly cashflow
- —
- DSCR
- —
- Eligible?
- —
Short-term bridge; refi at stabilization.
Listing history 19 events
-
2026-06-21days on market $199,000 Active 165 DOM
-
2026-06-19days on market $199,000 Active 163 DOM
-
2026-06-18days on market $199,000 Active 162 DOM
-
2026-06-17days on market $199,000 Active 161 DOM
-
2026-06-16days on market $199,000 Active 160 DOM
-
2026-06-15days on market $199,000 Active 159 DOM
-
2026-06-14days on market $199,000 Active 157 DOM
-
2026-06-12days on market $199,000 Active 156 DOM
-
2026-06-09days on market $199,000 Active 153 DOM
-
2026-06-08days on market $199,000 Active 152 DOM
-
2026-06-07days on market $199,000 Active 151 DOM
-
2026-06-07days on market $199,000 Active 150 DOM
-
2026-06-04days on market $199,000 Active 147 DOM
-
2026-06-02days on market $199,000 Active 146 DOM
-
2026-06-01days on market $199,000 Active 145 DOM
-
2026-05-31days on market $199,000 Active 144 DOM
-
2026-05-31days on market $199,000 Active 143 DOM
-
2026-01-07$199,000 Active
-
2018-08-16soldstatus $129,500
ⓘ Source: listings_history table (triggers on properties + properties_extension) + one-shot
backfill from property_details.listing_events for pre-trigger history.
Tax reassessment forecast VT · Partial reset (capped growth)
- Current annual tax
- $1,869 · $156/mo
- Projected year-2 tax
- $2,825 · $235/mo
- Expected delta
- +$956/yr (+$80/mo · 51.1%)
ⓘ Screening estimate from a state-policy table — verify with the county assessor before closing.
Climate risk First Street
- Flood 1/10 Low FEMA zone X · 0% chance over 30 yrs
- Wildfire 1/10 Low
- Heat 1/10 Low 7 d/yr ≥87°F today · 15 d/yr by 30 yrs out
- Wind 2/10 Low 4% chance of damaging wind over 30 yrs
- Air quality 2/10 Low 0 unhealthy d/yr today · 1 by 30 yrs out
Nearby sold comps map
Loading sold comps map…
Walkable amenities ~0.75 mi
Loading nearby amenities…
Taxation est. · year 1
- Rental income
- $17,967
- − Mortgage interest
- −$11,147
- − Property taxes
- −$1,869
- − Insurance
- −$995
- − Repairs & maintenance
- −$1,437
- − Management
- −$1,437
- − Depreciation
- −$5,789
- Taxable loss
- −$4,708
- Est. tax savings @ 24.0%
- +$1,130
- After-tax cash flow
- $-63/yr
For passive investors: Depreciation is non-cash, so a rental often shows a tax loss while cash-flowing — sheltering income. Rental losses are passive: they offset passive income freely, and up to $25,000/yr can offset ordinary (W-2) income if you actively participate and your MAGI is under $100k (phasing out to $0 by $150k); unused losses carry forward. On sale, claimed depreciation is recaptured at up to 25%, and gains may owe capital-gains tax (a 1031 exchange can defer both). Figures are a year-1 estimate at your 24.0% rate — not tax advice; consult a CPA.
Schools (NCES district)
No district data.
Livability — Topsham
No livability data for this city. (Only ~50 U.S. cities are tracked.)
Census & demographics
- Population (ZIP)
- 531
Population outlook (Orange County) Hauer SSP2
- Today (2025)
- 28,186 people
- By 2030
- 27,359 · -2.9%
- By 2040
- 25,221 · -10.5%
- By 2050
- 23,023 · -18.3%
- By 2075
- 18,621 · -33.9%
- By 2100
- 14,477 · -48.6%
Race, ethnicity, and origin ACS 2023
- Neighborhood character
- Predominantly White (96%)
- Race & ethnicity
- White 96% Two or more races 3%
- Common ancestry
- Slovak 7% Lithuanian 5% Scotch-Irish 1%
- Foreign-born
- 1%
Political lean MEDSL · Orange
- 2024 margin
- Strong D (+20.2) · D 58.3% · R 38.1% · Other 3.6%
- 2008→2024 swing
- -11.1pp toward R · 2008: 31.3pp · 2024: 20.2pp
- All cycles
- 2024: D+20.2 2020: D+24.1 2016: D+18.8 2012: D+32.1 2008: D+31.3
Not yet ingested
- Civics
- —
Market trends
- HPI YoY
- ▲ 2.03%
- Current HPI
- 94.3347
- Rent YoY
- —
- Metro
- —
- State GDP YoY
- —
- F500 in state
- 0
Price history
+53.7% since first listed2 events — show timeline
- 2026-01-07 Listed $199,000 PrimeMLS
- 2018-08-16 Sold (Public Records) $129,500 Public Records
Property tax history
+16.7%/yrLatest (2024): $1,869 · -0.3% YoY. Source: county tax records.
Cash-flow waterfall
monthlySold comps — $/sqft
last 12 mo · ≤1 miLoading sold comps…