 Multi-family
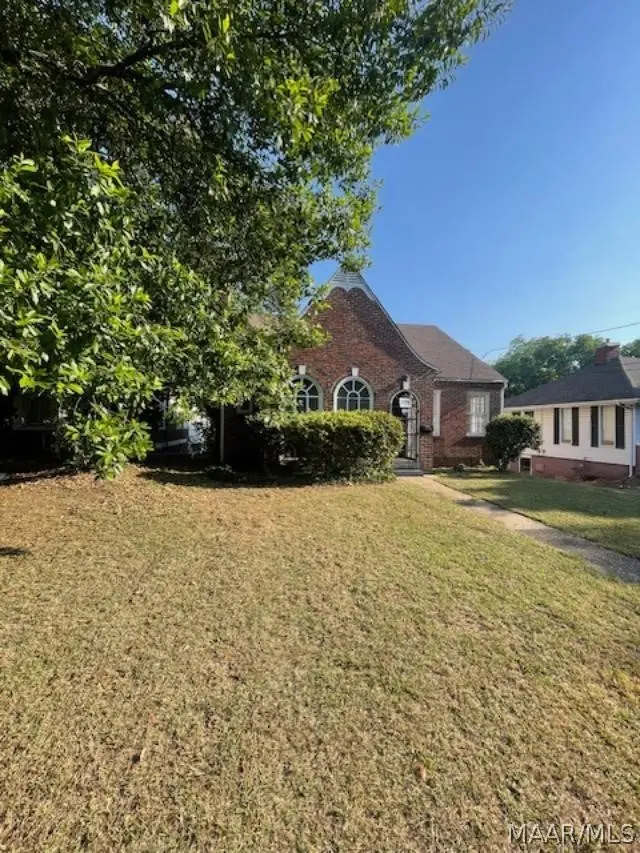
1721 Madison Ave · Montgomery, AL
Flood risk 5/10 · Moderate
- FEMA flood zone
- X (unshaded)
- Chance of flooding over 30 yrs
- 0.24%
- Est. flood insurance / yr
- $473 – $860
Fire risk 1/10 · Minimal
- Est. fire insurance / yr
- $916 – $1,700
Heat risk 7/10 · Major
- Hot days now (above 107°F)
- 7 days/yr
- Hot days in 30 yrs
- 18 days/yr
Wind risk 8/10 · Major
- Chance of severe wind over 30 yrs
- 80.0%
Air-quality risk 3/10 · Minor
- Unhealthy air days now
- 4 days/yr
- Unhealthy air days in 30 yrs
- 4 days/yr
Risk factors via First Street. Map © Google.
Why this score? — see what drove the B- grade
The composite is a weighted blend of 9 inputs, each scored 0–100. Each bar is that input's sub-score; the figure is the points it added to the 100-point composite (weight × sub-score).
- Cash flow +30.0/30.0
- 1% rule +10.0/10.0
- DSCR +10.0/10.0
- ARV discount +7.5/15.0
- Livability +3.2/5.0
- Rent growth +2.5/5.0
- Condition / age +2.5/5.0
- Schools +1.7/10.0
- Appreciation +0.0/10.0
$89,900
🖨 Deal sheet (PDF) 📄 Offer letter ✓ Due diligence
Multi-family units
County records classify this as Multi-Family (2-4 Unit). Listing-text estimate: 1 unit. estimate disagrees with records
Listing remarks
WONDERFUL DUPLEX IN THE HEART OF CAPITOL HEIGHTS!!!!!!5TH BEDROOM ONE DUPLEX HAS TWO BEDROOM AND TWO BATH THE OTHER DUPLEX HAS ONE BEDROOM AND ONE BATH. THIS IS A GREAT INVESTMENT PROPERTY.
Key facts
- Parking
- Built 1935
- Listed 14 days
Property features AI
Exterior
- Parking: Driveway
- Utilities: Public water; Public sewer; Cable available; Natural gas available
- Home design: Brick construction; Single-story building; Slab foundation; Lot dimensions approximately 50 x 150
- Construction: Brick exterior; Built (year per public records)
- Exterior features: Partial fencing; City lot
Interior
- Kitchen: Kitchen on the second level
- Bedrooms: Bedroom on the second level; Bedroom on the third level
- Flooring: Carpet; Tile
- Bathrooms: 3 full bathrooms
- Heating & cooling: Central heating (gas); Central air conditioning; Attic fan; Electric cooling
- Interior features: Carpet flooring; Tile flooring; Gas water heater
- Laundry & utility: Laundry room on the second level
Neighborhood map
What this means for you Summary
Snapshot
- This is a 3-bed/2.0-bath multifamily listed at $90k.
Deal economics
- At list price, monthly cash flow is $892 ($11k/yr) — positive.
- The deal already cash-flows at list — no discount required.
- Meets the 1% rule at list price ($2k rent vs $90k).
- Cap rate 18.2% vs local median 6.0% in Montgomery — top-decile yield for the area; either an underpriced asset or a hidden risk that comps aren't pricing in. Stress-test before assuming the spread holds.
Location & tenants
- Location reads 65/100 on livability (#138 in AL) — a middle-class / working-renter tenant base. Strengths: cost of living A+, housing A+; Watch: schools C-, employment D, crime F.
- Montgomery County (urban): math 9% / reading 31% proficiency, ranked #106 of 129 in AL (top 82%) — low school quality limits family demand, transient renter base, plan for 1-2y turnover; 70% free/reduced lunch — lower-income household profile, screen leases tightly.
- Market conditions: 53 active listings in the ZIP; 40 comparable units currently listed for rent nearby; rentals lingering (median 45d on market — plan ~5-8 weeks vacancy on turnover, expect pricing pressure); 62% of comp listings sitting > 30 days — soft ceiling on asking rent; lower-income renter base — watch delinquency; 460 units permitted in Montgomery County in 2024 (37 in 5+ unit buildings).
- At $1,859/mo this rent would consume 66% of the median local household income ($34k/yr) (locally 641% of renters already pay >50% of income on rent) — very limited rent-growth headroom before tenants either downsize or default.
Forward outlook
- Local home prices are declining (-3.0%/yr); year-one equity from $622 of loan paydown is wiped out by about $3k of value loss. Plan a longer hold.
- Montgomery County population projected to shrink 8% by 2050 — rents likely to lag national; underwrite the cash flow, not the appreciation.
- At projected returns (-3.0% appreciation + 3.0% rent growth), your $25k cash investment doubles in ~3 years — after that, you're playing with house money.
Negotiation context
- Only 14 days on market — expect competitive offers; lowballing is unlikely to land.
- 3 sale attempts since 27y ago with the ask held roughly flat each time — persistent listings suggest the price (not the market) is what's stuck; bring a comps-based counter.
Risks & watch-outs
- Watch-outs: built in 1935 — expect roof / HVAC / electrical / plumbing capex.
- Climate carrying-cost: moderate flood risk; severe wind risk, 80% chance of damaging wind over 30y; extreme-heat days projected 7→18/yr by 2055 (HVAC capex compounding) — expect insurance premiums to compound above CPI over the hold.
Questions for the listing agent
- Built in 1935 — when were the roof, HVAC, electrical panel, plumbing, and water heater last replaced?
- Is there a deadline driving the sale (1031 exchange, divorce, estate, relocation)? That informs how much negotiation room exists.
- Crime grade is F in this area — have there been break-ins, vandalism, or insurance claims at this property in the last 3 years? What carrier currently insures it and at what premium?
- What's the average days-on-market for RENTAL listings here right now (not sales)? A rising rental-DOM trend means longer vacancies and softer asking-rent achievability than the comps imply.
- What's the recent tenant-quality profile in this submarket — average credit score on applications, eviction rate, late-payment / NSF rate, and stable-employment percentage? A property-management company in the area should have these aggregated.
- How much new apartment / multifamily construction is in the pipeline within 1–3 miles? Heavy new supply (>2% of stock underway) typically softens rents 12–24 months out; light construction supports rent growth.
Investment metrics
- 1% rule
- 2.07% ✓
- Cap rate
- 18.19%
- Cash-on-cash
- 42.51%
- DSCR
- 2.89
- GRM
- 4.0
CMA / ARV
- ARV (median comp)
- $265,000
- List price
- $89,900
- Delta
- -66.08%
- Verdict
- UNDERPRICED
- Comps
- 1 within 2.0 mi
Projected returns pro-forma
-3.0% appreciation · 3.0% rent growth · sell at horizon
- IRR
- 39.2%
- Equity multiple
- 2.68×
- Total profit
- $42,222
- Equity at exit
- $13,404
- IRR
- 45.6%
- Equity multiple
- 5.37×
- Total profit
- $109,895
- Equity at exit
- $7,773
Cash invested: $25,172 (down + closing). Projections, not guarantees.
Landlord ↔ Tenant lean methodology
- Overall (STATE)
- 90 Strongly Landlord-Friendly
- State Alabama
- 90 Strongly Landlord-Friendly · R+15
- County
- — inherits STATE
- City
- — inherits STATE
ZIP-level market 36104
- Active inventory
- 53
- Price-to-rent
- 7.8×
Monthly cashflow live
- Estimated rent
- $1,859 high interval (Pro) →
- Mortgage (P&I)
- −$471
- Tax from tax record
- −$68 /mo · $817/yr
- Insurance
- −$37
- HOA
- −$0
- Vacancy / Maint / Mgmt
- −$390
- Net cashflow
- $892
Break-even live
Sensitivity live
| Price | -10% $943 | -5% $917 | +0% $892 | +5% $866 | +10% $841 |
|---|---|---|---|---|---|
| Rent | -10% $745 | -5% $818 | +0% $892 | +5% $965 | +10% $1,039 |
| Rate | -1.0pp $937 | -0.5pp $915 | base $892 | +0.5pp $868 | +1.0pp $845 |
2-unit breakdown (identical units grouped — click to expand)
| Units | Beds | Baths | Est. rent |
|---|---|---|---|
| 1× unit | 2 | 1 | $956 |
| 1× unit | 1 | 1 | $903 |
| Total (2 units) | $1,859 | ||
UW: 25.0% down · 7.5% · 30yr · 1.5% tax · 5.0% vac · 8.0% maint · 8.0% mgmt
Financing live
Cash to close
- Down payment
- $22,475
- Closing costs
- $2,697
- Reserves months
- —
- Total cash needed
- —
Loan-product check · same deal, 3 products live
Conventional
25% down · 7.5% · 30yr
- Down + closing
- —
- Monthly P&I
- —
- Monthly cashflow
- —
- DSCR
- —
- Eligible?
- —
Personal DTI + credit; lowest rate.
DSCR
20% down · 8.5% · 30yr
- Down + closing
- —
- Monthly P&I
- —
- Monthly cashflow
- —
- DSCR
- —
- Eligible?
- —
No personal income docs; deal must DSCR.
Hard money
10% down · 12.0% · 12mo
- Down + closing
- —
- Monthly P&I
- —
- Monthly cashflow
- —
- DSCR
- —
- Eligible?
- —
Short-term bridge; refi at stabilization.
Rent comps 40 comps
| Address | Beds | Baths | Sqft | Rent | $/sqft | DOM | Units | Dist |
|---|---|---|---|---|---|---|---|---|
| 1827 Capitol Ave Montgomery, AL | 2.0 | 1.0 | 1068 | $1,600 | $1.50 | 44d | 1 | 0.16mi |
| 1827 Capitol Ave Montgomery, AL | 2.0 | 1.0 | 1068 | $1,600 | $1.50 | 14d | 1 | 0.16mi |
| 39 S Lewis St Montgomery, AL | 2.0 | 1.0 | 1209 | $950 | $0.79 | 44d | 1 | 0.18mi |
| 128 S Capitol Pkwy Montgomery, AL | 3.0 | 1.0 | 1550 | $1,500 | $0.97 | 44d | 1 | 0.25mi |
| 2004 Capitol Ave Unit 1043879P Montgomery, AL | 4.0 | 2.5 | 1797 | $3,518 | $1.96 | 14d | 1 | 0.31mi |
| 2009 Yancey Ave Montgomery, AL | 3.0 | 1.0 | 1140 | $1,080 | $0.95 | 21d | 1 | 0.35mi |
| 508 Glenmore Rd Montgomery, AL | 2.0 | 1.0 | 1135 | $1,000 | $0.88 | 44d | 1 | 0.39mi |
| 517 N Florida St Unit B Montgomery, AL | 2.0 | 1.0 | 900 | $750 | $0.83 | 44d | 1 | 0.44mi |
| 2023 Windsor Ave Montgomery, AL | 2.0 | 1.0 | 889 | $895 | $1.01 | 44d | 1 | 0.46mi |
| 2113 Brewton St Montgomery, AL | 3.0 | 1.0 | 1363 | $1,150 | $0.84 | 44d | 1 | 0.46mi |
| 2122 Windsor Ave Montgomery, AL | 2.0 | 1.0 | 1052 | $725 | $0.69 | 44d | 1 | 0.52mi |
| 2229 Madison Ave Montgomery, AL | 2.0 | 1.0 | 1100 | $625 | $0.57 | 44d | 1 | 0.52mi |
| 2009 Palmetto St Montgomery, AL | 3.0 | 1.0 | 1487 | $1,050 | $0.71 | 44d | 1 | 0.53mi |
| 2243 Winona Ave Montgomery, AL | 3.0 | 1.0 | 1492 | $1,225 | $0.82 | 21d | 1 | 0.56mi |
| 2310 Yancey Ave Montgomery, AL | 3.0 | 1.0 | 1212 | $1,250 | $1.03 | 44d | 1 | 0.62mi |
| 1008 Pelham St Montgomery, AL | 4.0 | 2.0 | 1288 | $1,300 | $1.01 | 44d | 1 | 0.67mi |
| 2000 Cherry St Montgomery, AL | 2.0 | 1.0 | 1106 | $950 | $0.86 | 44d | 1 | 0.78mi |
| 7 Bradley Dr Montgomery, AL | 3.0 | 2.0 | 1529 | $1,500 | $0.98 | 14d | 1 | 0.92mi |
| 15 Bradley Dr Montgomery, AL | 3.0 | 2.0 | 1365 | $1,500 | $1.10 | 21d | 1 | 0.93mi |
| 18 Oak Forest Dr Montgomery, AL | 3.0 | 2.0 | 1580 | $1,050 | $0.66 | 21d | 1 | 0.96mi |
| 7 Calhoun Rd Unit B Montgomery, AL | 2.0 | 1.0 | 961 | $850 | $0.88 | 44d | 1 | 1.00mi |
| 2769 Pelzer Ave Montgomery, AL | 3.0 | 2.0 | 1608 | $1,325 | $0.82 | 44d | 1 | 1.01mi |
| 122 Oak Forest Dr Montgomery, AL | 3.0 | 1.0 | 1092 | $975 | $0.89 | 21d | 1 | 1.02mi |
| 2503 Skyline Ave Montgomery, AL | 3.0 | 1.0 | 1015 | $1,150 | $1.13 | 44d | 1 | 1.06mi |
| 311 Bradley Dr Montgomery, AL | 3.0 | 1.0 | 1104 | $825 | $0.75 | 44d | 1 | 1.06mi |
| 108 Calhoun Rd Unit 108B Montgomery, AL | 2.0 | 1.0 | 1350 | $750 | $0.56 | 44d | 1 | 1.09mi |
| 2814 Ashley Ave Montgomery, AL | 3.0 | 2.0 | 1683 | $1,350 | $0.80 | 14d | 1 | 1.15mi |
| 2001 Speigle St Montgomery, AL | 3.0 | 1.0 | 1260 | $1,035 | $0.82 | 44d | 1 | 1.21mi |
| 2822 Sumter Ave Montgomery, AL | 3.0 | 2.5 | 1617 | $1,300 | $0.80 | 21d | 1 | 1.25mi |
| 2020 E 3rd St Montgomery, AL | 2.0 | 1.0 | 1186 | $750 | $0.63 | 21d | 1 | 1.25mi |
| 1324 Federal Dr Montgomery, AL | 2.0 | 1.0 | 1000 | $1,100 | $1.10 | 44d | 1 | 1.30mi |
| 2454 Spruce Curv Montgomery, AL | 3.0 | 1.0 | 988 | $1,100 | $1.11 | 44d | 1 | 1.34mi |
| 401 Ridgewood Ln Montgomery, AL | 3.0 | 2.0 | 1513 | $1,195 | $0.79 | 21d | 1 | 1.35mi |
| 2205 E 5th St Montgomery, AL | 3.0 | 1.0 | 1020 | $800 | $0.78 | 44d | 1 | 1.38mi |
| 3319 Willow Lane Dr Montgomery, AL | 3.0 | 2.0 | 1032 | $1,200 | $1.16 | 44d | 1 | 1.40mi |
| 200 Eton Rd Montgomery, AL | 3.0 | 1.5 | 1500 | $895 | $0.60 | 14d | 1 | 1.44mi |
| 3329 Vermont Dr Montgomery, AL | 3.0 | 1.5 | 1465 | $1,395 | $0.95 | 14d | 1 | 1.44mi |
| 167 E Salem Dr Montgomery, AL | 3.0 | 2.0 | 1700 | $1,050 | $0.62 | 44d | 1 | 1.45mi |
| 3233 Hillcrest Ln Montgomery, AL | 3.0 | 2.0 | 1278 | $1,395 | $1.09 | 21d | 1 | 1.46mi |
| 2019 Amos St Montgomery, AL | 3.0 | 1.5 | 1134 | $985 | $0.87 | 44d | 1 | 1.47mi |
Listing history 5 events
-
2026-05-13status Pending 191-char remark
-
2026-04-28$89,900 Active 191-char remark
-
2026-02-24soldstatus $1,631,600
-
1999-05-21$99,900
-
1999-02-19$99,900
ⓘ Source: listings_history table (triggers on properties + properties_extension) + one-shot
backfill from property_details.listing_events for pre-trigger history.
Tax reassessment forecast AL · Resets to sale price
- Current annual tax
- $817 · $68/mo
- Projected year-2 tax
- $817 · $68/mo
- Expected delta
- $0/yr ($0/mo · 0.0%)
ⓘ Screening estimate from a state-policy table — verify with the county assessor before closing.
Climate risk First Street
- Flood 5/10 Major FEMA zone X (unshaded) · 24% chance over 30 yrs
- Wildfire 1/10 Low
- Heat 7/10 Severe 7 d/yr ≥107°F today · 18 d/yr by 30 yrs out
- Wind 8/10 Severe 80% chance of damaging wind over 30 yrs
- Air quality 3/10 Moderate 4 unhealthy d/yr today · 4 by 30 yrs out
Nearby sold comps map
Loading sold comps map…
Walkable amenities ~0.75 mi
Loading nearby amenities…
Taxation est. · year 1
- Rental income
- $22,308
- − Mortgage interest
- −$5,036
- − Property taxes
- −$817
- − Insurance
- −$450
- − Repairs & maintenance
- −$1,785
- − Management
- −$1,785
- − Depreciation
- −$2,615
- Taxable income
- $9,821
- Est. tax owed @ 24.0%
- −$2,357
- After-tax cash flow
- $8,343/yr
For passive investors: Depreciation is non-cash, so a rental often shows a tax loss while cash-flowing — sheltering income. Rental losses are passive: they offset passive income freely, and up to $25,000/yr can offset ordinary (W-2) income if you actively participate and your MAGI is under $100k (phasing out to $0 by $150k); unused losses carry forward. On sale, claimed depreciation is recaptured at up to 25%, and gains may owe capital-gains tax (a 1031 exchange can defer both). Figures are a year-1 estimate at your 24.0% rate — not tax advice; consult a CPA.
Schools (NCES district)
- District
- Montgomery County
- NCES district ID
- 0102430
- Math proficiency
- 9% ▼ -21.00%
- Reading proficiency
- 31% ▼ -1.00%
- Median HH income
- $43,902
- Composite
- 17.24/100
- National rank
- #9093
- State rank
- #106 of 129 in AL
Livability — Montgomery
- Score
- 65/100
- State rank
- #138
- US rank
- #13416
Category grades
Schools grade is shown separately in the Schools card above.
Census & demographics
- Census place
- Montgomery, AL
- County
- Montgomery County · 190,016 people
- City population
- 175,913
- Metro
- Montgomery, AL
- Population (ZIP)
- 10,535
- Household income
- $33,823
- Rent vs Own
- Severe rent burden
- 641.0
Population outlook (Montgomery County) Hauer SSP2
- Today (2025)
- 224,008 people
- By 2030
- 221,460 · -1.1%
- By 2040
- 214,179 · -4.4%
- By 2050
- 204,912 · -8.5%
- By 2075
- 177,821 · -20.6%
- By 2100
- 145,134 · -35.2%
Race, ethnicity, and origin ACS 2023
- Neighborhood character
- Predominantly Black (72%)
- Race & ethnicity
- Black 72% White 20% Two or more races 6% Hispanic / Latino 2%
- Common ancestry
- Swedish 2% Russian 1% Lithuanian 1%
- Foreign-born
- 2% · Canada
- Languages at home
- 97% English-only · Spanish 1% Other Indo-European 1%
Political lean MEDSL · Montgomery
- 2024 margin
- Solid D (+30.7) · D 64.8% · R 34.1% · Other 1.1%
- 2008→2024 swing
- +11.5pp toward D · 2008: 19.2pp · 2024: 30.7pp
- All cycles
- 2024: D+30.7 2020: D+31.5 2016: D+26.2 2012: D+24.3 2008: D+19.2
Not yet ingested
- Civics
- —
Market trends
- HPI YoY
- ▼ -101.13%
- Current HPI
- 27.2384
- Rent YoY
- —
- Metro
- Montgomery, AL
- State GDP YoY
- ▲ 2.94%
- F500 in state
- 4
Industry mix (Fortune 500 HQ in AL)
| Industry | F500 HQs | Revenue |
|---|---|---|
| Financial Services | 1 | $8B |
|
||
| Healthcare | 1 | $5B |
|
||
Price history
+17.1% since first listed6 events — show timeline
- 2026-06-10 Sold (MLS) $117,000 MAAR
- 2026-05-13 Pending — MAAR
- 2026-04-28 Listed $89,900 MAAR
- 2026-02-24 Sold (Public Records) $1,631,600 Public Records
- 1999-05-21 Listed $99,900 MAAR
- 1999-02-19 Listed $99,900 MAAR
Property tax history
+8.8%/yrLatest (2025): $817 · +0.7% YoY. Source: county tax records.
Cash-flow waterfall
monthlySold comps — $/sqft
last 12 mo · ≤1 miLoading sold comps…