 Multi-family
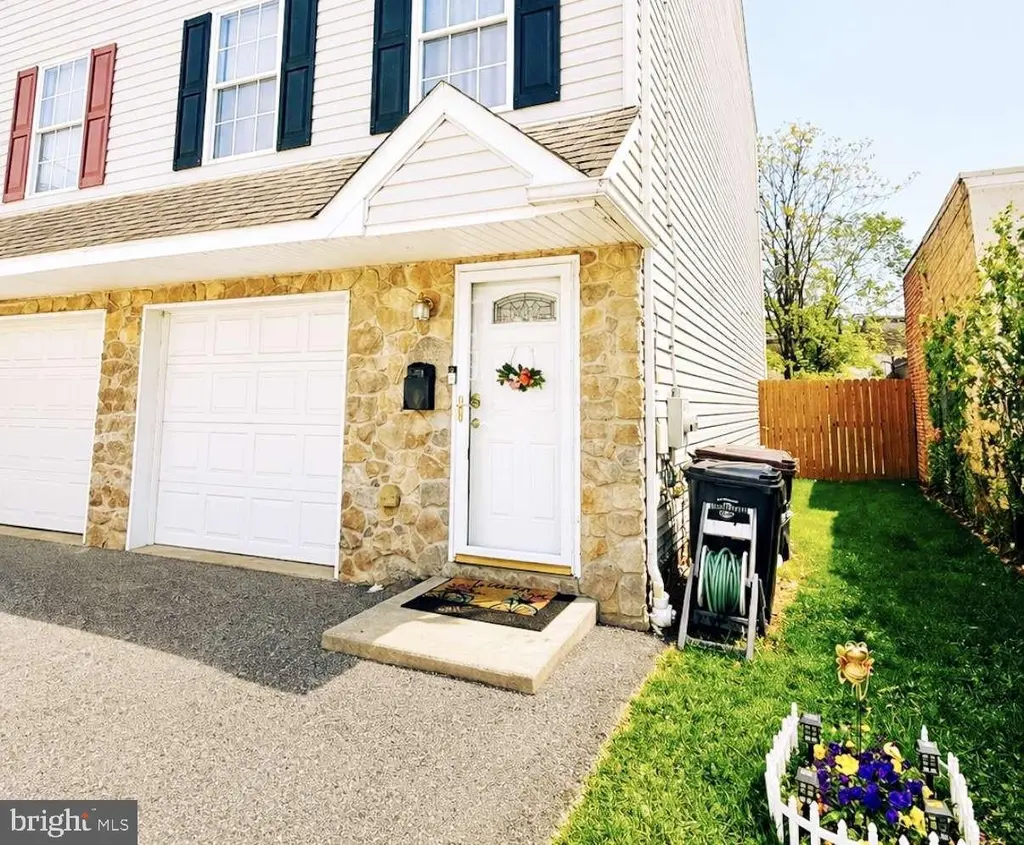
412 W Thirty Second St · Wilmington, DE
Flood risk 1/10 · Minimal
- FEMA flood zone
- X (unshaded)
- Chance of flooding over 30 yrs
- 0.0%
- Est. flood insurance / yr
- $473 – $860
Fire risk 1/10 · Minimal
- Est. fire insurance / yr
- $476 – $884
Heat risk 8/10 · Major
- Hot days now (above 103°F)
- 7 days/yr
- Hot days in 30 yrs
- 16 days/yr
Wind risk 6/10 · Moderate
- Chance of severe wind over 30 yrs
- 27.0%
Air-quality risk 3/10 · Minor
- Unhealthy air days now
- 2 days/yr
- Unhealthy air days in 30 yrs
- 3 days/yr
Risk factors via First Street. Map © Google.
Why this score? — see what drove the C- grade
The composite is a weighted blend of 9 inputs, each scored 0–100. Each bar is that input's sub-score; the figure is the points it added to the 100-point composite (weight × sub-score).
- Cash flow +26.1/30.0
- DSCR +8.8/10.0
- 1% rule +5.9/10.0
- Rent growth +3.9/5.0
- Livability +3.2/5.0
- Schools +3.1/10.0
- Condition / age +2.5/5.0
- ARV discount +0.0/15.0
- Appreciation +0.0/10.0
$299,900
🖨 Deal sheet 📄 Offer letter ✓ Due diligence
Multi-family units
County records classify this as Multi-Family (2-4 Unit). Listing-text estimate: 1 unit. estimate disagrees with records
Listing remarks MLS
Welcome to this spacious and move-in-ready 3-bedroom, 2.5-bath home in a convenient Wilmington location! This home offers a versatile layout with potential for a 4th bedroom on the lower level—perfect for guests, a home office, or additional living space. The main level features an open and bright living area, an eat-in kitchen with ample cabinet space and center island, and a convenient powder room—ideal for entertaining. Upstairs, enjoy a generous primary suite along with additional bedrooms and a full bath. Additional highlights include interior access to the garage, off-street parking, and a private rear yard for relaxing or entertaining. Recent upgrades include a high-efficiency heater, double-hung tilt-in windows, and a full appliance package. Ideally located near major routes, shopping, and dining, this home offers comfort, space, and value. Schedule your showing today!
Key facts
- Large eat-in kitchen
- Walk-out to backyard
- Finished lower level
Tags
Neighborhood map
What this means for you Summary
Snapshot
- This is a 3-bed/2.0-bath multifamily listed at $300k.
Deal economics
- At list price, monthly cash flow is $756 ($9k/yr) — positive.
- The deal already cash-flows at list — no discount required.
- Meets the 1% rule at list price ($3k rent vs $300k).
- Recommended offer: $295k (1.5% below list) — sets the bar for market timing.
- Cap rate 9.3% vs local median 5.6% in Wilmington — top-decile yield for the area; either an underpriced asset or a hidden risk that comps aren't pricing in. Stress-test before assuming the spread holds.
Location & tenants
- Location reads 64/100 on livability (#52 in DE) — a middle-class / working-renter tenant base. Strengths: cost of living A+, housing A; Watch: employment D+, schools D, commute D.
- Red Clay Consolidated School District (suburban): math 27% / reading 42% proficiency, ranked #12 of 26 in DE (top 46%) — families likely to look elsewhere, expect single-tenant / working-renter base with shorter leases.
- Market conditions: Rents rising fast (+5.7%/yr); 119 active listings in the ZIP; 40 comparable units currently listed for rent nearby; rentals at typical pace (median 24d on market — plan ~3-4 weeks tenant-placement turnaround); 1,367 units permitted in New Castle County in 2024 (201 in 5+ unit buildings).
- At $3,259/mo this rent would consume 73% of the median local household income ($54k/yr) (locally 1816% of renters already pay >50% of income on rent) — very limited rent-growth headroom before tenants either downsize or default.
Forward outlook
- Local home prices are declining (-3.0%/yr); year-one equity from $2k of loan paydown is wiped out by about $9k of value loss. Plan a longer hold.
- New Castle County population projected at +9% by 2050 — modest demand growth; plan on rents tracking national, not racing it.
- At projected returns (-3.0% appreciation + 5.7% rent growth), your $84k cash investment doubles in ~9 years — after that, you're playing with house money.
Negotiation context
- It's been on market 16 days — a 2% lower offer ($295k) is reasonable based on typical stale-listing flexibility.
- Current owner paid $25k; list at $300k implies a 1100% gain — meaningful room to come down on a strong offer.
Risks & watch-outs
- Climate carrying-cost: major wind risk, 27% chance of damaging wind over 30y; extreme-heat days projected 7→16/yr by 2055 (HVAC capex compounding) — expect insurance premiums to compound above CPI over the hold.
Questions for the listing agent
- Is there a deadline driving the sale (1031 exchange, divorce, estate, relocation)? That informs how much negotiation room exists.
- Schools are D-rated, which usually means shorter tenancies and higher turnover. Who's the typical renter profile here, and what's been the actual vacancy rate?
- Crime grade is F in this area — have there been break-ins, vandalism, or insurance claims at this property in the last 3 years? What carrier currently insures it and at what premium?
- What's the average days-on-market for RENTAL listings here right now (not sales)? A rising rental-DOM trend means longer vacancies and softer asking-rent achievability than the comps imply.
- What's the recent tenant-quality profile in this submarket — average credit score on applications, eviction rate, late-payment / NSF rate, and stable-employment percentage? A property-management company in the area should have these aggregated.
- How much new apartment / multifamily construction is in the pipeline within 1–3 miles? Heavy new supply (>2% of stock underway) typically softens rents 12–24 months out; light construction supports rent growth.
Investment metrics
- 1% rule
- 1.09% ✓
- Cap rate
- 9.32%
- Cash-on-cash
- 10.80%
- DSCR
- 1.48
- GRM
- 7.7
CMA / ARV
- ARV (median comp)
- $229,407
- List price
- $299,900
- Delta
- 30.73%
- Verdict
- OVERPRICED
- Comps
- 20 within 1.0 mi
Show comp detail 5 sales within ~0.75 mi
| Address | Dist | Beds/Ba | Sqft | Sold | Price | $/sf | Match |
|---|---|---|---|---|---|---|---|
| 507 Concord Ave | 0.37mi | 3/— | 1,700 (-1%) | 8mo | $248,000 | $146 | 74 |
| 610 Concord Ave | 0.38mi | 3/— | 1,575 (-9%) | 6mo | $392,000 | $249 | 63 |
| 1806 N West St | 0.69mi | 3/— | 1,700 (-1%) | 6mo | $270,000 | $159 | 60 |
| 2239 N Pine St | 0.64mi | 4/2.0 (+1) | 1,650 (-4%) | 19mo | $180,000 | $109 | 42 |
| 621 E 22nd St | 0.72mi | 2/— (-1) | 1,475 (-14%) | 12mo | $125,000 | $85 | 27 |
Match score weights: distance 35% · size 25% · config 20% · recency 20%. Top-matched comps best support the ARV.
Projected returns pro-forma
-3.0% appreciation · 5.72% rent growth · sell at horizon
- IRR
- 2.6%
- Equity multiple
- 1.10×
- Total profit
- $8,577
- Equity at exit
- $44,716
- IRR
- 14.4%
- Equity multiple
- 2.30×
- Total profit
- $108,748
- Equity at exit
- $25,930
Cash invested: $83,972 (down + closing). Projections, not guarantees.
Landlord ↔ Tenant lean methodology
- Overall (STATE)
- 70 Landlord-Friendly
- State Delaware
- 70 Landlord-Friendly · D+7
- County
- — inherits STATE
- City
- — inherits STATE
ZIP-level market 19802
- Rents YoY
- 5.7%
- Active inventory
- 119
- Price-to-rent
- 14.0×
Monthly cashflow live
- Estimated rent
- $3,259 high interval (Pro) →
- Mortgage (P&I)
- −$1,573
- Tax from tax record
- −$121 /mo · $1,457/yr
- Insurance
- −$125
- HOA
- −$0
- Vacancy / Maint / Mgmt
- −$684
- Net cashflow
- $756
Break-even live
2-unit breakdown (identical units grouped — click to expand)
| Units | Beds | Baths | Est. rent |
|---|---|---|---|
| 1× unit | 3 | 2 | $1,783 |
| 1× unit | 1 | 1 | $1,476 |
| Total (2 units) | $3,259 | ||
UW: 25.0% down · 7.5% · 30yr · 1.5% tax · 5.0% vac · 8.0% maint · 8.0% mgmt
Financing live
Cash to close
- Down payment
- $74,975
- Closing costs
- $8,997
- Reserves months
- —
- Total cash needed
- —
Loan-product check · same deal, 3 products live
Conventional
25% down · 7.5% · 30yr
- Down + closing
- —
- Monthly P&I
- —
- Monthly cashflow
- —
- DSCR
- —
- Eligible?
- —
Personal DTI + credit; lowest rate.
DSCR
20% down · 8.5% · 30yr
- Down + closing
- —
- Monthly P&I
- —
- Monthly cashflow
- —
- DSCR
- —
- Eligible?
- —
No personal income docs; deal must DSCR.
Hard money
10% down · 12.0% · 12mo
- Down + closing
- —
- Monthly P&I
- —
- Monthly cashflow
- —
- DSCR
- —
- Eligible?
- —
Short-term bridge; refi at stabilization.
Rent comps 40 comps
| Address | Beds | Baths | Sqft | Rent | $/sqft | DOM | Units | Dist |
|---|---|---|---|---|---|---|---|---|
| 2923 N Washington St Wilmington, DE | 3.0 | 1.0 | 1225 | $1,600 | $1.31 | 1d | 1 | 0.07mi |
| 3003 N Washington St Wilmington, DE | 3.0 | 1.0 | 1250 | $1,950 | $1.56 | 43d | 1 | 0.07mi |
| 400 W 29th St Wilmington, DE | 3.0 | 1.5 | 1125 | $1,950 | $1.73 | 43d | 1 | 0.08mi |
| 3005 N West St Wilmington, DE | 3.0 | 1.0 | 1176 | $1,900 | $1.62 | 24d | 1 | 0.16mi |
| 517 W 26th St Unit NA Wilmington, DE | 3.0 | 1.5 | 1344 | $1,900 | $1.41 | 24d | 1 | 0.25mi |
| 2518 N Tatnall St Wilmington, DE | 4.0 | 1.5 | 1575 | $1,995 | $1.27 | 43d | 1 | 0.34mi |
| 2401 N West St Wilmington, DE | 4.0 | 1.0 | 1650 | $1,900 | $1.15 | 15d | 1 | 0.37mi |
| 507 Barrett St Wilmington, DE | 3.0 | 1.0 | 1275 | $1,700 | $1.33 | 43d | 1 | 0.38mi |
| 302 W 23rd St Unit 1 Wilmington, DE | 2.0 | 1.0 | 1450 | $1,295 | $0.89 | 24d | 1 | 0.42mi |
| 306 W 23rd St Unit 2 Wilmington, DE | 2.0 | 1.0 | 1475 | $1,295 | $0.88 | 43d | 1 | 0.42mi |
| 306 W 23rd St Unit 1 Wilmington, DE | 2.0 | 1.0 | 1475 | $1,295 | $0.88 | 24d | 1 | 0.42mi |
| 125 W 23rd St Wilmington, DE | 4.0 | 2.0 | 1672 | $1,995 | $1.19 | 43d | 1 | 0.43mi |
| 314 Concord Ave Unit 2 Wilmington, DE | 2.0 | 1.0 | 1300 | $1,295 | $1.00 | 24d | 1 | 0.43mi |
| 306 Concord Ave Unit 2 Wilmington, DE | 3.0 | 1.0 | 1100 | $1,350 | $1.23 | 43d | 1 | 0.44mi |
| 5 E 24th St Unit 1 Wilmington, DE | 3.0 | 1.0 | 1150 | $1,795 | $1.56 | 43d | 1 | 0.47mi |
| 2705 Speakman Pl Wilmington, DE | 3.0 | 1.5 | 1100 | $1,975 | $1.80 | 12d | 1 | 0.50mi |
| 409 W 20th St Unit 2 Wilmington, DE | 2.0 | 1.0 | 1100 | $1,500 | $1.36 | 12d | 1 | 0.59mi |
| 409 W 20th St Unit 2 Wilmington, DE | 2.0 | 1.0 | 1100 | $1,700 | $1.55 | 10d | 1 | 0.59mi |
| 912 McCabe Ave Wilmington, DE | 2.0 | 1.0 | 2100 | $1,950 | $0.93 | 1d | 1 | 0.60mi |
| 547 Eastlawn Ave Wilmington, DE | 3.0 | 1.0 | 1400 | $1,995 | $1.43 | 43d | 1 | 0.75mi |
| 918 E 17th St Unit 1 Wilmington, DE | 3.0 | 1.0 | 1100 | $1,795 | $1.63 | 1d | 1 | 0.92mi |
| 107 W 13th St Wilmington, DE | 3.0 | 1.5 | 1325 | $1,895 | $1.43 | 43d | 1 | 1.01mi |
| 1217 N King St Wilmington, DE | 3.0 | 1.5 | 1300 | $2,145 | $1.65 | 18d | 1 | 1.02mi |
| 2 Colony Blvd Wilmington, DE | 1.0–2.0 | 1.0–2.0 | 1112 | $2,500 | $2.25 | 1d | 6 | 1.04mi |
| 903 Shallcross Ave Wilmington, DE | 2.0 | 1.5 | 1575 | $2,195 | $1.39 | 24d | 1 | 1.08mi |
| 1124 Clifford Brown Walk Wilmington, DE | 2.0 | 1.0 | 1240 | $1,625 | $1.31 | 43d | 1 | 1.10mi |
| 1001 N Orange St Wilmington, DE | 1.0–2.0 | 1.0–2.0 | 833 | $2,135 | $2.56 | 1d | 62 | 1.19mi |
| 1026 Bennett St Wilmington, DE | 3.0 | 1.0 | 1125 | $1,685 | $1.50 | 1d | 1 | 1.21mi |
| 605 E 10th St Wilmington, DE | 3.0 | 1.0 | 1200 | $1,850 | $1.54 | 24d | 1 | 1.22mi |
| 1004 N Spruce St Wilmington, DE | 3.0 | 1.5 | 1075 | $1,800 | $1.67 | 18d | 1 | 1.22mi |
| 1301 N Harrison St Wilmington, DE | 1.0–2.0 | 1.0 | 1050 | $1,850 | $1.76 | 5d | 1 | 1.24mi |
| 913 N Market St Wilmington, DE | 1.0–2.0 | 1.0–2.0 | 974 | $1,985 | $2.04 | 43d | 5 | 1.24mi |
| 928 Kirkwood St Wilmington, DE | 3.0 | 1.5 | 1150 | $1,700 | $1.48 | 17d | 1 | 1.26mi |
| 1207 Delaware Ave Wilmington, DE | 2.0 | 1.0 | 1200 | $1,700 | $1.42 | 11d | 1 | 1.27mi |
| 613 W 10th St Wilmington, DE | 2.0 | 1.0 | 1100 | $1,745 | $1.59 | 43d | 1 | 1.29mi |
| 212 W 9th St Unit 204 Wilmington, DE | 2.0 | 2.0 | 1671 | $1,795 | $1.07 | 43d | 1 | 1.30mi |
| 212 W 9th St Unit 204 Wilmington, DE | 2.0 | 2.0 | 1671 | $1,745 | $1.04 | 5d | 1 | 1.30mi |
| 1210 Delaware Ave Unit 3 Wilmington, DE | 2.0 | 1.0 | 1200 | $2,395 | $2.00 | 43d | 1 | 1.31mi |
| 1010 Trenton Pl Wilmington, DE | 3.0 | 1.5 | 1475 | $2,350 | $1.59 | 16d | 1 | 1.32mi |
| 1501 N Broom St Unit 2/3 Wilmington, DE | 2.0 | 2.5 | 1250 | $2,500 | $2.00 | 5d | 1 | 1.32mi |
Listing history 4 events
-
2026-05-07status Pending 901-char remark
Show marketing remark (901 chars)
Welcome to this spacious and move-in-ready 3-bedroom, 2.5-bath home in a convenient Wilmington location! This home offers a versatile layout with potential for a 4th bedroom on the lower level—perfect for guests, a home office, or additional living space. The main level features an open and bright living area, an eat-in kitchen with ample cabinet space and center island, and a convenient powder room—ideal for entertaining. Upstairs, enjoy a generous primary suite along with additional bedrooms and a full bath. Additional highlights include interior access to the garage, off-street parking, and a private rear yard for relaxing or entertaining. Recent upgrades include a high-efficiency heater, double-hung tilt-in windows, and a full appliance package. Ideally located near major routes, shopping, and dining, this home offers comfort, space, and value. Schedule your showing today!
-
2026-04-29price $299,900 901-char remark
Show marketing remark (901 chars)
Welcome to this spacious and move-in-ready 3-bedroom, 2.5-bath home in a convenient Wilmington location! This home offers a versatile layout with potential for a 4th bedroom on the lower level—perfect for guests, a home office, or additional living space. The main level features an open and bright living area, an eat-in kitchen with ample cabinet space and center island, and a convenient powder room—ideal for entertaining. Upstairs, enjoy a generous primary suite along with additional bedrooms and a full bath. Additional highlights include interior access to the garage, off-street parking, and a private rear yard for relaxing or entertaining. Recent upgrades include a high-efficiency heater, double-hung tilt-in windows, and a full appliance package. Ideally located near major routes, shopping, and dining, this home offers comfort, space, and value. Schedule your showing today!
-
2026-04-20$304,000 Active 901-char remark
Show marketing remark (901 chars)
Welcome to this spacious and move-in-ready 3-bedroom, 2.5-bath home in a convenient Wilmington location! This home offers a versatile layout with potential for a 4th bedroom on the lower level—perfect for guests, a home office, or additional living space. The main level features an open and bright living area, an eat-in kitchen with ample cabinet space and center island, and a convenient powder room—ideal for entertaining. Upstairs, enjoy a generous primary suite along with additional bedrooms and a full bath. Additional highlights include interior access to the garage, off-street parking, and a private rear yard for relaxing or entertaining. Recent upgrades include a high-efficiency heater, double-hung tilt-in windows, and a full appliance package. Ideally located near major routes, shopping, and dining, this home offers comfort, space, and value. Schedule your showing today!
-
1979-03-01soldstatus $25,000
ⓘ Source: listings_history table (triggers on properties + properties_extension) + one-shot
backfill from property_details.listing_events for pre-trigger history.
Tax reassessment forecast DE · Partial reset (capped growth)
- Current annual tax
- $1,457 · $121/mo
- Projected year-2 tax
- $1,598 · $133/mo
- Expected delta
- +$141/yr (+$12/mo · 9.7%)
ⓘ Screening estimate from a state-policy table — verify with the county assessor before closing.
Climate risk First Street
- Flood 1/10 Low FEMA zone X (unshaded) · 0% chance over 30 yrs
- Wildfire 1/10 Low
- Heat 8/10 Severe 7 d/yr ≥103°F today · 16 d/yr by 30 yrs out
- Wind 6/10 Major 27% chance of damaging wind over 30 yrs
- Air quality 3/10 Moderate 2 unhealthy d/yr today · 3 by 30 yrs out
Nearby sold comps map
Loading sold comps map…
Walkable amenities ~0.75 mi
Loading nearby amenities…
Taxation est. · year 1
- Rental income
- $39,108
- − Mortgage interest
- −$16,799
- − Property taxes
- −$1,457
- − Insurance
- −$1,500
- − Repairs & maintenance
- −$3,129
- − Management
- −$3,129
- − Depreciation
- −$8,724
- Taxable income
- $4,371
- Est. tax owed @ 24.0%
- −$1,049
- After-tax cash flow
- $8,017/yr
For passive investors: Depreciation is non-cash, so a rental often shows a tax loss while cash-flowing — sheltering income. Rental losses are passive: they offset passive income freely, and up to $25,000/yr can offset ordinary (W-2) income if you actively participate and your MAGI is under $100k (phasing out to $0 by $150k); unused losses carry forward. On sale, claimed depreciation is recaptured at up to 25%, and gains may owe capital-gains tax (a 1031 exchange can defer both). Figures are a year-1 estimate at your 24.0% rate — not tax advice; consult a CPA.
Schools (NCES district)
- District
- Red Clay Consolidated School District
- NCES district ID
- 1001300
- Math proficiency
- 27% ▼ -11.00%
- Reading proficiency
- 42% ▼ -7.00%
- Median HH income
- $64,298
- Composite
- 31.25/100
- National rank
- #6027
- State rank
- #12 of 26 in DE
Livability — Wilmington
- Score
- 64/100
- State rank
- #52
- US rank
- #14251
Category grades
Schools grade is shown separately in the Schools card above.
Census & demographics
- Census place
- Wilmington, DE
- County
- New Castle County · 483,412 people
- City population
- 173,480
- Metro
- Philadelphia-Camden-Wilmington, PA-NJ-DE-MD
- Population (ZIP)
- 26,051
- Household income
- $53,812
- Rent vs Own
- Severe rent burden
- 1816.0
Population outlook (New Castle County) Hauer SSP2
- Today (2025)
- 594,686 people
- By 2030
- 609,164 · +2.4%
- By 2040
- 632,154 · +6.3%
- By 2050
- 649,068 · +9.1%
- By 2075
- 687,771 · +15.7%
- By 2100
- 694,961 · +16.9%
Race, ethnicity, and origin ACS 2023
- Neighborhood character
- Predominantly Black (68%)
- Race & ethnicity
- Black 68% White 20% Hispanic / Latino 7% Two or more races 5%
- Hispanic origin (detail)
- Puerto Rican 4%
- Common ancestry
- Slovak 1% Romanian 1% Italian 1%
- Foreign-born
- 11% · Canada, Jamaica, China
- Languages at home
- 92% English-only · Spanish 4% Arabic 0%
Political lean MEDSL · New Castle
- 2024 margin
- Solid D (+32.6) · D 65.5% · R 32.9% · Other 1.6%
- 2008→2024 swing
- -8.1pp toward R · 2008: 40.6pp · 2024: 32.6pp
- All cycles
- 2024: D+32.6 2020: D+37.1 2016: D+29.6 2012: D+34.1 2008: D+40.6
Not yet ingested
- Civics
- —
Market trends
- HPI YoY
- ▼ -296.47%
- Current HPI
- 225.6613
- Rent YoY
- ▲ 5.72%
- Metro
- Philadelphia-Camden-Wilmington, PA-NJ-DE-MD
- State GDP YoY
- —
- F500 in state
- 0
Price history
+1099.6% since first listed4 events — show timeline
- 2026-05-07 Pending — BRIGHT MLS
- 2026-04-29 Price Changed $299,900 BRIGHT MLS
- 2026-04-20 Listed $304,000 BRIGHT MLS
- 1979-03-01 Sold (Public Records) $25,000 Public Records
Property tax history
+3.7%/yrLatest (2024): $1,457 · +15.1% YoY. Source: county tax records.
Cash-flow waterfall
monthlySold comps — $/sqft
last 12 mo · ≤1 miLoading sold comps…