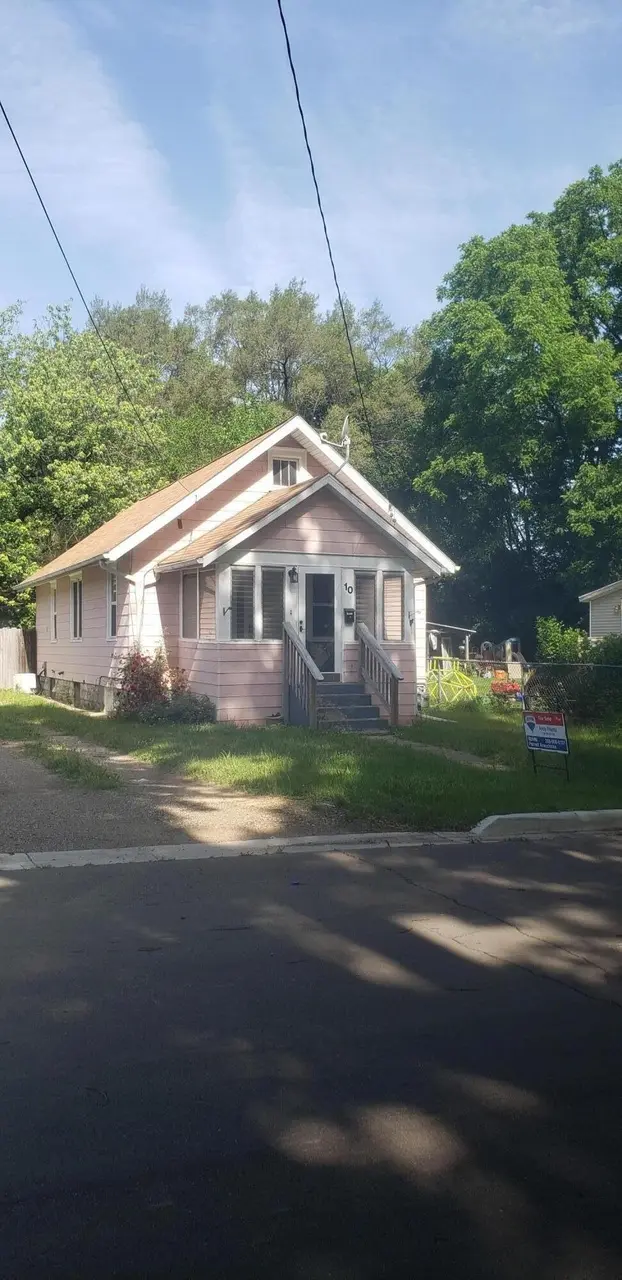
10 Cornwell St · Brownlee Park, MI
Flood risk 4/10 · Minor
- FEMA flood zone
- X (unshaded)
- Chance of flooding over 30 yrs
- 0.22%
- Est. flood insurance / yr
- $473 – $860
Fire risk 3/10 · Minor
- Est. fire insurance / yr
- $784 – $1,456
Heat risk 2/10 · Minimal
- Hot days now (above 98°F)
- 7 days/yr
- Hot days in 30 yrs
- 16 days/yr
Wind risk 2/10 · Minimal
- Chance of severe wind over 30 yrs
- —
Air-quality risk 3/10 · Minor
- Unhealthy air days now
- 1 days/yr
- Unhealthy air days in 30 yrs
- 3 days/yr
Risk factors via First Street. Map © Google.
Why this score? — see what drove the D+ grade
The composite is a weighted blend of 9 inputs, each scored 0–100. Each bar is that input's sub-score; the figure is the points it added to the 100-point composite (weight × sub-score).
- Cash flow +22.4/30.0
- DSCR +7.2/10.0
- 1% rule +4.8/10.0
- Livability +3.3/5.0
- Schools +2.9/10.0
- Rent growth +2.5/5.0
- Condition / age +2.5/5.0
- ARV discount +1.8/15.0
- Appreciation +0.0/10.0
$104,900
🖨 Deal sheet 📄 Offer letter ✓ Due diligence
Listing remarks MLS
Completely updated and ready for immediate possession is the 2 bedroom home in Harper Creek schools featuring Lots of updates including Kitchen, Paint , Carpet. Private fenced in back yard, Full basement with Laundry hook ups and priced to sell at $104900.00 so call special Agent
Key facts
- Full basement
- Laundry hook ups
- Updated kitchen
Tags
Property features AI
Exterior
- Utilities: Natural gas water heater
- Home design: Ranch-style single-family home; One-story; Built in 1927
- Construction: Vinyl siding; Composition roof; Full basement
- Exterior features: Paved road access; Public water
Interior
- Bathrooms: One full bathroom
- Heating & cooling: Forced air heating; Central cooling
- Interior features: Five total rooms; 36-inch entrance door
Neighborhood map
What this means for you Summary
Snapshot
- This is a 2-bed/1.0-bath single-family listed at $105k.
Deal economics
- At list price, monthly cash flow is $175 ($2k/yr) — positive.
- The deal already cash-flows at list — no discount required.
- To meet the 1% rule (rent ≥ 1% of price), the offer needs to be $102k (2.4% below list).
- Recommended offer: $102k (2.4% below list) — sets the bar for 1% rule.
- Cap rate 8.3% vs local median 3.8% in Brownlee Park — top-decile yield for the area; either an underpriced asset or a hidden risk that comps aren't pricing in. Stress-test before assuming the spread holds.
Location & tenants
- Location reads 66/100 on livability (#429 in MI) — a middle-class / working-renter tenant base. Strengths: cost of living A+, housing A+, crime A-; Watch: schools F, amenities F, commute F.
- Harper Creek Community Schools (rural): math 25% / reading 40% proficiency, ranked #313 of 540 in MI (top 58%) — families likely to look elsewhere, expect single-tenant / working-renter base with shorter leases.
- Market conditions: 135 active listings in the ZIP; 4 comparable units currently listed for rent nearby; rentals lingering (median 44d on market — plan ~5-8 weeks vacancy on turnover, expect pricing pressure); 100% of comp listings sitting > 30 days — soft ceiling on asking rent; 132 units permitted in Calhoun County in 2024 (0 in 5+ unit buildings).
- This rent is only 18% of the median local income ($69k/yr) — well below the 30% rent-burden line; pricing power to push rent on renewal without tenant pushback.
Forward outlook
- Local home prices are declining (-3.0%/yr); year-one equity from $725 of loan paydown is wiped out by about $3k of value loss. Plan a longer hold.
- Calhoun County population projected at -16% by 2050 — secular population decline; favor cash flow + early exit over multi-decade hold.
Negotiation context
- Only 5 days on market — expect competitive offers; lowballing is unlikely to land.
- 6 sale attempts since 4y ago with the ask held roughly flat each time — persistent listings suggest the price (not the market) is what's stuck; bring a comps-based counter.
Risks & watch-outs
- Watch-outs: built in 1927 — expect roof / HVAC / electrical / plumbing capex.
Questions for the listing agent
- Built in 1927 — when were the roof, HVAC, electrical panel, plumbing, and water heater last replaced?
- Is there a deadline driving the sale (1031 exchange, divorce, estate, relocation)? That informs how much negotiation room exists.
- Schools are F-rated, which usually means shorter tenancies and higher turnover. Who's the typical renter profile here, and what's been the actual vacancy rate?
- The area grade is low — what's the realistic commute time and amenity access for the typical tenant pool here? Any planned neighborhood developments (good or bad) we should know about?
- What's the average days-on-market for RENTAL listings here right now (not sales)? A rising rental-DOM trend means longer vacancies and softer asking-rent achievability than the comps imply.
- What's the recent tenant-quality profile in this submarket — average credit score on applications, eviction rate, late-payment / NSF rate, and stable-employment percentage? A property-management company in the area should have these aggregated.
- How much new for-sale + rental construction is in the pipeline within 1–3 miles? Heavy new supply typically softens prices + rents 12–24 months out; constrained supply supports both.
Investment metrics
- 1% rule
- 0.98% ✗
- Cap rate
- 8.30%
- Cash-on-cash
- 7.16%
- DSCR
- 1.32
- GRM
- 8.5
CMA / ARV
- ARV (on-the-fly)
- $93,100
- Comps found
- 6
Show comp detail 6 sales within ~0.75 mi
| Address | Dist | Beds/Ba | Sqft | Sold | Price | $/sf | Match |
|---|---|---|---|---|---|---|---|
| 35 Shirley Ave | 0.18mi | 3/2.0 (+1) | 696 (-1%) | 19mo | $123,000 | $177 | 66 |
| 153 Martin St | 0.29mi | 3/1.0 (+1) | 632 (-10%) | 8mo | $135,000 | $214 | 58 |
| 104 Vale St | 0.42mi | 2/1.0 | 752 (+7%) | 13mo | $96,000 | $128 | 57 |
| 12 Winnifred St | 0.09mi | 1/1.5 (-1) | 792 (+13%) | 12mo | $100,000 | $126 | 57 |
| 9 Shirley Ave | 0.10mi | 2/1.0 | 783 (+12%) | 24mo | $104,000 | $133 | 56 |
| 117 Inn Rd | 0.65mi | 3/1.0 (+1) | 770 (+10%) | 8mo | $65,000 | $84 | 41 |
Match score weights: distance 35% · size 25% · config 20% · recency 20%. Top-matched comps best support the ARV.
Projected returns pro-forma
-3.0% appreciation · 3.0% rent growth · sell at horizon
- IRR
- -5.4%
- Equity multiple
- 0.80×
- Total profit
- $-5,873
- Equity at exit
- $15,641
- IRR
- 4.2%
- Equity multiple
- 1.31×
- Total profit
- $9,100
- Equity at exit
- $9,070
Cash invested: $29,372 (down + closing). Projections, not guarantees.
Landlord ↔ Tenant lean methodology
- Overall (STATE)
- 62 Landlord-Friendly
- State Michigan
- 62 Landlord-Friendly · EVEN
- County
- — inherits STATE
- City
- — inherits STATE
ZIP-level market 49014
- Home prices YoY
- -28.7%
- Active inventory
- 135
- Price-to-rent
- 8.5×
Monthly cashflow live
- Estimated rent
- $1,024 medium interval (Pro) →
- Mortgage (P&I)
- −$550
- Tax from tax record
- −$40 /mo · $480/yr
- Insurance
- −$44
- HOA
- −$0
- Vacancy / Maint / Mgmt
- −$215
- Net cashflow
- $175
Break-even live
UW: 25.0% down · 7.5% · 30yr · 1.5% tax · 5.0% vac · 8.0% maint · 8.0% mgmt
Financing live
Cash to close
- Down payment
- $26,225
- Closing costs
- $3,147
- Reserves months
- —
- Total cash needed
- —
Loan-product check · same deal, 3 products live
Conventional
25% down · 7.5% · 30yr
- Down + closing
- —
- Monthly P&I
- —
- Monthly cashflow
- —
- DSCR
- —
- Eligible?
- —
Personal DTI + credit; lowest rate.
DSCR
20% down · 8.5% · 30yr
- Down + closing
- —
- Monthly P&I
- —
- Monthly cashflow
- —
- DSCR
- —
- Eligible?
- —
No personal income docs; deal must DSCR.
Hard money
10% down · 12.0% · 12mo
- Down + closing
- —
- Monthly P&I
- —
- Monthly cashflow
- —
- DSCR
- —
- Eligible?
- —
Short-term bridge; refi at stabilization.
Rent comps 4 comps
| Address | Beds | Baths | Sqft | Rent | $/sqft | DOM | Units | Dist |
|---|---|---|---|---|---|---|---|---|
| 1975 Columbia Ave E Battle Creek, MI | 1.0–3.0 | 1.0 | 761 | $954 | $1.25 | 43d | 16 | 0.21mi |
| 744 E Michigan Ave Unit 04 Battle Creek, MI | 1.0 | 1.0 | 650 | $900 | $1.38 | 43d | 1 | 0.30mi |
| 595 Wagner Dr Unit 22 Battle Creek, MI | 1.0 | 1.0 | 750 | $1,050 | $1.40 | 43d | 1 | 1.05mi |
| 775 Wagner Dr Battle Creek, MI | 1.0–2.0 | 1.0 | 772 | $1,085 | $1.40 | 43d | 6 | 1.28mi |
Listing history 4 events
-
2026-06-07statusdays on market $104,900 Pending 5 DOM
-
2026-06-05days on market $104,900 Active 3 DOM
-
2026-06-02remarks 280-char remark
-
2026-06-02$104,900 Active 1 DOM
ⓘ Source: listings_history table (triggers on properties + properties_extension) + one-shot
backfill from property_details.listing_events for pre-trigger history.
Tax reassessment forecast MI · Partial reset (capped growth)
- Current annual tax
- $480 · $40/mo
- Projected year-2 tax
- $1,048 · $87/mo
- Expected delta
- +$568/yr (+$47/mo · 118.3%)
ⓘ Screening estimate from a state-policy table — verify with the county assessor before closing.
Climate risk First Street
- Flood 4/10 Moderate FEMA zone X (unshaded) · 22% chance over 30 yrs
- Wildfire 3/10 Moderate
- Heat 2/10 Low 7 d/yr ≥98°F today · 16 d/yr by 30 yrs out
- Wind 2/10 Low
- Air quality 3/10 Moderate 1 unhealthy d/yr today · 3 by 30 yrs out
Nearby sold comps map
Loading sold comps map…
Walkable amenities ~0.75 mi
Loading nearby amenities…
Taxation est. · year 1
- Rental income
- $12,291
- − Mortgage interest
- −$5,876
- − Property taxes
- −$480
- − Insurance
- −$524
- − Repairs & maintenance
- −$983
- − Management
- −$983
- − Depreciation
- −$3,052
- Taxable income
- $392
- Est. tax owed @ 24.0%
- −$94
- After-tax cash flow
- $2,010/yr
For passive investors: Depreciation is non-cash, so a rental often shows a tax loss while cash-flowing — sheltering income. Rental losses are passive: they offset passive income freely, and up to $25,000/yr can offset ordinary (W-2) income if you actively participate and your MAGI is under $100k (phasing out to $0 by $150k); unused losses carry forward. On sale, claimed depreciation is recaptured at up to 25%, and gains may owe capital-gains tax (a 1031 exchange can defer both). Figures are a year-1 estimate at your 24.0% rate — not tax advice; consult a CPA.
Schools (NCES district)
- District
- Harper Creek Community Schools
- NCES district ID
- 2617730
- Math proficiency
- 25% ▼ -9.00%
- Reading proficiency
- 40% ▼ -5.00%
- Median HH income
- $53,979
- Composite
- 28.6/100
- National rank
- #6713
- State rank
- #313 of 540 in MI
Livability — Brownlee Park
- Score
- 66/100
- State rank
- #429
- US rank
- #11906
Category grades
Schools grade is shown separately in the Schools card above.
Census & demographics
- Census place
- Brownlee Park, MI
- County
- Calhoun County · 91,590 people
- Metro
- Battle Creek, MI
- Population (ZIP)
- 21,980
- Household income
- $69,009
- Rent vs Own
- Severe rent burden
- 416.0
Population outlook (Calhoun County) Hauer SSP2
- Today (2025)
- 130,157 people
- By 2030
- 126,691 · -2.7%
- By 2040
- 118,517 · -8.9%
- By 2050
- 109,855 · -15.6%
- By 2075
- 90,486 · -30.5%
- By 2100
- 70,766 · -45.6%
Race, ethnicity, and origin ACS 2023
- Neighborhood character
- Predominantly White (78%)
- Race & ethnicity
- White 78% Black 9% Two or more races 8% Hispanic / Latino 6% Asian 1%
- Hispanic origin (detail)
- Mexican 5%
- Common ancestry
- Romanian 4% Iranian 3% Slovak 2%
- Foreign-born
- 4% · Canada
- Languages at home
- 92% English-only · Spanish 4% Russian/Polish/Slavic 1%
Political lean MEDSL · Calhoun
- 2024 margin
- R (+14.1) · D 42.3% · R 56.4% · Other 1.3%
- 2008→2024 swing
- -23.4pp toward R · 2008: 9.4pp · 2024: -14.1pp
- All cycles
- 2024: R+14.1 2020: R+11.1 2016: R+12.5 2012: D+1.6 2008: D+9.4
Not yet ingested
- Civics
- —
Market trends
- HPI YoY
- ▼ -97.29%
- Current HPI
- 241.3422
- Rent YoY
- —
- Metro
- Battle Creek, MI
- State GDP YoY
- ▲ 1.37%
- F500 in state
- 28
Industry mix (Fortune 500 HQ in MI)
| Industry | F500 HQs | Revenue |
|---|---|---|
| Automotive Parts | 3 | $48B |
|
||
| Automotive | 2 | $372B |
|
||
| Chemicals | 1 | $45B |
|
||
| Automotive Retail | 1 | $29B |
|
||
| Healthcare / Medical Devices | 1 | $23B |
|
||
| Automotive Technology | 1 | $20B |
|
||
Price history
+40.1% since first listed9 events — show timeline
- 2026-06-01 Listed $104,900 REALCOMP
- 2026-06-01 Listed $104,900 MiRealSource-MiMLS
- 2026-06-01 Listed $104,900 SW Michigan MLS
- 2022-07-01 Listing Removed — REALCOMP
- 2022-07-01 Listing Removed — MiRealSource-MiMLS
- 2022-07-01 Listing Removed — SW Michigan MLS
- 2022-06-13 Listed $74,900 MiRealSource-MiMLS
- 2022-06-13 Listed $74,900 SW Michigan MLS
- 2022-06-13 Listed $74,900 REALCOMP
Property tax history
-3.3%/yrLatest (2025): $480 · -60.7% YoY. Source: county tax records.
Cash-flow waterfall
monthlySold comps — $/sqft
last 12 mo · ≤1 miLoading sold comps…