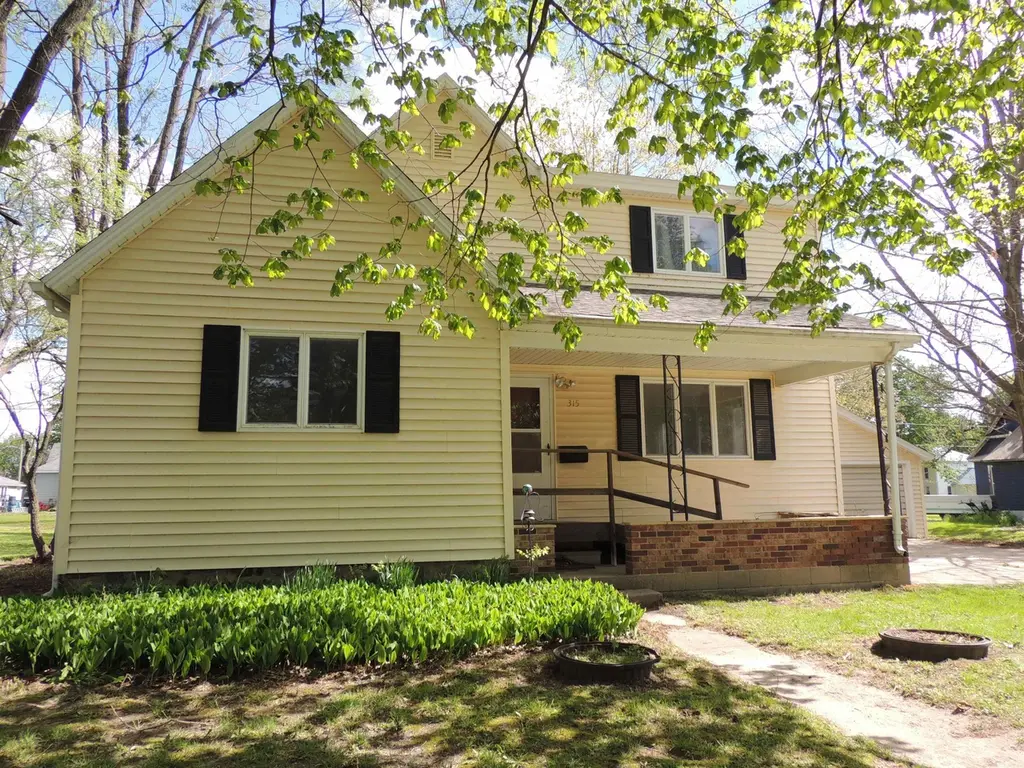
315 W Prospect St · Shell Rock, IA
Flood risk 1/10 · Minimal
- FEMA flood zone
- X (unshaded)
- Chance of flooding over 30 yrs
- 0.0%
- Est. flood insurance / yr
- $473 – $860
Fire risk 2/10 · Minimal
- Est. fire insurance / yr
- $902 – $1,676
Heat risk 2/10 · Minimal
- Hot days now (above 101°F)
- 7 days/yr
- Hot days in 30 yrs
- 16 days/yr
Wind risk 2/10 · Minimal
- Chance of severe wind over 30 yrs
- —
Air-quality risk 1/10 · Minimal
- Unhealthy air days now
- 0 days/yr
- Unhealthy air days in 30 yrs
- 0 days/yr
Risk factors via First Street. Map © Google.
Why this score? — see what drove the C- grade
The composite is a weighted blend of 9 inputs, each scored 0–100. Each bar is that input's sub-score; the figure is the points it added to the 100-point composite (weight × sub-score).
- Cash flow +14.2/30.0
- ARV discount +13.5/15.0
- Schools +6.6/10.0
- 1% rule +4.5/10.0
- DSCR +4.3/10.0
- Livability +3.9/5.0
- Rent growth +2.5/5.0
- Condition / age +2.5/5.0
- Appreciation +0.0/10.0
$124,500
🖨 Deal sheet 📄 Offer letter ✓ Due diligence
Listing remarks
Opportunity is knocking in the heart of Shell Rock! This 1,506 finished square foot home offers a solid layout with a large main-floor bedroom, two bathrooms on the main, and convenient main-floor laundry. Two additional upstairs bedrooms provide extra space and flexibility. This home does require remodeling and is being sold AS-IS, but big-ticket updates have already begun — including carpet removal and a new electrical panel installed in July 2024. With vinyl siding, a double stall garage, and a nice-sized yard, the exterior of the home is packed with potential and waiting for the right buyer to transform it. Whether you're an investor looking for your next flip or a buyer ready to
Key facts
- 8,680 sq ft lot
- Garage
- Built 1895
Property features AI
Exterior
- Parking: Detached carport; 2 carport spaces
- Utilities: Public water; Public sewer
- Home design: Single-family residential; Residential property
- Construction: Vinyl siding; Shingle (asphalt) roof
- Exterior features: Concrete road/driveway
Interior
- Bathrooms: 1 full bathroom; 1 half bathroom
- Heating & cooling: Forced air heating (natural gas); Central air conditioning
- Interior features: No fireplace
- Laundry & utility: Main-level laundry
Neighborhood map
What this means for you Summary
Snapshot
- This is a 3-bed/1.5-bath other listed at $124k.
Deal economics
- At list price, monthly cash flow is $21 ($249/yr) — positive.
- The deal already cash-flows at list — no discount required.
- To meet the 1% rule (rent ≥ 1% of price), the offer needs to be $118k (5.3% below list).
- Recommended offer: $118k (5.3% below list) — sets the bar for 1% rule.
Location & tenants
- Location reads 78/100 on livability (#135 in IA, #2,476 nationally) — a middle-class / working-renter tenant base. Strengths: crime A+, cost of living A+, housing A+; Watch: amenities F, commute F.
- Waverly-Shell Rock Community School District (town): math 79% / reading 74% proficiency, ranked #46 of 289 in IA (top 16%) — strong family-tenant draw, lease renewals of 3-5y typical; only 17% free/reduced lunch — higher-income household profile.
- Zoned schools: Waverly-Shell Rock Middle School (math 79% / reading 73%, grade A, #59 of 246 statewide, top 26%, 699 students, 22% FRL); Waverly-Shell Rock Senior High School (math 79% / reading 78%, grade A-, #50 of 336 statewide, top 15%, 771 students, 20% FRL) — zoned schools at 21% FRL track the district average.
- Market conditions: 23 active listings in the ZIP; 32 units permitted in Butler County in 2024 (0 in 5+ unit buildings).
Forward outlook
- Local home prices are declining (-3.0%/yr); year-one equity from $861 of loan paydown is wiped out by about $4k of value loss. Plan a longer hold.
- Butler County population projected to shrink 5% by 2050 — rents likely to lag national; underwrite the cash flow, not the appreciation.
Negotiation context
- Only 6 days on market — expect competitive offers; lowballing is unlikely to land.
Risks & watch-outs
- Watch-outs: built in 1895 — expect roof / HVAC / electrical / plumbing capex.
Questions for the listing agent
- Built in 1895 — when were the roof, HVAC, electrical panel, plumbing, and water heater last replaced?
- Is there a deadline driving the sale (1031 exchange, divorce, estate, relocation)? That informs how much negotiation room exists.
- Schools are A-rated — typically a magnet for longer-tenancy family renters. What's the average tenant stay here, and is there a school-zone premium baked into asking?
- What's the average days-on-market for RENTAL listings here right now (not sales)? A rising rental-DOM trend means longer vacancies and softer asking-rent achievability than the comps imply.
- What's the recent tenant-quality profile in this submarket — average credit score on applications, eviction rate, late-payment / NSF rate, and stable-employment percentage? A property-management company in the area should have these aggregated.
- How much new for-sale + rental construction is in the pipeline within 1–3 miles? Heavy new supply typically softens prices + rents 12–24 months out; constrained supply supports both.
Investment metrics
- 1% rule
- 0.95% ✗
- Cap rate
- 6.49%
- Cash-on-cash
- 0.71%
- DSCR
- 1.03
- GRM
- 8.8
CMA / ARV
- ARV (median comp)
- $143,593
- List price
- $124,500
- Delta
- -13.30%
- Verdict
- UNDERPRICED
- Comps
- 20 within 1.0 mi
Projected returns pro-forma
-3.0% appreciation · 3.0% rent growth · sell at horizon
- IRR
- -15.1%
- Equity multiple
- 0.46×
- Total profit
- $-18,804
- Equity at exit
- $18,563
- IRR
- -6.5%
- Equity multiple
- 0.58×
- Total profit
- $-14,474
- Equity at exit
- $10,764
Cash invested: $34,860 (down + closing). Projections, not guarantees.
Landlord ↔ Tenant lean methodology
- Overall (STATE)
- 83 Strongly Landlord-Friendly
- State Iowa
- 83 Strongly Landlord-Friendly · R+6
- County
- — inherits STATE
- City
- — inherits STATE
ZIP-level market 50670
- Home prices YoY
- -26.6%
- Active inventory
- 23
- Price-to-rent
- 8.8×
Monthly cashflow live
- Estimated rent
- $1,180 medium interval (Pro) →
- Mortgage (P&I)
- −$653
- Tax from tax record
- −$206 /mo · $2,476/yr
- Insurance
- −$52
- HOA
- −$0
- Vacancy / Maint / Mgmt
- −$248
- Net cashflow
- $21
Break-even live
UW: 25.0% down · 7.5% · 30yr · 1.5% tax · 5.0% vac · 8.0% maint · 8.0% mgmt
Financing live
Cash to close
- Down payment
- $31,125
- Closing costs
- $3,735
- Reserves months
- —
- Total cash needed
- —
Loan-product check · same deal, 3 products live
Conventional
25% down · 7.5% · 30yr
- Down + closing
- —
- Monthly P&I
- —
- Monthly cashflow
- —
- DSCR
- —
- Eligible?
- —
Personal DTI + credit; lowest rate.
DSCR
20% down · 8.5% · 30yr
- Down + closing
- —
- Monthly P&I
- —
- Monthly cashflow
- —
- DSCR
- —
- Eligible?
- —
No personal income docs; deal must DSCR.
Hard money
10% down · 12.0% · 12mo
- Down + closing
- —
- Monthly P&I
- —
- Monthly cashflow
- —
- DSCR
- —
- Eligible?
- —
Short-term bridge; refi at stabilization.
Listing history 2 events
-
2026-05-12status Pending 788-char remark
-
2026-05-06$124,500 Active 788-char remark
ⓘ Source: listings_history table (triggers on properties + properties_extension) + one-shot
backfill from property_details.listing_events for pre-trigger history.
Tax reassessment forecast IA · Partial reset (capped growth)
- Current annual tax
- $2,476 · $206/mo
- Projected year-2 tax
- $2,476 · $206/mo
- Expected delta
- $0/yr ($0/mo · 0.0%)
ⓘ Screening estimate from a state-policy table — verify with the county assessor before closing.
Climate risk First Street
- Flood 1/10 Low FEMA zone X (unshaded) · 0% chance over 30 yrs
- Wildfire 2/10 Low
- Heat 2/10 Low 7 d/yr ≥101°F today · 16 d/yr by 30 yrs out
- Wind 2/10 Low
- Air quality 1/10 Low 0 unhealthy d/yr today · 0 by 30 yrs out
Nearby sold comps map
Loading sold comps map…
Walkable amenities ~0.75 mi
Loading nearby amenities…
Taxation est. · year 1
- Rental income
- $14,155
- − Mortgage interest
- −$6,974
- − Property taxes
- −$2,476
- − Insurance
- −$622
- − Repairs & maintenance
- −$1,132
- − Management
- −$1,132
- − Depreciation
- −$3,622
- Taxable loss
- −$1,804
- Est. tax savings @ 24.0%
- +$433
- After-tax cash flow
- $682/yr
For passive investors: Depreciation is non-cash, so a rental often shows a tax loss while cash-flowing — sheltering income. Rental losses are passive: they offset passive income freely, and up to $25,000/yr can offset ordinary (W-2) income if you actively participate and your MAGI is under $100k (phasing out to $0 by $150k); unused losses carry forward. On sale, claimed depreciation is recaptured at up to 25%, and gains may owe capital-gains tax (a 1031 exchange can defer both). Figures are a year-1 estimate at your 24.0% rate — not tax advice; consult a CPA.
Schools (NCES district)
- District
- Waverly-Shell Rock Community School District
- NCES district ID
- 1930540
- Math proficiency
- 79% ▼ -3.00%
- Reading proficiency
- 74% ▬ 0.00%
- Median HH income
- $59,860
- Composite
- 65.73/100
- National rank
- #459
- State rank
- #46 of 289 in IA
Livability — Shell Rock
- Score
- 78/100
- State rank
- #135
- US rank
- #2476
Category grades
Schools grade is shown separately in the Schools card above.
Census & demographics
- Census place
- Shell Rock, IA
- Population (ZIP)
- 2,379
Population outlook (Butler County) Hauer SSP2
- Today (2025)
- 14,831 people
- By 2030
- 14,748 · -0.6%
- By 2040
- 14,456 · -2.5%
- By 2050
- 14,079 · -5.1%
- By 2075
- 13,041 · -12.1%
- By 2100
- 10,935 · -26.3%
Race, ethnicity, and origin ACS 2023
- Neighborhood character
- Predominantly White (96%)
- Race & ethnicity
- White 96% Two or more races 3% Hispanic / Latino 3%
- Common ancestry
- Lithuanian 4% Portuguese 3% Iranian 2%
- Foreign-born
- 2% · Canada
- Languages at home
- 96% English-only · Spanish 3%
Political lean MEDSL · Butler
- 2024 margin
- Solid R (+45.4) · D 26.7% · R 72.1% · Other 1.2%
- 2008→2024 swing
- -40.7pp toward R · 2008: -4.7pp · 2024: -45.4pp
- All cycles
- 2024: R+45.4 2020: R+38.5 2016: R+36.9 2012: R+10.4 2008: R+4.7
Not yet ingested
- Civics
- —
Market trends
- HPI YoY
- ▼ -63.78%
- Current HPI
- 175.7484
- Rent YoY
- —
- Metro
- —
- State GDP YoY
- ▲ 2.48%
- F500 in state
- 4
Industry mix (Fortune 500 HQ in IA)
| Industry | F500 HQs | Revenue |
|---|---|---|
| Financial Services | 1 | $16B |
|
||
| Retail / Convenience | 1 | $15B |
|
||
Price history
2 events — show timeline
- 2026-05-12 Pending — NEIRBR as distributed by MLS GRID
- 2026-05-06 Listed $124,500 NEIRBR as distributed by MLS GRID
Property tax history
+2.5%/yrLatest (2025): $2,476 · +2.0% YoY. Source: county tax records.
Cash-flow waterfall
monthlySold comps — $/sqft
last 12 mo · ≤1 miLoading sold comps…