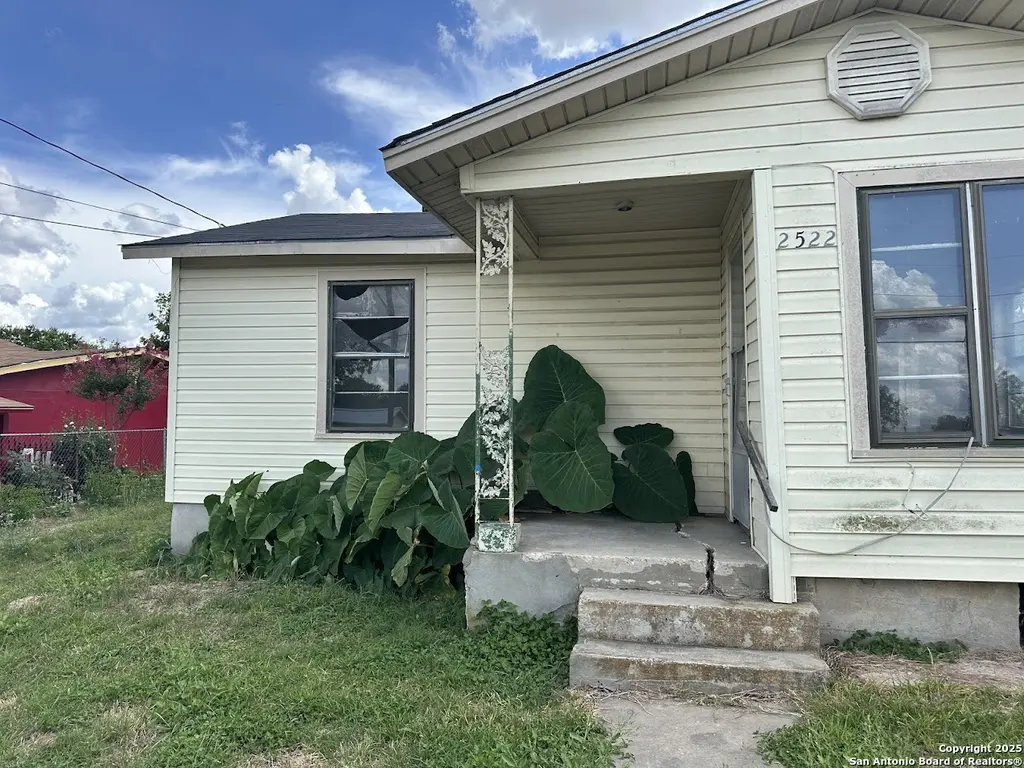
2522 Schley · San Antonio, TX
Flood risk 1/10 · Minimal
- FEMA flood zone
- X (unshaded)
- Chance of flooding over 30 yrs
- 0.0%
- Est. flood insurance / yr
- $507 – $1,088
Fire risk 2/10 · Minimal
- Est. fire insurance / yr
- $1,222 – $2,270
Heat risk 8/10 · Major
- Hot days now (above 108°F)
- 7 days/yr
- Hot days in 30 yrs
- 22 days/yr
Wind risk 8/10 · Major
- Chance of severe wind over 30 yrs
- 80.0%
Air-quality risk 2/10 · Minimal
- Unhealthy air days now
- 0 days/yr
- Unhealthy air days in 30 yrs
- 2 days/yr
Risk factors via First Street. Map © Google.
Why this score? — see what drove the C grade
The composite is a weighted blend of 9 inputs, each scored 0–100. Each bar is that input's sub-score; the figure is the points it added to the 100-point composite (weight × sub-score).
- Cash flow +19.1/30.0
- ARV discount +15.0/15.0
- DSCR +6.0/10.0
- 1% rule +4.8/10.0
- Livability +4.0/5.0
- Rent growth +2.8/5.0
- Condition / age +2.5/5.0
- Schools +1.4/10.0
- Appreciation +0.0/10.0
$144,999
🖨 Deal sheet (PDF) 📄 Offer letter ✓ Due diligence
Listing remarks MLS
3-bedroom, 2-bath home with a 1-car carport in a quiet San Antonio neighborhood. This single-story residence sits on a spacious 13,700 sq ft lot and offers comfortable living with easy access to local amenities. Great potential for first-time buyers or investors.
Key facts
- 0.31 acre lot
- Garage
- Built 1948
Neighborhood map
What this means for you Summary
Snapshot
- This is a 3-bed/1.0-bath single-family listed at $145k.
Deal economics
- At list price, monthly cash flow is $154 ($2k/yr) — positive.
- The deal already cash-flows at list — no discount required.
- To meet the 1% rule (rent ≥ 1% of price), the offer needs to be $142k (2.1% below list).
- Recommended offer: $128k (12.0% below list) — sets the bar for market timing.
- Cap rate 7.6% vs local median 3.8% in San Antonio — top-decile yield for the area; either an underpriced asset or a hidden risk that comps aren't pricing in. Stress-test before assuming the spread holds.
Location & tenants
- Location reads 80/100 on livability (#31 in TX, #1,616 nationally) — a professional / high-income tenant draw. Strengths: amenities A+, commute A+, cost of living A+; Watch: crime F.
- San Antonio ISD (urban): math 12% / reading 22% proficiency, ranked #805 of 826 in TX (top 98%) — low school quality limits family demand, transient renter base, plan for 1-2y turnover; 80% free/reduced lunch — lower-income household profile, screen leases tightly.
- Zoned schools: Democracy Prep At Stewart Academy (math 10% / reading 13%, grade F, #4,225 of 4,322 statewide, top 98%, 555 students, 97% FRL, charter); Rogers Middle (math 5% / reading 14%, grade F, #1,649 of 1,662 statewide, top 99%, 364 students, 92% FRL); Highlands H S (math 18% / reading 27%, grade F, #1,354 of 1,632 statewide, top 83%, 1,651 students, 92% FRL).
- Market conditions: Rents rising (+1.1%/yr); 281 active listings in the ZIP; 40 comparable units currently listed for rent nearby; rentals at typical pace (median 26d on market — plan ~3-4 weeks tenant-placement turnaround); 8,308 units permitted in Bexar County in 2024 (2,506 in 5+ unit buildings).
- This rent runs 31% of the median local income ($55k/yr) — at the standard rent-burdened threshold; future hikes will face affordability resistance.
Forward outlook
- Local home prices are declining (-3.0%/yr); year-one equity from $1k of loan paydown is wiped out by about $4k of value loss. Plan a longer hold.
- Bexar County population projected at +50% by 2050 — long-run rental-demand tailwind backs the buy-and-hold thesis.
Negotiation context
- It's been on market 248 days — a 12% lower offer ($128k) is reasonable based on typical stale-listing flexibility.
Risks & watch-outs
- Watch-outs: built in 1948 — expect roof / HVAC / electrical / plumbing capex.
- Climate carrying-cost: severe wind risk, 80% chance of damaging wind over 30y; extreme-heat days projected 7→22/yr by 2055 (HVAC capex compounding) — expect insurance premiums to compound above CPI over the hold.
Questions for the listing agent
- It's been on market 248 days. Have you received any prior offers? Is the seller open to a 12% concession, seller financing, or rate buy-down credit?
- Built in 1948 — when were the roof, HVAC, electrical panel, plumbing, and water heater last replaced?
- Why hasn't it sold? Are there any deal-killer items the seller is aware of (foundation, flood, title, zoning, code violations)?
- Is there a deadline driving the sale (1031 exchange, divorce, estate, relocation)? That informs how much negotiation room exists.
- Crime grade is F in this area — have there been break-ins, vandalism, or insurance claims at this property in the last 3 years? What carrier currently insures it and at what premium?
- What's the average days-on-market for RENTAL listings here right now (not sales)? A rising rental-DOM trend means longer vacancies and softer asking-rent achievability than the comps imply.
- What's the recent tenant-quality profile in this submarket — average credit score on applications, eviction rate, late-payment / NSF rate, and stable-employment percentage? A property-management company in the area should have these aggregated.
- How much new for-sale + rental construction is in the pipeline within 1–3 miles? Heavy new supply typically softens prices + rents 12–24 months out; constrained supply supports both.
Investment metrics
- 1% rule
- 0.98% ✗
- Cap rate
- 7.57%
- Cash-on-cash
- 4.55%
- DSCR
- 1.20
- GRM
- 8.5
CMA / ARV
- ARV (median comp)
- $175,353
- List price
- $144,999
- Delta
- -17.31%
- Verdict
- UNDERPRICED
- Comps
- 20 within 1.0 mi
Show comp detail 12 sales within ~0.75 mi
| Address | Dist | Beds/Ba | Sqft | Sold | Price | $/sf | Match |
|---|---|---|---|---|---|---|---|
| 2307 Mckinley | 0.24mi | 3/2.0 | 1,059 (+4%) | 7mo | $102,000 | $96 | 73 |
| 1518 Bailey | 0.20mi | 3/2.0 | 1,082 (+6%) | 6mo | $150,000 | $139 | 72 |
| 1437 Avant | 0.29mi | 3/2.0 | 988 (-3%) | 8mo | $215,000 | $218 | 71 |
| 2307 Hicks | 0.26mi | 2/1.0 (-1) | 905 (-11%) | 1mo | $214,999 | $238 | 63 |
| 121 Vista | 0.34mi | 3/1.0 | 1,132 (+11%) | 4mo | $225,000 | $199 | 62 |
| 1327 Bailey Ave | 0.39mi | 3/1.0 | 1,090 (+7%) | 10mo | $114,999 | $106 | 62 |
| 2022 Hicks | 0.54mi | 3/1.0 | 984 (-4%) | 11mo | $169,900 | $173 | 59 |
| 119 Quinta | 0.41mi | 3/2.0 | 1,134 (+11%) | 0mo | $156,000 | $138 | 58 |
| 228 Quinta St | 0.41mi | 3/2.0 | 1,102 (+8%) | 10mo | $209,000 | $190 | 56 |
| 1118 Bailey | 0.65mi | 3/1.0 | 1,125 (+10%) | 8mo | $195,000 | $173 | 47 |
| 3602 Bremen Ave | 0.63mi | 4/2.0 (+1) | 1,092 (+7%) | 6mo | $125,000 | $114 | 45 |
| 1219 E Drexel Ave | 0.73mi | 2/1.0 (-1) | 918 (-10%) | 1mo | $145,000 | $158 | 43 |
Match score weights: distance 35% · size 25% · config 20% · recency 20%. Top-matched comps best support the ARV.
Projected returns pro-forma
-3.0% appreciation · 1.07% rent growth · sell at horizon
- IRR
- -11.3%
- Equity multiple
- 0.60×
- Total profit
- $-16,392
- Equity at exit
- $21,620
- IRR
- -5.1%
- Equity multiple
- 0.70×
- Total profit
- $-12,319
- Equity at exit
- $12,537
Cash invested: $40,600 (down + closing). Projections, not guarantees.
Landlord ↔ Tenant lean methodology
- Overall (STATE)
- 87 Strongly Landlord-Friendly
- State Texas
- 87 Strongly Landlord-Friendly · R+5
- County
- — inherits STATE
- City
- — inherits STATE
ZIP-level market 78210
- Rents YoY
- 1.1%
- Active inventory
- 281
- Price-to-rent
- 8.5×
Monthly cashflow live
- Estimated rent
- $1,419 high interval (Pro) →
- Mortgage (P&I)
- −$760
- Tax from tax record
- −$146 /mo · $1,757/yr
- Insurance
- −$60
- HOA
- −$0
- Vacancy / Maint / Mgmt
- −$298
- Net cashflow
- $154
Break-even live
Sensitivity live
| Price | -10% $236 | -5% $195 | +0% $154 | +5% $113 | +10% $72 |
|---|---|---|---|---|---|
| Rent | -10% $42 | -5% $98 | +0% $154 | +5% $210 | +10% $266 |
| Rate | -1.0pp $227 | -0.5pp $191 | base $154 | +0.5pp $116 | +1.0pp $78 |
UW: 25.0% down · 7.5% · 30yr · 1.5% tax · 5.0% vac · 8.0% maint · 8.0% mgmt
Financing live
Cash to close
- Down payment
- $36,250
- Closing costs
- $4,350
- Reserves months
- —
- Total cash needed
- —
Loan-product check · same deal, 3 products live
Conventional
25% down · 7.5% · 30yr
- Down + closing
- —
- Monthly P&I
- —
- Monthly cashflow
- —
- DSCR
- —
- Eligible?
- —
Personal DTI + credit; lowest rate.
DSCR
20% down · 8.5% · 30yr
- Down + closing
- —
- Monthly P&I
- —
- Monthly cashflow
- —
- DSCR
- —
- Eligible?
- —
No personal income docs; deal must DSCR.
Hard money
10% down · 12.0% · 12mo
- Down + closing
- —
- Monthly P&I
- —
- Monthly cashflow
- —
- DSCR
- —
- Eligible?
- —
Short-term bridge; refi at stabilization.
Rent comps 40 comps
| Address | Beds | Baths | Sqft | Rent | $/sqft | DOM | Units | Dist |
|---|---|---|---|---|---|---|---|---|
| 2307 McKinley Ave San Antonio, TX | 3.0 | 2.0 | 1059 | $1,495 | $1.41 | 45d | 1 | 0.23mi |
| 111 Quinta St San Antonio, TX | 3.0 | 2.0 | 909 | $1,295 | $1.42 | 3d | 1 | 0.41mi |
| 3400 Roland Rd San Antonio, TX | 1.0–2.0 | 1.0 | 769 | $999 | $1.30 | 23d | 1 | 0.51mi |
| 1303 Rigsby Ave Unit 710 San Antonio, TX | 2.0 | 2.0 | 950 | $1,165 | $1.23 | 0d | 1 | 0.55mi |
| 2018 E Drexel Ave San Antonio, TX | 3.0 | 2.0 | 1268 | $1,750 | $1.38 | 25d | 1 | 0.61mi |
| 534 Cosgrove St San Antonio, TX | 3.0 | 2.0 | 1430 | $1,875 | $1.31 | 45d | 1 | 0.64mi |
| 3602 Bremen St San Antonio, TX | 4.0 | 2.0 | 1092 | $1,595 | $1.46 | 25d | 1 | 0.65mi |
| 918 Hampton St Unit 1 San Antonio, TX | 3.0 | 1.0 | 912 | $975 | $1.07 | 45d | 1 | 0.67mi |
| 3607 Bremen Ave #2 San Antonio, TX | 2.0 | 1.0 | 940 | $999 | $1.06 | 0d | 1 | 0.68mi |
| 723 Sewanee St San Antonio, TX | 3.0 | 2.0 | 1028 | $1,264 | $1.23 | 14d | 1 | 0.68mi |
| 164 Day Rd San Antonio, TX | 3.0 | 2.5 | 1250 | $1,667 | $1.33 | 25d | 1 | 0.76mi |
| 1811 McKinley Ave San Antonio, TX | 2.0 | 2.0 | 1248 | $975 | $0.78 | 4d | 1 | 0.79mi |
| 611 Kashmuir Pl San Antonio, TX | 3.0 | 1.0 | 1008 | $1,800 | $1.79 | 45d | 1 | 0.81mi |
| 317 Kashmuir Pl Unit 3 San Antonio, TX | 2.0 | 1.0 | 732 | $1,197 | $1.64 | 18d | 1 | 0.90mi |
| 1124 Vanderbilt St San Antonio, TX | 3.0 | 1.0 | 1095 | $1,350 | $1.23 | 45d | 1 | 0.93mi |
| 1303 Essex St #102 San Antonio, TX | 3.0 | 2.5 | 1180 | $1,400 | $1.19 | 25d | 1 | 0.96mi |
| 313 San Salvador Ave San Antonio, TX | 4.0 | 2.5 | 1240 | $1,395 | $1.12 | 45d | 1 | 0.96mi |
| 1518 S Walters St Unit 102 San Antonio, TX | 3.0 | 2.5 | 1180 | $1,400 | $1.19 | 6d | 1 | 0.97mi |
| 1627 Schley Ave San Antonio, TX | 3.0 | 1.0 | 1408 | $1,650 | $1.17 | 25d | 1 | 1.02mi |
| 139 San Salvador Ave Unit 103 San Antonio, TX | 2.0 | 2.5 | 1245 | $1,490 | $1.20 | 16d | 1 | 1.05mi |
| 838 Hammond Ave San Antonio, TX | 2.0 | 1.0 | 888 | $1,300 | $1.46 | 45d | 1 | 1.06mi |
| 4700 Stringfellow Dr San Antonio, TX | 1.0–2.0 | 1.0–2.0 | 807 | $950 | $1.18 | 0d | 6 | 1.15mi |
| 610 Pecan Valley Dr San Antonio, TX | 3.0 | 1.0 | 1287 | $1,650 | $1.28 | 45d | 1 | 1.16mi |
| 420 Clark Ave San Antonio, TX | 2.0 | 1.0 | 756 | $1,295 | $1.71 | 19d | 1 | 1.18mi |
| 311 Glamis Ave Unit 2 San Antonio, TX | 3.0 | 1.0 | 900 | $1,395 | $1.55 | 45d | 1 | 1.18mi |
| 311 Glamis Ave San Antonio, TX | 3.0 | 1.0 | 1100 | $1,195 | $1.09 | 0d | 1 | 1.18mi |
| 311 Glamis Ave Unit 1 San Antonio, TX | 3.0 | 2.0 | 1200 | $1,395 | $1.16 | 45d | 1 | 1.18mi |
| 512 Cooper St San Antonio, TX | 2.0 | 1.0 | 1116 | $1,295 | $1.16 | 25d | 1 | 1.23mi |
| 2407 S New Braunfels Ave Unit 3 San Antonio, TX | 2.0 | 1.0 | 800 | $825 | $1.03 | 45d | 1 | 1.23mi |
| 2407 S New Braunfels Ave Unit 3 San Antonio, TX | 2.0 | 1.0 | 800 | $825 | $1.03 | 25d | 1 | 1.23mi |
| 342 Vine St Unit B San Antonio, TX | 2.0 | 1.0 | 768 | $875 | $1.14 | 45d | 1 | 1.23mi |
| 342 Vine St San Antonio, TX | 2.0 | 1.0 | 768 | $995 | $1.30 | 25d | 1 | 1.23mi |
| 2219 S New Braunfels Ave San Antonio, TX | 2.0 | 1.0 | 952 | $1,050 | $1.10 | 25d | 1 | 1.25mi |
| 414 Stanfield Ave San Antonio, TX | 3.0 | 1.0 | 1250 | $1,300 | $1.04 | 45d | 1 | 1.25mi |
| 2335 Nopal St Unit 108 San Antonio, TX | 2.0 | 1.0 | 805 | $975 | $1.21 | 6d | 1 | 1.25mi |
| 242 Glamis Ave San Antonio, TX | 4.0 | 2.0 | 1464 | $1,900 | $1.30 | 12d | 1 | 1.25mi |
| 322 Vine St #102 San Antonio, TX | 3.0 | 2.5 | 1401 | $1,400 | $1.00 | 25d | 1 | 1.26mi |
| 125 Magendie St San Antonio, TX | 2.0 | 2.0 | 820 | $1,323 | $1.61 | 6d | 1 | 1.27mi |
| 1005 Essex St Unit 101 San Antonio, TX | 2.0 | 2.0 | 800 | $1,425 | $1.78 | 3d | 1 | 1.27mi |
| 1005 Essex St Unit 202 San Antonio, TX | 2.0 | 2.0 | 800 | $1,450 | $1.81 | 45d | 1 | 1.27mi |
Listing history 15 events
-
2026-06-21days on market $144,999 Active 248 DOM
-
2026-06-18days on market $144,999 Active 245 DOM
-
2026-06-17days on market $144,999 Active 244 DOM
-
2026-06-16days on market $144,999 Active 243 DOM
-
2026-06-15days on market $144,999 Active 242 DOM
-
2026-06-13days on market $144,999 Active 240 DOM
-
2026-06-09days on market $144,999 Active 236 DOM
-
2026-06-08days on market $144,999 Active 235 DOM
-
2026-06-07days on market $144,999 Active 234 DOM
-
2026-06-04days on market $144,999 Active 231 DOM
-
2026-06-03days on market $144,999 Active 230 DOM
-
2026-06-02days on market $144,999 Active 229 DOM
-
2026-06-01days on market $144,999 Active 228 DOM
-
2026-05-31days on market $144,999 Active 227 DOM
-
2025-10-16$144,999 New 263-char remark
Show marketing remark (263 chars)
3-bedroom, 2-bath home with a 1-car carport in a quiet San Antonio neighborhood. This single-story residence sits on a spacious 13,700 sq ft lot and offers comfortable living with easy access to local amenities. Great potential for first-time buyers or investors.
ⓘ Source: listings_history table (triggers on properties + properties_extension) + one-shot
backfill from property_details.listing_events for pre-trigger history.
Tax reassessment forecast TX · Resets to sale price
- Current annual tax
- $1,757 · $146/mo
- Projected year-2 tax
- $2,653 · $221/mo
- Expected delta
- +$896/yr (+$75/mo · 51.0%)
ⓘ Screening estimate from a state-policy table — verify with the county assessor before closing.
Climate risk First Street
- Flood 1/10 Low FEMA zone X (unshaded) · 0% chance over 30 yrs
- Wildfire 2/10 Low
- Heat 8/10 Severe 7 d/yr ≥108°F today · 22 d/yr by 30 yrs out
- Wind 8/10 Severe 80% chance of damaging wind over 30 yrs
- Air quality 2/10 Low 0 unhealthy d/yr today · 2 by 30 yrs out
Nearby sold comps map
Loading sold comps map…
Walkable amenities ~0.75 mi
Loading nearby amenities…
Taxation est. · year 1
- Rental income
- $17,031
- − Mortgage interest
- −$8,122
- − Property taxes
- −$1,757
- − Insurance
- −$725
- − Repairs & maintenance
- −$1,363
- − Management
- −$1,363
- − Depreciation
- −$4,218
- Taxable loss
- −$516
- Est. tax savings @ 24.0%
- +$124
- After-tax cash flow
- $1,972/yr
For passive investors: Depreciation is non-cash, so a rental often shows a tax loss while cash-flowing — sheltering income. Rental losses are passive: they offset passive income freely, and up to $25,000/yr can offset ordinary (W-2) income if you actively participate and your MAGI is under $100k (phasing out to $0 by $150k); unused losses carry forward. On sale, claimed depreciation is recaptured at up to 25%, and gains may owe capital-gains tax (a 1031 exchange can defer both). Figures are a year-1 estimate at your 24.0% rate — not tax advice; consult a CPA.
Schools (NCES district)
- District
- San Antonio ISD
- NCES district ID
- 4838730
- Math proficiency
- 12% ▼ -21.00%
- Reading proficiency
- 22% ▼ -7.00%
- Median HH income
- $30,952
- Composite
- 13.57/100
- National rank
- #9512
- State rank
- #805 of 826 in TX
Livability — San Antonio
- Score
- 80/100
- State rank
- #31
- US rank
- #1616
Category grades
Schools grade is shown separately in the Schools card above.
Census & demographics
- Census place
- San Antonio, TX
- County
- Bexar County · 1,990,555 people
- City population
- 1,806,925
- Metro
- San Antonio-New Braunfels, TX
- Population (ZIP)
- 34,940
- Household income
- $55,028
- Rent vs Own
- Severe rent burden
- 1708.0
Population outlook (Bexar County) Hauer SSP2
- Today (2025)
- 2,336,851 people
- By 2030
- 2,560,728 · +9.6%
- By 2040
- 3,020,569 · +29.3%
- By 2050
- 3,493,522 · +49.5%
- By 2075
- 4,668,459 · +99.8%
- By 2100
- 5,533,242 · +136.8%
Race, ethnicity, and origin ACS 2023
- Neighborhood character
- Predominantly Hispanic (83%)
- Race & ethnicity
- Hispanic / Latino 83% Two or more races 29% White 11% Black 4% Native American 2%
- Hispanic origin (detail)
- Mexican 72% Puerto Rican 2%
- Common ancestry
- Lithuanian 1%
- Foreign-born
- 12% · Canada
- Languages at home
- 55% English-only · Spanish 44%
Political lean MEDSL · Bexar
- 2024 margin
- Lean D (+9.8) · D 54.3% · R 44.6% · Other 1.1%
- 2008→2024 swing
- +4.2pp toward D · 2008: 5.6pp · 2024: 9.8pp
- All cycles
- 2024: D+9.8 2020: D+18.2 2016: D+13.5 2012: D+4.6 2008: D+5.6
Not yet ingested
- Civics
- —
Market trends
- HPI YoY
- ▼ -163.42%
- Current HPI
- 286.299
- Rent YoY
- ▲ 1.07%
- Metro
- San Antonio-New Braunfels, TX
- State GDP YoY
- ▲ 3.95%
- F500 in state
- 110
Industry mix (Fortune 500 HQ in TX)
| Industry | F500 HQs | Revenue |
|---|---|---|
| Energy | 16 | $1,198B |
|
||
| Technology | 5 | $198B |
|
||
| Engineering / Construction | 4 | $72B |
|
||
| Energy Services | 3 | $60B |
|
||
| Utilities | 3 | $41B |
|
||
| Healthcare | 2 | $330B |
|
||
Price history
1 event — show timeline
- 2025-10-16 Listed $144,999 LERA
Property tax history
+5.2%/yrLatest (2025): $1,757 · -55.4% YoY. Source: county tax records.
Cash-flow waterfall
monthlySold comps — $/sqft
last 12 mo · ≤1 miLoading sold comps…