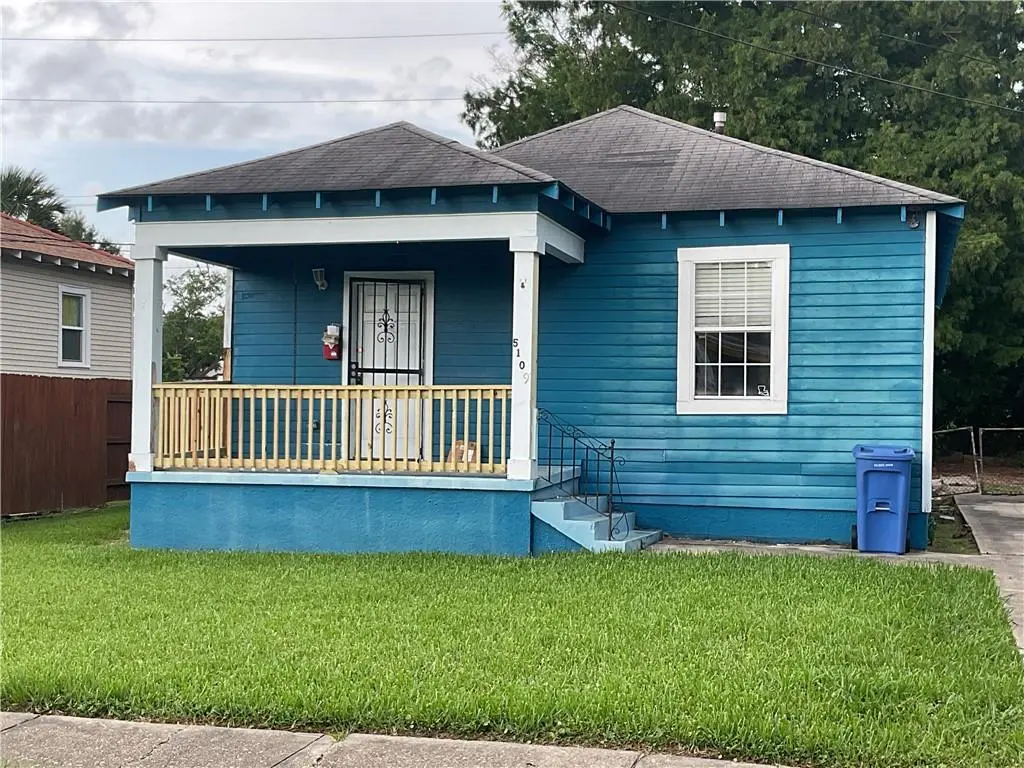
5109 Eastern St · New Orleans, LA
Flood risk 8/10 · Major
- FEMA flood zone
- X (shaded)
- Chance of flooding over 30 yrs
- 0.6%
- Est. flood insurance / yr
- $507 – $1,088
Fire risk 1/10 · Minimal
- Est. fire insurance / yr
- $1,269 – $2,357
Heat risk 10/10 · Severe
- Hot days now (above 107°F)
- 7 days/yr
- Hot days in 30 yrs
- 21 days/yr
Wind risk 10/10 · Severe
- Chance of severe wind over 30 yrs
- 99.0%
Air-quality risk 3/10 · Minor
- Unhealthy air days now
- 3 days/yr
- Unhealthy air days in 30 yrs
- 3 days/yr
Risk factors via First Street. Map © Google.
Why this score? — see what drove the B- grade
The composite is a weighted blend of 9 inputs, each scored 0–100. Each bar is that input's sub-score; the figure is the points it added to the 100-point composite (weight × sub-score).
- Cash flow +30.0/30.0
- 1% rule +10.0/10.0
- DSCR +10.0/10.0
- ARV discount +7.5/15.0
- Livability +4.0/5.0
- Condition / age +2.5/5.0
- Rent growth +2.3/5.0
- Schools +1.6/10.0
- Appreciation +0.0/10.0
$85,000
🖨 Deal sheet (PDF) 📄 Offer letter ✓ Due diligence
Listing remarks MLS
The Front Porch of this cottage is great area to relax and have room for visitors. To the right of the house is a long driveway the length of the house. Inside the front door is a living room with an arch to the dining room The kitchen leads to the very large rear yard. There is an area in the kitchen with hookups for washer and dryer. The full bath is located between the two bedrooms. The large back yard affords room for many outdoor activities.
Key facts
- Front porch
- Living room
- Arch to dining room
Tags
Property features AI
Exterior
- Parking: Driveway; Off-street parking
- Utilities: Public water; Public sewer
- Home design: Single-story home; Raised foundation
- Construction: Wood siding construction; Built with a raised foundation
- Exterior features: Front porch; Fence; Rectangular city lot (approx. 50 x 120)
Interior
- Kitchen: Range
- Bathrooms: 1 full bathroom
- Heating & cooling: Central heating (gas); Central air conditioning
- Interior features: 6 total rooms; Average condition
Neighborhood map
What this means for you Summary
Snapshot
- This is a 2-bed/2.0-bath single-family listed at $85k.
Deal economics
- At list price, monthly cash flow is $489 ($6k/yr) — positive.
- The deal already cash-flows at list — no discount required.
- Meets the 1% rule at list price ($2k rent vs $85k).
- Recommended offer: $84k (1.5% below list) — sets the bar for market timing.
- Cap rate 14.1% vs local median 4.4% in New Orleans — top-decile yield for the area; either an underpriced asset or a hidden risk that comps aren't pricing in. Stress-test before assuming the spread holds.
Location & tenants
- Location reads 81/100 on livability (#3 in LA, #1,383 nationally) — a professional / high-income tenant draw. Strengths: amenities A+, commute A+, health & safety A+; Watch: crime C-, employment D.
- Orleans Parish (urban): math 11% / reading 27% proficiency, ranked #69 of 98 in LA (top 70%) — low school quality limits family demand, transient renter base, plan for 1-2y turnover; 68% free/reduced lunch — lower-income household profile, screen leases tightly.
- Zoned schools: Benjamin Franklin Elem. Math And Science (math 12% / reading 23%, grade F, #479 of 646 statewide, top 75%, 747 students, 98% FRL, charter) — zoned schools average 98% FRL vs 68% district-wide (30 pts higher); higher-poverty schools than district average — tighter screening recommended.
- Market conditions: Rents soft (-0.6%/yr); 336 active listings in the ZIP; 40 comparable units currently listed for rent nearby; rentals at typical pace (median 25d on market — plan ~3-4 weeks tenant-placement turnaround); 710 units permitted in Orleans Parish in 2024 (244 in 5+ unit buildings).
- This rent runs 38% of the median local income ($49k/yr) — at the standard rent-burdened threshold; future hikes will face affordability resistance.
Forward outlook
- Local home prices are declining (-3.0%/yr); year-one equity from $588 of loan paydown is wiped out by about $3k of value loss. Plan a longer hold.
- Orleans County population projected at +61% by 2050 — long-run rental-demand tailwind backs the buy-and-hold thesis.
- At projected returns (-3.0% appreciation + 0.0% rent growth), your $24k cash investment doubles in ~6 years — after that, you're playing with house money.
Negotiation context
- It's been on market 16 days — a 2% lower offer ($84k) is reasonable based on typical stale-listing flexibility.
- 11 sale attempts since 27y ago with the ask held roughly flat each time — persistent listings suggest the price (not the market) is what's stuck; bring a comps-based counter.
Risks & watch-outs
- Watch-outs: property tax is 2.8% of price; flood insurance adds $66/mo.
- Climate carrying-cost: severe flood risk; severe wind risk, 99% chance of damaging wind over 30y; extreme-heat days projected 7→21/yr by 2055 (HVAC capex compounding) — expect insurance premiums to compound above CPI over the hold.
Questions for the listing agent
- Built in 1966 — when were the roof, HVAC, electrical panel, plumbing, and water heater last replaced?
- Property tax is high relative to price — has the assessment been appealed recently, and will the sale trigger a re-assessment?
- What's the actual annual flood-insurance premium (NFIP or private), and is the property in a SFHA with mandatory coverage?
- Is there a deadline driving the sale (1031 exchange, divorce, estate, relocation)? That informs how much negotiation room exists.
- What's the average days-on-market for RENTAL listings here right now (not sales)? A rising rental-DOM trend means longer vacancies and softer asking-rent achievability than the comps imply.
- What's the recent tenant-quality profile in this submarket — average credit score on applications, eviction rate, late-payment / NSF rate, and stable-employment percentage? A property-management company in the area should have these aggregated.
- How much new for-sale + rental construction is in the pipeline within 1–3 miles? Heavy new supply typically softens prices + rents 12–24 months out; constrained supply supports both.
Investment metrics
- 1% rule
- 1.84% ✓
- Cap rate
- 14.14%
- Cash-on-cash
- 28.01%
- DSCR
- 2.25
- GRM
- 4.5
CMA / ARV
- ARV (on-the-fly)
- $174,798
- Comps found
- 12
Show comp detail 12 sales within ~0.75 mi
| Address | Dist | Beds/Ba | Sqft | Sold | Price | $/sf | Match |
|---|---|---|---|---|---|---|---|
| 2757 Dreux Ave | 0.12mi | 2/1.0 | 1,140 (+8%) | 7mo | $145,000 | $127 | 71 |
| 5607 Baccich St | 0.38mi | 2/2.0 | 1,063 (+1%) | 16mo | $190,000 | $179 | 68 |
| 4635 Eastern St | 0.32mi | 2/2.0 | 1,120 (+6%) | 13mo | $225,000 | $201 | 63 |
| 4767 Painters St | 0.38mi | 2/1.0 | 960 (-9%) | 1mo | $217,795 | $227 | 63 |
| 4712 Lafaye St | 0.27mi | 2/1.0 | 1,157 (+10%) | 9mo | $217,500 | $188 | 59 |
| 4951 Feliciana Dr | 0.39mi | 3/1.0 (+1) | 1,118 (+6%) | 4mo | $102,268 | $91 | 59 |
| 4033 Odin St | 0.44mi | 3/2.0 (+1) | 1,124 (+7%) | 10mo | $200,000 | $178 | 54 |
| 5108 Feliciana Dr | 0.36mi | 3/1.5 (+1) | 1,147 (+9%) | 13mo | $129,000 | $112 | 50 |
| 5923 Painters St | 0.70mi | 3/2.0 (+1) | 1,125 (+7%) | 3mo | $159,900 | $142 | 48 |
| 2856 Hiawatha St | 0.74mi | 2/2.0 | 1,102 (+5%) | 12mo | $170,000 | $154 | 48 |
| 2769 Pressburg St | 0.61mi | 2/2.0 | 1,202 (+14%) | 8mo | $200,000 | $166 | 42 |
| 2516 Wisteria St | 0.74mi | 2/1.0 | 1,143 (+8%) | 10mo | $160,000 | $140 | 39 |
Match score weights: distance 35% · size 25% · config 20% · recency 20%. Top-matched comps best support the ARV.
Projected returns pro-forma
-3.0% appreciation · 0.0% rent growth · sell at horizon
- IRR
- 14.2%
- Equity multiple
- 1.54×
- Total profit
- $12,920
- Equity at exit
- $12,674
- IRR
- 20.2%
- Equity multiple
- 2.44×
- Total profit
- $34,158
- Equity at exit
- $7,349
Cash invested: $23,800 (down + closing). Projections, not guarantees.
Landlord ↔ Tenant lean methodology
- Overall (STATE)
- 90 Strongly Landlord-Friendly
- State Louisiana
- 90 Strongly Landlord-Friendly · R+12
- County
- — inherits STATE
- City
- — inherits STATE
ZIP-level market 70122
- Rents YoY
- -0.6%
- Active inventory
- 336
- Price-to-rent
- 4.5×
Monthly cashflow live
- Estimated rent
- $1,563 high interval (Pro) →
- Mortgage (P&I)
- −$446
- Tax from tax record
- −$198 /mo · $2,372/yr
- Insurance
- −$35
- Flood insurance flood zone
- −$66 /mo · $798/yr
- HOA
- −$0
- Vacancy / Maint / Mgmt
- −$328
- Net cashflow
- $489
Break-even live
Sensitivity live
| Price | -10% $537 | -5% $513 | +0% $489 | +5% $465 | +10% $441 |
|---|---|---|---|---|---|
| Rent | -10% $366 | -5% $427 | +0% $489 | +5% $551 | +10% $613 |
| Rate | -1.0pp $532 | -0.5pp $511 | base $489 | +0.5pp $467 | +1.0pp $445 |
UW: 25.0% down · 7.5% · 30yr · 1.5% tax · 5.0% vac · 8.0% maint · 8.0% mgmt
Financing live
Cash to close
- Down payment
- $21,250
- Closing costs
- $2,550
- Reserves months
- —
- Total cash needed
- —
Loan-product check · same deal, 3 products live
Conventional
25% down · 7.5% · 30yr
- Down + closing
- —
- Monthly P&I
- —
- Monthly cashflow
- —
- DSCR
- —
- Eligible?
- —
Personal DTI + credit; lowest rate.
DSCR
20% down · 8.5% · 30yr
- Down + closing
- —
- Monthly P&I
- —
- Monthly cashflow
- —
- DSCR
- —
- Eligible?
- —
No personal income docs; deal must DSCR.
Hard money
10% down · 12.0% · 12mo
- Down + closing
- —
- Monthly P&I
- —
- Monthly cashflow
- —
- DSCR
- —
- Eligible?
- —
Short-term bridge; refi at stabilization.
Rent comps 40 comps
| Address | Beds | Baths | Sqft | Rent | $/sqft | DOM | Units | Dist |
|---|---|---|---|---|---|---|---|---|
| 4951 Eastern St New Orleans, LA | 2.0 | 1.0 | 850 | $1,350 | $1.59 | 25d | 1 | 0.06mi |
| 4936 Baccich St New Orleans, LA | 3.0 | 1.0 | 1053 | $1,700 | $1.61 | 25d | 1 | 0.11mi |
| 4767 Lafaye St New Orleans, LA | 3.0 | 2.0 | 1469 | $2,000 | $1.36 | 25d | 1 | 0.20mi |
| 4681 Eastern St New Orleans, LA | 2.0 | 1.0 | 1100 | $1,400 | $1.27 | 17d | 1 | 0.27mi |
| 4926 Venus St Unit 4926 New Orleans, LA | 2.0 | 1.0 | 800 | $1,200 | $1.50 | 4d | 1 | 0.32mi |
| 5401 Montegut Dr New Orleans, LA | 1.0 | 1.0 | 1000 | $1,200 | $1.20 | 17d | 1 | 0.44mi |
| 5905 Lafaye St New Orleans, LA | 3.0 | 1.0 | 911 | $1,700 | $1.87 | 25d | 1 | 0.61mi |
| 2754 Jasmine St New Orleans, LA | 3.0 | 1.0 | 1020 | $1,750 | $1.72 | 25d | 1 | 0.70mi |
| 4722 Mithra St New Orleans, LA | 3.0 | 1.5 | 1295 | $1,600 | $1.24 | 25d | 1 | 0.71mi |
| 5519 Mandeville St New Orleans, LA | 3.0 | 1.0 | 1125 | $1,650 | $1.47 | 4d | 1 | 0.71mi |
| 2844 Hiawatha St New Orleans, LA | 2.0 | 1.0 | 975 | $1,475 | $1.51 | 25d | 1 | 0.73mi |
| 6036 Franklin Ave New Orleans, LA | 2.0 | 1.0 | 898 | $1,200 | $1.34 | 18d | 1 | 0.77mi |
| 4023 Franklin Ave New Orleans, LA | 3.0 | 2.0 | 1000 | $1,700 | $1.70 | 4d | 1 | 0.78mi |
| 2671 Gladiolus St Unit 2669 New Orleans, LA | 2.0 | 1.0 | 830 | $1,250 | $1.51 | 25d | 1 | 0.79mi |
| 4618 Marigny St New Orleans, LA | 3.0 | 1.0 | 1320 | $1,900 | $1.44 | 25d | 1 | 0.79mi |
| 4616 Marigny St New Orleans, LA | 2.0 | 1.0 | 1020 | $1,750 | $1.72 | 22d | 1 | 0.79mi |
| 5925 Saint Roch Ave New Orleans, LA | 2.0 | 1.0 | 1000 | $1,550 | $1.55 | 18d | 1 | 0.80mi |
| 2650 Gladiolus St New Orleans, LA | 2.0 | 1.0 | 900 | $1,600 | $1.78 | 25d | 1 | 0.82mi |
| 6226 Lafaye St New Orleans, LA | 2.0 | 2.0 | 1137 | $2,600 | $2.29 | 45d | 1 | 0.87mi |
| 6226 Lafaye St New Orleans, LA | 2.0 | 2.0 | 1137 | $2,600 | $2.29 | 13d | 1 | 0.87mi |
| 6222 Arts St Unit 6226 New Orleans, LA | 2.0 | 1.5 | 1120 | $1,250 | $1.12 | 25d | 1 | 0.94mi |
| 2425 Jonquil St New Orleans, LA | 2.0 | 2.0 | 1038 | $1,500 | $1.45 | 25d | 1 | 0.94mi |
| 2512 Mexico St New Orleans, LA | 3.0 | 2.0 | 975 | $1,550 | $1.59 | 25d | 1 | 0.95mi |
| 2312 Madrid St New Orleans, LA | 2.0 | 1.0 | 1100 | $1,475 | $1.34 | 25d | 1 | 0.95mi |
| 2700 Clover St New Orleans, LA | 2.0 | 1.0 | 800 | $1,250 | $1.56 | 25d | 1 | 0.97mi |
| 2702 Clover St New Orleans, LA | 2.0 | 2.0 | 880 | $1,300 | $1.48 | 25d | 1 | 0.98mi |
| 5332 Pasteur Blvd New Orleans, LA | 1.0 | 1.0 | 800 | $1,000 | $1.25 | 12d | 1 | 0.98mi |
| 5747 Pauline Dr New Orleans, LA | 3.0 | 1.0 | 1300 | $1,400 | $1.08 | 13d | 1 | 1.00mi |
| 5718 Vermillion Blvd Unit A New Orleans, LA | 3.0 | 1.0 | 1300 | $2,000 | $1.54 | 25d | 1 | 1.02mi |
| 5546 Pasteur Blvd Unit A New Orleans, LA | 3.0 | 1.0 | 1200 | $1,400 | $1.17 | 25d | 1 | 1.04mi |
| 5723 Pasteur Blvd New Orleans, LA | 3.0 | 2.0 | 1150 | $1,700 | $1.48 | 18d | 1 | 1.05mi |
| 5151 Saint Anthony Ave New Orleans, LA | 3.0 | 2.0 | 1200 | $1,795 | $1.50 | 17d | 1 | 1.05mi |
| 2558 Acacia St New Orleans, LA | 2.0 | 1.0 | 900 | $1,500 | $1.67 | 25d | 1 | 1.06mi |
| 6009 Vermillion Blvd Unit B New Orleans, LA | 1.0 | 1.0 | 700 | $950 | $1.36 | 3d | 1 | 1.08mi |
| 6530 Peoples Ave New Orleans, LA | 3.0 | 2.0 | 1200 | $1,800 | $1.50 | 25d | 1 | 1.08mi |
| 2701 03 Frankfort St New Orleans, LA | 3.0 | 1.0 | 1100 | $1,850 | $1.68 | 25d | 1 | 1.09mi |
| 4736 Saint Anthony Ave New Orleans, LA | 3.0 | 1.0 | 1100 | $1,800 | $1.64 | 17d | 1 | 1.12mi |
| 5322 Saint Anthony Ave New Orleans, LA | 3.0 | 2.0 | 1192 | $2,000 | $1.68 | 17d | 1 | 1.13mi |
| 6009 Pasteur Blvd New Orleans, LA | 3.0 | 2.0 | 1250 | $1,785 | $1.43 | 25d | 1 | 1.13mi |
| 2508 Myrtle St New Orleans, LA | 1.0 | 1.0 | 1100 | $1,250 | $1.14 | 25d | 1 | 1.13mi |
Listing history 11 events
-
2026-06-21days on market $85,000 Active 16 DOM
-
2026-06-18days on market $85,000 Active 13 DOM
-
2026-06-17days on market $85,000 Active 12 DOM
-
2026-06-16days on market $85,000 Active 11 DOM
-
2026-06-15days on market $85,000 Active 10 DOM
-
2026-06-13days on market $85,000 Active 8 DOM
-
2026-06-10days on market $85,000 Active 5 DOM
-
2026-06-09days on market $85,000 Active 4 DOM
-
2026-06-08days on market $85,000 Active 3 DOM
-
2026-06-07remarks 450-char remark
-
2026-06-07$85,000 Active 2 DOM
ⓘ Source: listings_history table (triggers on properties + properties_extension) + one-shot
backfill from property_details.listing_events for pre-trigger history.
Tax reassessment forecast LA · Resets to sale price
- Current annual tax
- $2,372 · $198/mo
- Projected year-2 tax
- $2,372 · $198/mo
- Expected delta
- $0/yr ($0/mo · 0.0%)
ⓘ Screening estimate from a state-policy table — verify with the county assessor before closing.
Climate risk First Street
- Flood 8/10 Severe FEMA zone X (shaded) · 60% chance over 30 yrs
- Wildfire 1/10 Low
- Heat 10/10 Extreme 7 d/yr ≥107°F today · 21 d/yr by 30 yrs out
- Wind 10/10 Extreme 99% chance of damaging wind over 30 yrs
- Air quality 3/10 Moderate 3 unhealthy d/yr today · 3 by 30 yrs out
Nearby sold comps map
Loading sold comps map…
Walkable amenities ~0.75 mi
Loading nearby amenities…
Taxation est. · year 1
- Rental income
- $18,751
- − Mortgage interest
- −$4,761
- − Property taxes
- −$2,372
- − Insurance
- −$1,222
- − Repairs & maintenance
- −$1,500
- − Management
- −$1,500
- − Depreciation
- −$2,473
- Taxable income
- $4,922
- Est. tax owed @ 24.0%
- −$1,181
- After-tax cash flow
- $4,688/yr
For passive investors: Depreciation is non-cash, so a rental often shows a tax loss while cash-flowing — sheltering income. Rental losses are passive: they offset passive income freely, and up to $25,000/yr can offset ordinary (W-2) income if you actively participate and your MAGI is under $100k (phasing out to $0 by $150k); unused losses carry forward. On sale, claimed depreciation is recaptured at up to 25%, and gains may owe capital-gains tax (a 1031 exchange can defer both). Figures are a year-1 estimate at your 24.0% rate — not tax advice; consult a CPA.
Schools (NCES district)
- District
- Orleans Parish
- NCES district ID
- 2201170
- Math proficiency
- 11% ▼ -52.00%
- Reading proficiency
- 27% ▼ -46.00%
- Median HH income
- $37,011
- Composite
- 15.78/100
- National rank
- #9271
- State rank
- #69 of 98 in LA
Livability — New Orleans
- Score
- 81/100
- State rank
- #3
- US rank
- #1383
Category grades
Schools grade is shown separately in the Schools card above.
Census & demographics
- Census place
- New Orleans, LA
- County
- Orleans Parish · 338,817 people
- City population
- 338,817
- Metro
- New Orleans-Metairie, LA
- Population (ZIP)
- 35,253
- Household income
- $49,455
- Rent vs Own
- Severe rent burden
- 2150.0
Population outlook (Orleans County) Hauer SSP2
- Today (2025)
- 513,025 people
- By 2030
- 575,781 · +12.2%
- By 2040
- 700,174 · +36.5%
- By 2050
- 826,541 · +61.1%
- By 2075
- 1,123,374 · +119.0%
- By 2100
- 1,355,609 · +164.2%
Race, ethnicity, and origin ACS 2023
- Neighborhood character
- Predominantly Black (69%)
- Race & ethnicity
- Black 69% White 18% Two or more races 7% Hispanic / Latino 6% Asian 1%
- Hispanic origin (detail)
- Mexican 1%
- Common ancestry
- Lithuanian 4% Italian 2% Slovak 1%
- Foreign-born
- 4% · Canada, China
- Languages at home
- 92% English-only · Spanish 5% Chinese 1% French/Haitian/Cajun 1%
Political lean MEDSL · Orleans
- 2024 margin
- Solid D (+67.0) · D 82.2% · R 15.2% · Other 2.7%
- 2008→2024 swing
- +6.7pp toward D · 2008: 60.3pp · 2024: 67.0pp
- All cycles
- 2024: D+67.0 2020: D+68.2 2016: D+66.2 2012: D+62.5 2008: D+60.3
Not yet ingested
- Civics
- —
Market trends
- HPI YoY
- ▼ -222.37%
- Current HPI
- 231.9921
- Rent YoY
- ▼ -0.61%
- Metro
- New Orleans-Metairie, LA
- State GDP YoY
- ▲ 3.29%
- F500 in state
- 10
Industry mix (Fortune 500 HQ in LA)
| Industry | F500 HQs | Revenue |
|---|---|---|
| Telecommunications | 2 | $23B |
|
||
| Utilities | 1 | $12B |
|
||
| Wholesale / Distribution | 1 | $5B |
|
||
| Advertising | 1 | $2B |
|
||
Price history
+112.5% since first listed20 events — show timeline
- 2026-05-29 Listed $85,000 GSREIN
- 2026-05-29 Listed $85,000 AcadianaMLS
- 2023-01-11 Listed $179,000 AcadianaMLS
- 2022-06-22 Price Changed $179,000 GSREIN
- 2022-05-13 Listed $179,000 AcadianaMLS
- 2016-06-15 Sold (MLS) $110,000 GSREIN
- 2016-05-13 Pending — GSREIN
- 2016-04-06 Price Changed $119,900 GSREIN
- 2016-02-25 Listing Removed — GSREIN
- 2016-02-25 Relisted — GSREIN
- 2016-02-25 Listed — GSREIN
- 2016-02-24 Listed $119,900 AcadianaMLS
- 2015-12-09 Price Changed $127,000 GSREIN
- 2015-10-29 Listed $139,000 GSREIN
- 2015-10-29 Listed $127,000 AcadianaMLS
- 1999-05-19 Sold (Public Records) $48,000 Public Records
- 1999-05-19 Sold (MLS) $48,000 GSREIN
- 1999-03-15 Listed $52,500 AcadianaMLS
- 1999-03-15 Listed $52,500 GSREIN
- 1991-06-27 Sold (Public Records) $40,000 Public Records
Property tax history
+3.9%/yrLatest (2026): $2,372 · +1.1% YoY. Source: county tax records.
Cash-flow waterfall
monthlySold comps — $/sqft
last 12 mo · ≤1 miLoading sold comps…