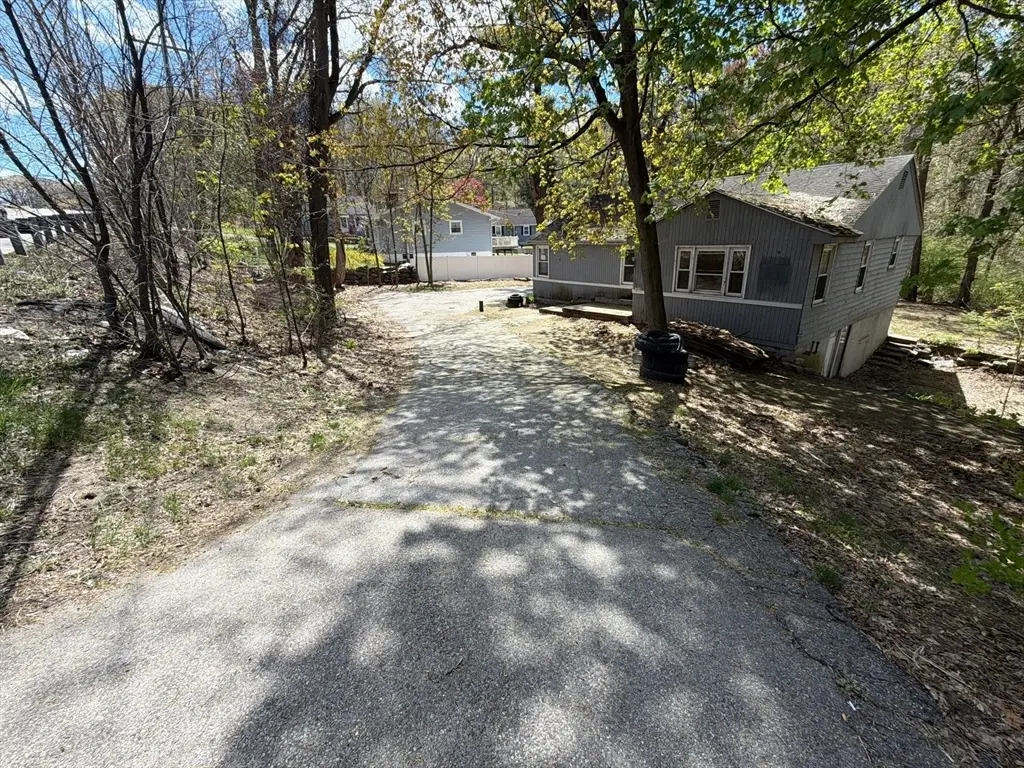
108 Worcester Providence Tpke · Millbury, MA
Flood risk 1/10 · Minimal
- FEMA flood zone
- X (unshaded)
- Chance of flooding over 30 yrs
- 0.0%
- Est. flood insurance / yr
- $507 – $1,088
Fire risk 2/10 · Minimal
- Est. fire insurance / yr
- $915 – $1,699
Heat risk 4/10 · Minor
- Hot days now (above 93°F)
- 7 days/yr
- Hot days in 30 yrs
- 15 days/yr
Wind risk 6/10 · Moderate
- Chance of severe wind over 30 yrs
- 27.0%
Air-quality risk 2/10 · Minimal
- Unhealthy air days now
- 1 days/yr
- Unhealthy air days in 30 yrs
- 2 days/yr
Risk factors via First Street. Map © Google.
Why this score? — see what drove the B- grade
The composite is a weighted blend of 9 inputs, each scored 0–100. Each bar is that input's sub-score; the figure is the points it added to the 100-point composite (weight × sub-score).
- Cash flow +30.0/30.0
- DSCR +10.0/10.0
- 1% rule +9.2/10.0
- ARV discount +7.5/15.0
- Schools +3.7/10.0
- Rent growth +2.5/5.0
- Livability +2.5/5.0
- Condition / age +2.5/5.0
- Appreciation +0.0/10.0
$192,000
🖨 Deal sheet 📄 Offer letter ✓ Due diligence
Key facts
- Ample outdoor space
- Generously sized lot
- Desirable location
Tags
Property features AI
Finance
- Other: Listing status: Active; Address: 108 Worcester Providence Tpke, Millbury MA 01527; Tax info provided (not included per instructions)
- Financial info: Details not provided
- HOA & community: Not a senior community
Exterior
- Parking: 2 open parking spaces (2 total parking spaces)
- Security: Details not provided
- Utilities: Private water; Private sewer
- Home design: Single-family residence; Above-grade finished living area approximately 1068
- Construction: Built approximately (year from public records); Details not provided for materials, roof, or foundation
- Exterior features: Lot approximately 0.24 acre; Use GPS for best navigation
Interior
- Kitchen: Details not provided
- Bedrooms: Details not provided
- Flooring: Details not provided
- Bathrooms: 1 full bathroom
- Heating & cooling: Forced air heating (oil); Cooling present (type listed as Other)
- Interior features: Total of 5 rooms; One fireplace
- Laundry & utility: Details not provided
Neighborhood map
What this means for you Summary
Snapshot
- This is a 3-bed/1.0-bath single-family listed at $192k.
Deal economics
- At list price, monthly cash flow is $826 ($10k/yr) — positive.
- The deal already cash-flows at list — no discount required.
- Meets the 1% rule at list price ($3k rent vs $192k).
- Recommended offer: $186k (3.0% below list) — sets the bar for market timing.
Location & tenants
- Location reads: area grade B — affects rentability + tenant quality, not the cash-flow math above.
- Millbury (suburban): math 35% / reading 45% proficiency, ranked #191 of 302 in MA (top 63%) — families likely to look elsewhere, expect single-tenant / working-renter base with shorter leases.
- Market conditions: 23 active listings in the ZIP; 6 comparable units currently listed for rent nearby; rentals at typical pace (median 14d on market — plan ~3-4 weeks tenant-placement turnaround); high-income renter base; 2,293 units permitted in Worcester County in 2024 (1,205 in 5+ unit buildings).
Forward outlook
- Local home prices are declining (-3.0%/yr); year-one equity from $1k of loan paydown is wiped out by about $6k of value loss. Plan a longer hold.
- At projected returns (-3.0% appreciation + 3.0% rent growth), your $54k cash investment doubles in ~7 years — after that, you're playing with house money.
Negotiation context
- It's been on market 44 days — a 3% lower offer ($186k) is reasonable based on typical stale-listing flexibility.
- Current owner paid $80k; list at $192k implies a 142% gain — meaningful room to come down on a strong offer.
Risks & watch-outs
- Watch-outs: built in 1955 — expect roof / HVAC / electrical / plumbing capex.
- Climate carrying-cost: major wind risk, 27% chance of damaging wind over 30y — expect insurance premiums to compound above CPI over the hold.
Questions for the listing agent
- It's been on market 44 days. Have you received any prior offers? Is the seller open to a 3% concession, seller financing, or rate buy-down credit?
- Built in 1955 — when were the roof, HVAC, electrical panel, plumbing, and water heater last replaced?
- Is there a deadline driving the sale (1031 exchange, divorce, estate, relocation)? That informs how much negotiation room exists.
- What's the average days-on-market for RENTAL listings here right now (not sales)? A rising rental-DOM trend means longer vacancies and softer asking-rent achievability than the comps imply.
- What's the recent tenant-quality profile in this submarket — average credit score on applications, eviction rate, late-payment / NSF rate, and stable-employment percentage? A property-management company in the area should have these aggregated.
- How much new for-sale + rental construction is in the pipeline within 1–3 miles? Heavy new supply typically softens prices + rents 12–24 months out; constrained supply supports both.
Investment metrics
- 1% rule
- 1.42% ✓
- Cap rate
- 11.45%
- Cash-on-cash
- 18.43%
- DSCR
- 1.82
- GRM
- 5.9
CMA / ARV
- ARV (median comp)
- $415,147
- List price
- $192,000
- Delta
- -53.75%
- Verdict
- UNDERPRICED
- Comps
- 20 within 1.0 mi
Show comp detail 10 sales within ~0.75 mi
| Address | Dist | Beds/Ba | Sqft | Sold | Price | $/sf | Match |
|---|---|---|---|---|---|---|---|
| 42 Sycamore St | 0.28mi | 3/1.0 | 1,040 (-3%) | 1mo | $480,000 | $462 | 82 |
| 8 Sycamore Cir | 0.37mi | 3/1.0 | 1,100 (+3%) | 2mo | $415,000 | $377 | 76 |
| 5 Louis Ballard | 0.61mi | 3/1.0 | 1,032 (-3%) | 1mo | $465,000 | $451 | 65 |
| 22 Elm Ct | 0.30mi | 3/2.0 | 1,104 (+3%) | 16mo | $410,000 | $371 | 63 |
| 16 Elm Ct | 0.36mi | 3/1.0 | 936 (-12%) | 7mo | $430,000 | $459 | 57 |
| 2 Leslie Ln | 0.28mi | 3/1.0 | 1,194 (+12%) | 18mo | $465,000 | $389 | 52 |
| 40 River St | 0.70mi | 2/1.0 (-1) | 1,114 (+4%) | 5mo | $292,000 | $262 | 51 |
| 77 W Main St | 0.33mi | 3/1.0 | 961 (-10%) | 21mo | $290,500 | $302 | 51 |
| 10 Herricks Ln | 0.28mi | 3/1.0 | 1,190 (+11%) | 23mo | $325,000 | $273 | 48 |
| 4 Louis Ballard Ln | 0.64mi | 3/1.0 | 936 (-12%) | 17mo | $430,000 | $459 | 35 |
Match score weights: distance 35% · size 25% · config 20% · recency 20%. Top-matched comps best support the ARV.
Projected returns pro-forma
-3.0% appreciation · 3.0% rent growth · sell at horizon
- IRR
- 10.1%
- Equity multiple
- 1.40×
- Total profit
- $21,510
- Equity at exit
- $28,628
- IRR
- 19.2%
- Equity multiple
- 2.61×
- Total profit
- $86,601
- Equity at exit
- $16,601
Cash invested: $53,760 (down + closing). Projections, not guarantees.
Landlord ↔ Tenant lean methodology
- Overall (STATE)
- 20 Strongly Tenant-Friendly
- State Massachusetts
- 20 Strongly Tenant-Friendly · D+15
- County
- — inherits STATE
- City
- — inherits STATE
ZIP-level market 01527
- Home prices YoY
- -29.8%
- Active inventory
- 23
- Price-to-rent
- 5.9×
Monthly cashflow live
- Estimated rent
- $2,722 high interval (Pro) →
- Mortgage (P&I)
- −$1,007
- Tax from tax record
- −$238 /mo · $2,857/yr
- Insurance
- −$80
- HOA
- −$0
- Vacancy / Maint / Mgmt
- −$572
- Net cashflow
- $826
Break-even live
UW: 25.0% down · 7.5% · 30yr · 1.5% tax · 5.0% vac · 8.0% maint · 8.0% mgmt
Financing live
Cash to close
- Down payment
- $48,000
- Closing costs
- $5,760
- Reserves months
- —
- Total cash needed
- —
Loan-product check · same deal, 3 products live
Conventional
25% down · 7.5% · 30yr
- Down + closing
- —
- Monthly P&I
- —
- Monthly cashflow
- —
- DSCR
- —
- Eligible?
- —
Personal DTI + credit; lowest rate.
DSCR
20% down · 8.5% · 30yr
- Down + closing
- —
- Monthly P&I
- —
- Monthly cashflow
- —
- DSCR
- —
- Eligible?
- —
No personal income docs; deal must DSCR.
Hard money
10% down · 12.0% · 12mo
- Down + closing
- —
- Monthly P&I
- —
- Monthly cashflow
- —
- DSCR
- —
- Eligible?
- —
Short-term bridge; refi at stabilization.
Rent comps 6 comps
| Address | Beds | Baths | Sqft | Rent | $/sqft | DOM | Units | Dist |
|---|---|---|---|---|---|---|---|---|
| 26 High St Unit A Millbury, MA | 2.0 | 1.0 | 700 | $1,900 | $2.71 | 23d | 1 | 0.46mi |
| 35 Beach St Unit B Millbury, MA | 2.0 | 1.0 | 1000 | $2,290 | $2.29 | 14d | 1 | 0.71mi |
| 65 Canal St Millbury, MA | 1.0–2.0 | 1.0–2.0 | 855 | $2,700 | $3.16 | 14d | 9 | 0.93mi |
| 24 Miles St Unit 1 Millbury, MA | 3.0 | 1.0 | 1248 | $2,875 | $2.30 | 14d | 1 | 0.95mi |
| 3 Orchard St Unit A Millbury, MA | 2.0 | 1.0 | 1237 | $2,500 | $2.02 | 21d | 1 | 1.12mi |
| 7 Cobblestone Village Way Millbury, MA | 1.0–2.0 | 1.0–2.0 | 1238 | $3,100 | $2.50 | 14d | 4 | 1.19mi |
Listing history 16 events
-
2026-06-18days on market $192,000 Active 44 DOM
-
2026-06-17days on market $192,000 Active 43 DOM
-
2026-06-15days on market $192,000 Active 41 DOM
-
2026-06-14days on market $192,000 Active 39 DOM
-
2026-06-10days on market $192,000 Active 36 DOM
-
2026-06-09days on market $192,000 Active 35 DOM
-
2026-06-08statusdays on market $192,000 Active 34 DOM
-
2026-06-07pricestatusdays on market $192,000 Price Changed 33 DOM
-
2026-06-03days on market $208,000 Active 29 DOM
-
2026-06-02days on market $208,000 Active 28 DOM
-
2026-06-01days on market $208,000 Active 27 DOM
-
2026-05-31days on market $208,000 Active 26 DOM
-
2026-05-31days on market $208,000 Active 25 DOM
-
2026-05-05$208,000 New 682-char remark
-
1998-12-18soldstatus $79,500
-
1989-12-01soldstatus $91,500
ⓘ Source: listings_history table (triggers on properties + properties_extension) + one-shot
backfill from property_details.listing_events for pre-trigger history.
Tax reassessment forecast MA · Partial reset (capped growth)
- Current annual tax
- $2,857 · $238/mo
- Projected year-2 tax
- $2,857 · $238/mo
- Expected delta
- $0/yr ($0/mo · 0.0%)
ⓘ Screening estimate from a state-policy table — verify with the county assessor before closing.
Climate risk First Street
- Flood 1/10 Low FEMA zone X (unshaded) · 0% chance over 30 yrs
- Wildfire 2/10 Low
- Heat 4/10 Moderate 7 d/yr ≥93°F today · 15 d/yr by 30 yrs out
- Wind 6/10 Major 27% chance of damaging wind over 30 yrs
- Air quality 2/10 Low 1 unhealthy d/yr today · 2 by 30 yrs out
Nearby sold comps map
Loading sold comps map…
Walkable amenities ~0.75 mi
Loading nearby amenities…
Taxation est. · year 1
- Rental income
- $32,667
- − Mortgage interest
- −$10,755
- − Property taxes
- −$2,857
- − Insurance
- −$960
- − Repairs & maintenance
- −$2,613
- − Management
- −$2,613
- − Depreciation
- −$5,585
- Taxable income
- $7,282
- Est. tax owed @ 24.0%
- −$1,748
- After-tax cash flow
- $8,159/yr
For passive investors: Depreciation is non-cash, so a rental often shows a tax loss while cash-flowing — sheltering income. Rental losses are passive: they offset passive income freely, and up to $25,000/yr can offset ordinary (W-2) income if you actively participate and your MAGI is under $100k (phasing out to $0 by $150k); unused losses carry forward. On sale, claimed depreciation is recaptured at up to 25%, and gains may owe capital-gains tax (a 1031 exchange can defer both). Figures are a year-1 estimate at your 24.0% rate — not tax advice; consult a CPA.
Schools (NCES district)
- District
- Millbury
- NCES district ID
- 2507890
- Math proficiency
- 35% ▼ -6.00%
- Reading proficiency
- 45% ▬ 0.00%
- Median HH income
- $71,881
- Composite
- 36.55/100
- National rank
- #4640
- State rank
- #191 of 302 in MA
Livability — Millbury
No livability data for this city. (Only ~50 U.S. cities are tracked.)
Census & demographics
- County
- Worcester County · 487,911 people
- City population
- 13,961
- Metro
- Worcester, MA-CT
- Population (ZIP)
- 13,961
- Household income
- $118,790
- Rent vs Own
- Severe rent burden
- 238.0
Population outlook (Worcester County) Hauer SSP2
- Today (2025)
- 850,858 people
- By 2030
- 860,403 · +1.1%
- By 2040
- 869,902 · +2.2%
- By 2050
- 869,110 · +2.1%
- By 2075
- 870,120 · +2.3%
- By 2100
- 829,703 · -2.5%
Race, ethnicity, and origin ACS 2023
- Neighborhood character
- Predominantly White (83%)
- Race & ethnicity
- White 83% Two or more races 10% Hispanic / Latino 5% Asian 5%
- Hispanic origin (detail)
- Dominican 1%
- Common ancestry
- Lithuanian 12% Romanian 9% Russian 3%
- Foreign-born
- 9% · Canada
- Languages at home
- 90% English-only · Other Indo-European 6% Spanish 2% Russian/Polish/Slavic 1%
Political lean MEDSL · Worcester
- 2024 margin
- D (+10.0) · D 53.9% · R 43.9% · Other 2.2%
- 2008→2024 swing
- -3.8pp toward R · 2008: 13.8pp · 2024: 10.0pp
- All cycles
- 2024: D+10.0 2020: D+17.8 2016: D+10.5 2012: D+9.2 2008: D+13.8
Not yet ingested
- Civics
- —
Market trends
- HPI YoY
- ▼ -114.98%
- Current HPI
- 271.2616
- Rent YoY
- —
- Metro
- Worcester, MA-CT
- State GDP YoY
- ▲ 2.28%
- F500 in state
- 38
Industry mix (Fortune 500 HQ in MA)
| Industry | F500 HQs | Revenue |
|---|---|---|
| Technology | 3 | $17B |
|
||
| Insurance | 2 | $84B |
|
||
| Retail | 2 | $76B |
|
||
| Life Sciences | 1 | $43B |
|
||
| Energy Technology | 1 | $31B |
|
||
| Aerospace / Defense | 1 | $18B |
|
||
Price history
+109.8% since first listed4 events — show timeline
- 2026-06-04 Price Changed $192,000 MLS PIN
- 2026-05-05 Listed $208,000 MLS PIN
- 1998-12-18 Sold (Public Records) $79,500 Public Records
- 1989-12-01 Sold (Public Records) $91,500 Public Records
Property tax history
+3.1%/yrLatest (2023): $2,857 · +2.6% YoY. Source: county tax records.
Cash-flow waterfall
monthlySold comps — $/sqft
last 12 mo · ≤1 miLoading sold comps…