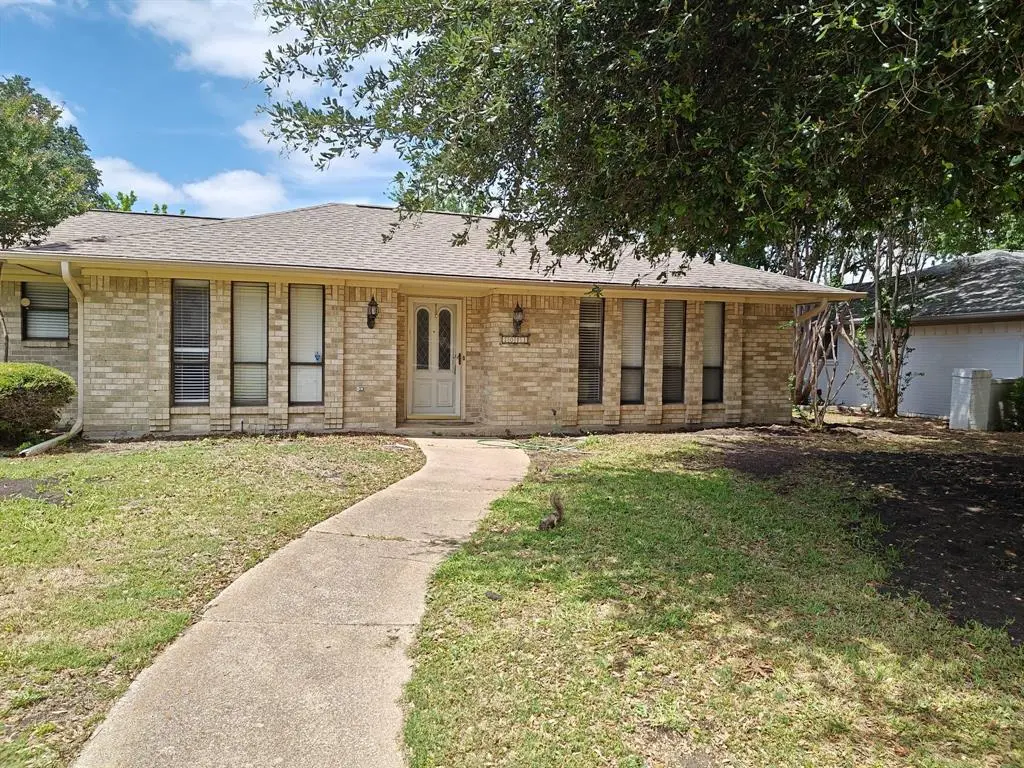
2013 Ports O Call Dr · Plano, TX
Flood risk 1/10 · Minimal
- FEMA flood zone
- X (unshaded)
- Chance of flooding over 30 yrs
- 0.0%
- Est. flood insurance / yr
- $507 – $1,088
Fire risk 2/10 · Minimal
- Est. fire insurance / yr
- $1,222 – $2,270
Heat risk 7/10 · Major
- Hot days now (above 110°F)
- 7 days/yr
- Hot days in 30 yrs
- 23 days/yr
Wind risk 6/10 · Moderate
- Chance of severe wind over 30 yrs
- 27.0%
Air-quality risk 3/10 · Minor
- Unhealthy air days now
- 3 days/yr
- Unhealthy air days in 30 yrs
- 4 days/yr
Risk factors via First Street. Map © Google.
Why this score? — see what drove the D+ grade
The composite is a weighted blend of 9 inputs, each scored 0–100. Each bar is that input's sub-score; the figure is the points it added to the 100-point composite (weight × sub-score).
- ARV discount +15.0/15.0
- Cash flow +11.4/30.0
- Schools +4.9/10.0
- Livability +4.2/5.0
- 1% rule +3.8/10.0
- DSCR +3.3/10.0
- Rent growth +3.0/5.0
- Condition / age +2.5/5.0
- Appreciation +0.0/10.0
$349,000
🖨 Deal sheet (PDF) 📄 Offer letter ✓ Due diligence
Listing remarks MLS
Great property recently updated and ready for move in. Fresh paint, carpet and more. Great location close to schools and parks. Large living room with fireplace, formal dining room. A great family home ready for a new family.
Key facts
- Formal dining room
- Wet bar
- Eat-in kitchen
Tags
Property features AI
Finance
- HOA & community: No association
Exterior
- Parking: Attached garage; 2-car garage (20 ft wide x 20 ft deep) with garage facing rear; 2 covered parking spaces; Alley access; 2-car single door
- Utilities: City water (individual water meter); City sewer; Electricity connected; Cable available; Individual gas meter
- Home design: Single family residence; One story; Residential property
- Construction: Brick construction; Built in 1974; Preowned
- Exterior features: Wood fencing; Lot less than 0.5 acre (approximately 0.23 acre)
Interior
- Kitchen: Dishwasher; Electric cooktop; Electric oven; Eat-in kitchen with built-in cabinets
- Bedrooms: 4 bedrooms (all on the main level); Primary bedroom with separate vanities and walk-in closet; Three additional bedrooms with walk-in closets
- Bathrooms: 2 full bathrooms; 1 half bathroom
- Heating & cooling: Individual gas meter
- Interior features: Cable TV available; High-speed internet available; Wet bar; One living area; Two dining areas; 8 total rooms; Living room (27 x 17)
- Laundry & utility: Utility room (5 x 6)
Neighborhood map
What this means for you Summary
Snapshot
- This is a 4-bed/2.5-bath single-family listed at $349k.
Deal economics
- At list price, monthly cash flow is $-123 ($-1k/yr) — negative.
- To cash-flow at today's rent, offer at most $327k (6.2% below list).
- To meet the 1% rule (rent ≥ 1% of price), the offer needs to be $306k (12.2% below list).
- Recommended offer: $306k (12.2% below list) — sets the bar for 1% rule.
- Cap rate 5.9% vs local median 2.8% in Plano — top-decile yield for the area; either an underpriced asset or a hidden risk that comps aren't pricing in. Stress-test before assuming the spread holds.
Location & tenants
- Location reads 84/100 on livability (#8 in TX, #728 nationally) — a professional / high-income tenant draw. Strengths: commute A+, employment A+, housing A+; Watch: cost of living F.
- Plano ISD (urban): math 52% / reading 55% proficiency, ranked #90 of 826 in TX (top 11%) — acceptable for families but not a draw, mixed tenant base, ~2y average lease.
- Zoned schools: Harrington El (math 57% / reading 57%, grade C+, #505 of 4,322 statewide, top 13%, 384 students, 29% FRL) — zoned schools at 29% FRL track the district average.
- Market conditions: Rents rising (+2.1%/yr); 214 active listings in the ZIP; 40 comparable units currently listed for rent nearby; rentals at typical pace (median 25d on market — plan ~3-4 weeks tenant-placement turnaround); 42% of comp listings sitting > 30 days — soft ceiling on asking rent; solid renter incomes; 19,194 units permitted in Collin County in 2024 (3,988 in 5+ unit buildings).
- This rent runs 37% of the median local income ($98k/yr) — at the standard rent-burdened threshold; future hikes will face affordability resistance.
Forward outlook
- Local home prices are declining (-3.0%/yr); year-one equity from $2k of loan paydown is wiped out by about $10k of value loss. Plan a longer hold.
- Collin County population projected at +60% by 2050 — long-run rental-demand tailwind backs the buy-and-hold thesis.
Negotiation context
- Only 5 days on market — expect competitive offers; lowballing is unlikely to land.
- 8 sale attempts since 22y ago with the ask held roughly flat each time — persistent listings suggest the price (not the market) is what's stuck; bring a comps-based counter.
Risks & watch-outs
- Climate carrying-cost: major wind risk, 27% chance of damaging wind over 30y; extreme-heat days projected 7→23/yr by 2055 (HVAC capex compounding) — expect insurance premiums to compound above CPI over the hold.
Questions for the listing agent
- What do current leases actually rent for vs. the listed asking? Can we see a recent rent roll and the last 12 months of T-12 income?
- Built in 1974 — when were the roof, HVAC, electrical panel, plumbing, and water heater last replaced?
- Is there a deadline driving the sale (1031 exchange, divorce, estate, relocation)? That informs how much negotiation room exists.
- Schools are A-rated — typically a magnet for longer-tenancy family renters. What's the average tenant stay here, and is there a school-zone premium baked into asking?
- The area grade is low — what's the realistic commute time and amenity access for the typical tenant pool here? Any planned neighborhood developments (good or bad) we should know about?
- What's the average days-on-market for RENTAL listings here right now (not sales)? A rising rental-DOM trend means longer vacancies and softer asking-rent achievability than the comps imply.
- What's the recent tenant-quality profile in this submarket — average credit score on applications, eviction rate, late-payment / NSF rate, and stable-employment percentage? A property-management company in the area should have these aggregated.
- How much new for-sale + rental construction is in the pipeline within 1–3 miles? Heavy new supply typically softens prices + rents 12–24 months out; constrained supply supports both.
Investment metrics
- 1% rule
- 0.88% ✗
- Cap rate
- 5.87%
- Cash-on-cash
- -1.51%
- DSCR
- 0.93
- GRM
- 9.5
CMA / ARV
- ARV (on-the-fly)
- $480,342
- Comps found
- 12
Show comp detail 12 sales within ~0.75 mi
| Address | Dist | Beds/Ba | Sqft | Sold | Price | $/sf | Match |
|---|---|---|---|---|---|---|---|
| 2200 Parkhaven Dr | 0.25mi | 4/2.5 | 2,199 (+2%) | 2mo | $500,000 | $227 | 84 |
| 2212 Heather Hill Ln | 0.30mi | 3/2.5 (-1) | 2,201 (+2%) | 1mo | $399,900 | $182 | 77 |
| 1724 Scottsdale Dr | 0.35mi | 3/2.5 (-1) | 2,075 (-4%) | 2mo | $434,900 | $210 | 71 |
| 2404 Heather Hill Ln | 0.48mi | 4/2.5 | 2,242 (+4%) | 2mo | $500,000 | $223 | 70 |
| 1605 Copper Creek Dr | 0.38mi | 4/3.0 | 1,981 (-8%) | 1mo | $450,000 | $227 | 66 |
| 2112 Treehouse Ln | 0.50mi | 3/2.5 (-1) | 2,273 (+6%) | 1mo | $520,000 | $229 | 62 |
| 2612 Stonemoss Dr | 0.70mi | 3/2.0 (-1) | 2,036 (-6%) | 2mo | $399,000 | $196 | 49 |
| 1704 Throwbridge Ln | 0.52mi | 3/2.5 (-1) | 2,453 (+14%) | 1mo | $459,990 | $188 | 47 |
| 2520 Flagstone Dr | 0.62mi | 3/2.0 (-1) | 1,935 (-10%) | 1mo | $495,000 | $256 | 47 |
| 2613 Flagstone Dr | 0.68mi | 3/2.0 (-1) | 1,971 (-8%) | 1mo | $410,000 | $208 | 46 |
| 1700 Throwbridge Ln | 0.52mi | 3/2.0 (-1) | 1,887 (-12%) | 2mo | $515,000 | $273 | 46 |
| 2525 Winterstone Dr | 0.66mi | 3/2.0 (-1) | 1,933 (-10%) | 1mo | $400,000 | $207 | 45 |
Match score weights: distance 35% · size 25% · config 20% · recency 20%. Top-matched comps best support the ARV.
Projected returns pro-forma
-3.0% appreciation · 2.09% rent growth · sell at horizon
- IRR
- -19.8%
- Equity multiple
- 0.31×
- Total profit
- $-67,051
- Equity at exit
- $52,037
- IRR
- -14.8%
- Equity multiple
- 0.19×
- Total profit
- $-79,171
- Equity at exit
- $30,175
Cash invested: $97,720 (down + closing). Projections, not guarantees.
Landlord ↔ Tenant lean methodology
- Overall (STATE)
- 87 Strongly Landlord-Friendly
- State Texas
- 87 Strongly Landlord-Friendly · R+5
- County
- — inherits STATE
- City
- — inherits STATE
ZIP-level market 75075
- Rents YoY
- 2.1%
- Active inventory
- 214
- Price-to-rent
- 9.5×
Monthly cashflow live
- Estimated rent
- $3,063 high interval (Pro) →
- Mortgage (P&I)
- −$1,830
- Tax from tax record
- −$567 /mo · $6,806/yr
- Insurance
- −$145
- HOA
- −$0
- Vacancy / Maint / Mgmt
- −$643
- Net cashflow
- $-123
Break-even live
Sensitivity live
| Price | -10% $74 | -5% $-24 | +0% $-123 | +5% $-222 | +10% $-321 |
|---|---|---|---|---|---|
| Rent | -10% $-365 | -5% $-244 | +0% $-123 | +5% $-2 | +10% $119 |
| Rate | -1.0pp $53 | -0.5pp $-34 | base $-123 | +0.5pp $-214 | +1.0pp $-306 |
UW: 25.0% down · 7.5% · 30yr · 1.5% tax · 5.0% vac · 8.0% maint · 8.0% mgmt
Financing live
Cash to close
- Down payment
- $87,250
- Closing costs
- $10,470
- Reserves months
- —
- Total cash needed
- —
Loan-product check · same deal, 3 products live
Conventional
25% down · 7.5% · 30yr
- Down + closing
- —
- Monthly P&I
- —
- Monthly cashflow
- —
- DSCR
- —
- Eligible?
- —
Personal DTI + credit; lowest rate.
DSCR
20% down · 8.5% · 30yr
- Down + closing
- —
- Monthly P&I
- —
- Monthly cashflow
- —
- DSCR
- —
- Eligible?
- —
No personal income docs; deal must DSCR.
Hard money
10% down · 12.0% · 12mo
- Down + closing
- —
- Monthly P&I
- —
- Monthly cashflow
- —
- DSCR
- —
- Eligible?
- —
Short-term bridge; refi at stabilization.
Rent comps 40 comps
| Address | Beds | Baths | Sqft | Rent | $/sqft | DOM | Units | Dist |
|---|---|---|---|---|---|---|---|---|
| 2005 Papeete Dr Plano, TX | 4.0 | 3.0 | 1948 | $3,750 | $1.93 | 25d | 1 | 0.11mi |
| 1904 Tampico Dr Plano, TX | 4.0 | 3.0 | 2196 | $4,500 | $2.05 | 44d | 1 | 0.13mi |
| 2126 Teakwood Ln Plano, TX | 3.0 | 2.0 | 1549 | $2,450 | $1.58 | 44d | 1 | 0.21mi |
| 1617 Idyllwild Ct Plano, TX | 4.0 | 2.0 | 2738 | $2,950 | $1.08 | 11d | 1 | 0.30mi |
| 3105 Copper Creek Dr Plano, TX | 3.0 | 2.5 | 2270 | $2,800 | $1.23 | 19d | 1 | 0.53mi |
| 2013 Treehouse Ln Plano, TX | 4.0 | 3.0 | 2390 | $3,499 | $1.46 | 25d | 1 | 0.54mi |
| 2304 Canyon Valley Trl Plano, TX | 3.0 | 2.5 | 2282 | $2,800 | $1.23 | 44d | 1 | 0.59mi |
| 1412 Wind Cave Cir Plano, TX | 4.0 | 2.0 | 1757 | $2,300 | $1.31 | 44d | 1 | 0.66mi |
| 2605 Plateau Dr Unit 1019536P Plano, TX | 4.0 | 2.0 | 1926 | $8,063 | $4.19 | 44d | 1 | 0.67mi |
| 2608 Plateau Dr Plano, TX | 4.0 | 2.0 | 1937 | $8,750 | $4.52 | 44d | 1 | 0.68mi |
| 1409 Glacier Dr Plano, TX | 4.0 | 2.0 | 1526 | $2,350 | $1.54 | 21d | 1 | 0.76mi |
| 2203 Glen Forest Ln Plano, TX | 3.0 | 2.0 | 1840 | $2,300 | $1.25 | 4d | 1 | 0.78mi |
| 2200 W Park Blvd Plano, TX | 3.0 | 3.0 | 1444 | $1,999 | $1.38 | 44d | 1 | 0.78mi |
| 3805 Covinton Ln Plano, TX | 4.0 | 2.5 | 2943 | $2,995 | $1.02 | 6d | 1 | 0.80mi |
| 1109 Wimbledon Ln Plano, TX | 3.0 | 2.0 | 1618 | $1,950 | $1.21 | 44d | 1 | 0.83mi |
| 1728 Tawakoni Ln Plano, TX | 4.0 | 2.5 | 2491 | $3,195 | $1.28 | 8d | 1 | 0.83mi |
| 1813 Cross Bend Rd Plano, TX | 5.0 | 2.0 | 1978 | $5,200 | $2.63 | 44d | 1 | 0.84mi |
| 1104 Wimbledon Ln Plano, TX | 3.0 | 2.0 | 1714 | $2,200 | $1.28 | 0d | 1 | 0.84mi |
| 2309 Lawndale Dr Plano, TX | 4.0 | 2.0 | 2355 | $3,000 | $1.27 | 13d | 1 | 0.85mi |
| 2933 Deep Valley Trl Plano, TX | 4.0 | 2.5 | 2572 | $2,995 | $1.16 | 25d | 1 | 0.87mi |
| 1800 Sacramento Ter Plano, TX | 4.0 | 2.5 | 2506 | $3,200 | $1.28 | 11d | 1 | 0.88mi |
| 2728 Parkhaven Dr Plano, TX | 3.0 | 2.0 | 1832 | $2,450 | $1.34 | 44d | 1 | 0.90mi |
| 1821 Geneva Ln Plano, TX | 3.0 | 2.0 | 2110 | $3,100 | $1.47 | 45d | 1 | 0.94mi |
| 2709 Oak Cir Plano, TX | 4.0 | 2.5 | 2228 | $4,200 | $1.89 | 19d | 1 | 0.95mi |
| 1021 Mellville Dr Plano, TX | 4.0 | 2.0 | 2210 | $7,750 | $3.51 | 44d | 1 | 0.95mi |
| 1021 Mellville Dr Unit 1019512P Plano, TX | 4.0 | 2.0 | 2206 | $12,028 | $5.45 | 25d | 1 | 0.95mi |
| 1413 Yellowstone Dr Plano, TX | 3.0 | 2.0 | 1440 | $2,050 | $1.42 | 44d | 1 | 0.96mi |
| 3008 Townbluff Dr Plano, TX | 3.0 | 2.0 | 1431 | $2,000 | $1.40 | 25d | 1 | 0.96mi |
| 2724 Russwood Ln Plano, TX | 4.0 | 2.0 | 2050 | $2,445 | $1.19 | 21d | 1 | 0.97mi |
| 1425 Natchez Dr Plano, TX | 3.0 | 2.0 | 1861 | $2,145 | $1.15 | 20d | 1 | 0.99mi |
| 2732 S Cypress Cir Plano, TX | 3.0 | 2.0 | 1700 | $2,349 | $1.38 | 44d | 1 | 1.03mi |
| 2337 Chace Ct Plano, TX | 4.0 | 2.5 | 2692 | $3,100 | $1.15 | 25d | 1 | 1.05mi |
| 941 Lombardy Dr Plano, TX | 3.0 | 2.0 | 1930 | $2,200 | $1.14 | 44d | 1 | 1.06mi |
| 2709 Deep Valley Trl Plano, TX | 3.0 | 2.0 | 1854 | $2,500 | $1.35 | 8d | 1 | 1.08mi |
| 2709 Deep Valley Trl Plano, TX | 3.0 | 2.0 | 1854 | $2,500 | $1.35 | 3d | 1 | 1.08mi |
| 841 Snapdragon Ln Plano, TX | 4.0 | 3.0 | 2276 | $4,400 | $1.93 | 44d | 1 | 1.14mi |
| 1401 Cross Bend Rd Plano, TX | 3.0 | 2.0 | 1443 | $2,200 | $1.52 | 22d | 1 | 1.15mi |
| 2421 Regal Rd Unit 1019483P Plano, TX | 5.0 | 3.0 | 2217 | $13,187 | $5.95 | 22d | 1 | 1.17mi |
| 2421 Regal Rd Plano, TX | 5.0 | 3.0 | 2221 | $9,750 | $4.39 | 44d | 1 | 1.17mi |
| 817 Edmonton Dr Plano, TX | 4.0 | 2.5 | 2736 | $3,500 | $1.28 | 21d | 1 | 1.20mi |
Listing history 26 events
-
2026-06-02status $349,000 Pending 5 DOM
-
2026-06-01days on market $349,000 Active Option Contract 5 DOM
-
2026-05-31days on market $349,000 Active Option Contract 4 DOM
-
2026-05-27$349,000 Active
-
2013-04-04soldstatus Closed 225-char remark
Show marketing remark (225 chars)
Great property recently updated and ready for move in. Fresh paint, carpet and more. Great location close to schools and parks. Large living room with fireplace, formal dining room. A great family home ready for a new family.
-
2013-02-28status Pending 225-char remark
Show marketing remark (225 chars)
Great property recently updated and ready for move in. Fresh paint, carpet and more. Great location close to schools and parks. Large living room with fireplace, formal dining room. A great family home ready for a new family.
-
2013-02-18price $179,900 225-char remark
Show marketing remark (225 chars)
Great property recently updated and ready for move in. Fresh paint, carpet and more. Great location close to schools and parks. Large living room with fireplace, formal dining room. A great family home ready for a new family.
-
2013-01-25historical
-
2013-01-07$189,900 Active 225-char remark
Show marketing remark (225 chars)
Great property recently updated and ready for move in. Fresh paint, carpet and more. Great location close to schools and parks. Large living room with fireplace, formal dining room. A great family home ready for a new family.
-
2012-10-30soldstatus
-
2012-07-26status Pending
-
2012-04-02status Active Contingent
-
2012-04-01historical
-
2012-02-01status Active Contingent
-
2012-02-01historical
-
2011-10-28historical Active Contingent
-
2011-10-20price $110,000
-
2011-10-10$130,000 Active
-
2011-02-24historical
-
2010-08-25$149,900 Active
-
2010-08-24historical
-
2010-08-21$149,900
-
2004-07-14soldstatus
-
2004-07-08soldstatus
-
2004-06-05historical
-
2004-04-06$159,800
ⓘ Source: listings_history table (triggers on properties + properties_extension) + one-shot
backfill from property_details.listing_events for pre-trigger history.
Tax reassessment forecast TX · Resets to sale price
- Current annual tax
- $6,806 · $567/mo
- Projected year-2 tax
- $6,806 · $567/mo
- Expected delta
- $0/yr ($0/mo · 0.0%)
ⓘ Screening estimate from a state-policy table — verify with the county assessor before closing.
Climate risk First Street
- Flood 1/10 Low FEMA zone X (unshaded) · 0% chance over 30 yrs
- Wildfire 2/10 Low
- Heat 7/10 Severe 7 d/yr ≥110°F today · 23 d/yr by 30 yrs out
- Wind 6/10 Major 27% chance of damaging wind over 30 yrs
- Air quality 3/10 Moderate 3 unhealthy d/yr today · 4 by 30 yrs out
Nearby sold comps map
Loading sold comps map…
Walkable amenities ~0.75 mi
Loading nearby amenities…
Taxation est. · year 1
- Rental income
- $36,753
- − Mortgage interest
- −$19,549
- − Property taxes
- −$6,806
- − Insurance
- −$1,745
- − Repairs & maintenance
- −$2,940
- − Management
- −$2,940
- − Depreciation
- −$10,153
- Taxable loss
- −$7,380
- Est. tax savings @ 24.0%
- +$1,771
- After-tax cash flow
- $293/yr
For passive investors: Depreciation is non-cash, so a rental often shows a tax loss while cash-flowing — sheltering income. Rental losses are passive: they offset passive income freely, and up to $25,000/yr can offset ordinary (W-2) income if you actively participate and your MAGI is under $100k (phasing out to $0 by $150k); unused losses carry forward. On sale, claimed depreciation is recaptured at up to 25%, and gains may owe capital-gains tax (a 1031 exchange can defer both). Figures are a year-1 estimate at your 24.0% rate — not tax advice; consult a CPA.
Schools (NCES district)
- District
- Plano ISD
- NCES district ID
- 4835100
- Math proficiency
- 52% ▼ -13.00%
- Reading proficiency
- 55% ▼ -8.00%
- Median HH income
- $79,861
- Composite
- 48.54/100
- National rank
- #2115
- State rank
- #90 of 826 in TX
Livability — Plano
- Score
- 84/100
- State rank
- #8
- US rank
- #728
Category grades
Schools grade is shown separately in the Schools card above.
Census & demographics
- Census place
- Plano, TX
- County
- Collin County · 1,159,394 people
- City population
- 288,003
- Metro
- Dallas-Fort Worth-Arlington, TX
- Population (ZIP)
- 38,135
- Household income
- $98,365
- Rent vs Own
- Severe rent burden
- 1108.0
Population outlook (Collin County) Hauer SSP2
- Today (2025)
- 1,210,074 people
- By 2030
- 1,358,201 · +12.2%
- By 2040
- 1,654,061 · +36.7%
- By 2050
- 1,937,359 · +60.1%
- By 2075
- 2,567,039 · +112.1%
- By 2100
- 2,952,048 · +144.0%
Race, ethnicity, and origin ACS 2023
- Neighborhood character
- Diverse neighborhood (Simpson 0.58)
- Race & ethnicity
- White 61% Hispanic / Latino 16% Asian 12% Two or more races 10% Black 8%
- Hispanic origin (detail)
- Mexican 10%
- Common ancestry
- Lithuanian 3% Slovak 2% American 1%
- Foreign-born
- 20% · Canada, China, Philippines
- Languages at home
- 73% English-only · Spanish 11% Other Indo-European 4% Other Asian/Pacific 3%
Political lean MEDSL · Collin
- 2024 margin
- R (+11.1) · D 43.1% · R 54.3% · Other 2.6%
- 2008→2024 swing
- +14.4pp toward D · 2008: -25.6pp · 2024: -11.1pp
- All cycles
- 2024: R+11.1 2020: R+4.3 2016: R+17.0 2012: R+31.6 2008: R+25.6
Not yet ingested
- Civics
- —
Market trends
- HPI YoY
- ▼ -308.79%
- Current HPI
- 272.4482
- Rent YoY
- ▲ 2.09%
- Metro
- Dallas-Fort Worth-Arlington, TX
- State GDP YoY
- ▲ 3.95%
- F500 in state
- 110
Industry mix (Fortune 500 HQ in TX)
| Industry | F500 HQs | Revenue |
|---|---|---|
| Energy | 16 | $1,198B |
|
||
| Technology | 5 | $198B |
|
||
| Engineering / Construction | 4 | $72B |
|
||
| Energy Services | 3 | $60B |
|
||
| Utilities | 3 | $41B |
|
||
| Healthcare | 2 | $330B |
|
||
Price history
+118.4% since first listed23 events — show timeline
- 2026-05-27 Listed $349,000 NTREIS
- 2013-04-04 Sold (MLS) — NTREIS
- 2013-02-28 Pending — NTREIS
- 2013-02-18 Price Changed $179,900 NTREIS
- 2013-01-25 Listing Removed — NTREIS
- 2013-01-07 Listed $189,900 NTREIS
- 2012-10-30 Sold (Public Records) — Public Records
- 2012-07-26 Pending — NTREIS
- 2012-04-02 Relisted — NTREIS
- 2012-04-01 Listing Removed — NTREIS
- 2012-02-01 Relisted — NTREIS
- 2012-02-01 Listing Removed — NTREIS
- 2011-10-28 Contingent — NTREIS
- 2011-10-20 Price Changed $110,000 NTREIS
- 2011-10-10 Listed $130,000 NTREIS
- 2011-02-24 Listing Removed — NTREIS
- 2010-08-25 Listed $149,900 NTREIS
- 2010-08-24 Listing Removed — NTREIS
- 2010-08-21 Listed $149,900 NTREIS
- 2004-07-14 Sold (Public Records) — Public Records
- 2004-07-08 Sold (MLS) — NTREIS
- 2004-06-05 Listing Removed — NTREIS
- 2004-04-06 Listed $159,800 NTREIS
Property tax history
+4.2%/yrLatest (2025): $6,806 · +0.1% YoY. Source: county tax records.
Cash-flow waterfall
monthlySold comps — $/sqft
last 12 mo · ≤1 miLoading sold comps…