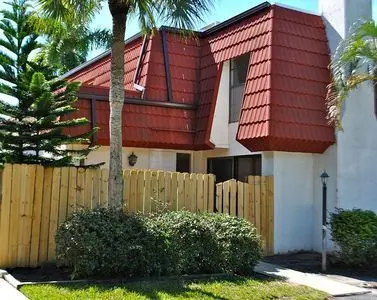
10845 Meadow Lark Cove Dr · Iona, FL
Flood risk 8/10 · Major
- FEMA flood zone
- AE
- Chance of flooding over 30 yrs
- 0.97%
- Est. flood insurance / yr
- $1,737 – $8,500
Fire risk 1/10 · Minimal
- Est. fire insurance / yr
- $947 – $1,759
Heat risk 10/10 · Severe
- Hot days now (above 107°F)
- 7 days/yr
- Hot days in 30 yrs
- 30 days/yr
Wind risk 10/10 · Severe
- Chance of severe wind over 30 yrs
- 99.0%
Air-quality risk 2/10 · Minimal
- Unhealthy air days now
- 1 days/yr
- Unhealthy air days in 30 yrs
- 1 days/yr
Risk factors via First Street. Map © Google.
Why this score? — see what drove the C- grade
The composite is a weighted blend of 9 inputs, each scored 0–100. Each bar is that input's sub-score; the figure is the points it added to the 100-point composite (weight × sub-score).
- Cash flow +22.5/30.0
- ARV discount +7.5/15.0
- DSCR +7.2/10.0
- 1% rule +5.2/10.0
- Schools +4.1/10.0
- Livability +3.6/5.0
- Condition / age +2.5/5.0
- Rent growth +2.2/5.0
- Appreciation +0.0/10.0
$234,890
🖨 Deal sheet 📄 Offer letter ✓ Due diligence
Listing remarks MLS
Welcome to this 2 bedroom 2 bath townhome in Fort Myers, Florida! This lovely home is perfect for those who want to enjoy the Florida lifestyle with all the amenities you could want. Let me give you a quick tour. As you step into the home, you will notice the stunning granite countertops in the kitchen. The countertops are not only beautiful, but they are also highly functional and durable, making them perfect for cooking and entertaining. You'll also notice the cozy fireplace in the living room, perfect for those cooler Florida nights. One of the best features of this home is the fenced-in yard. You'll have plenty of privacy and space to enjoy outdoor activities with your family and friends. Additionally, if you are a boat lover, there is a boat ramp and boat slip available for an additional fee. This is a great opportunity to take advantage of Florida's beautiful waterways and enjoy boating. This townhome is located in a great neighborhood with plenty of shopping, dining, and entertainment options nearby. You'll also have easy access to major highways, making it easy to get to other areas of Fort Myers and the surrounding areas.
Key facts
- 600 fishing pier
- Large yard
- 6ft privacy fence
Tags
Neighborhood map
What this means for you Summary
Snapshot
- This is a 2-bed/2.0-bath condo listed at $235k.
Deal economics
- At list price, monthly cash flow is $-32 ($-385/yr) — negative.
- To cash-flow at today's rent, offer at most $229k (2.4% below list).
- Meets the 1% rule at list price ($2k rent vs $235k).
- Recommended offer: $229k (2.4% below list) — sets the bar for cash-flow.
- Cap rate 8.3% vs local median 2.1% in Iona — top-decile yield for the area; either an underpriced asset or a hidden risk that comps aren't pricing in. Stress-test before assuming the spread holds.
Location & tenants
- Location reads 72/100 on livability (#359 in FL) — a middle-class / working-renter tenant base. Strengths: crime A+, housing A, health & safety A; Watch: schools D-, amenities F, commute F.
- Lee (suburban): math 47% / reading 50% proficiency, ranked #42 of 73 in FL (top 58%) — families likely to look elsewhere, expect single-tenant / working-renter base with shorter leases.
- Market conditions: Rents soft (-1.2%/yr); 1244 active listings in the ZIP; 40 comparable units currently listed for rent nearby; rentals at typical pace (median 21d on market — plan ~3-4 weeks tenant-placement turnaround); solid renter incomes; 15,411 units permitted in Lee County in 2024 (4,686 in 5+ unit buildings).
- This rent runs 38% of the median local income ($75k/yr) — at the standard rent-burdened threshold; future hikes will face affordability resistance.
Forward outlook
- Local home prices are declining (-3.0%/yr); year-one equity from $2k of loan paydown is wiped out by about $7k of value loss. Plan a longer hold.
- Lee County population projected at +44% by 2050 — long-run rental-demand tailwind backs the buy-and-hold thesis.
Negotiation context
- Only 11 days on market — expect competitive offers; lowballing is unlikely to land.
- 7 sale attempts since 11y ago with the ask held roughly flat each time — persistent listings suggest the price (not the market) is what's stuck; bring a comps-based counter.
Risks & watch-outs
- Watch-outs: flood insurance adds $427/mo.
- Climate carrying-cost: in FEMA flood zone AE (mandatory federal flood insurance); severe wind risk, 99% chance of damaging wind over 30y; extreme-heat days projected 7→30/yr by 2055 (HVAC capex compounding) — expect insurance premiums to compound above CPI over the hold.
Questions for the listing agent
- What do current leases actually rent for vs. the listed asking? Can we see a recent rent roll and the last 12 months of T-12 income?
- What's the actual annual flood-insurance premium (NFIP or private), and is the property in a SFHA with mandatory coverage?
- Any open or pending special assessments — roof, HVAC, plumbing, elevator, façade? What's the per-unit balance and payoff schedule, and is the seller paying it off at close or rolling it to the buyer?
- Is there a deadline driving the sale (1031 exchange, divorce, estate, relocation)? That informs how much negotiation room exists.
- Schools are D-rated, which usually means shorter tenancies and higher turnover. Who's the typical renter profile here, and what's been the actual vacancy rate?
- What's the average days-on-market for RENTAL listings here right now (not sales)? A rising rental-DOM trend means longer vacancies and softer asking-rent achievability than the comps imply.
- What's the recent tenant-quality profile in this submarket — average credit score on applications, eviction rate, late-payment / NSF rate, and stable-employment percentage? A property-management company in the area should have these aggregated.
- How much new apartment / multifamily construction is in the pipeline within 1–3 miles? Heavy new supply (>2% of stock underway) typically softens rents 12–24 months out; light construction supports rent growth.
Investment metrics
- 1% rule
- 1.02% ✓
- Cap rate
- 8.31%
- Cash-on-cash
- 7.20%
- DSCR
- 1.32
- GRM
- 8.1
CMA / ARV
No comps found within radius.
Projected returns pro-forma
-3.0% appreciation · 0.0% rent growth · sell at horizon
- IRR
- -21.3%
- Equity multiple
- 0.29×
- Total profit
- $-46,931
- Equity at exit
- $35,023
- IRR
- -26.5%
- Equity multiple
- -0.06×
- Total profit
- $-69,830
- Equity at exit
- $20,309
Cash invested: $65,769 (down + closing). Projections, not guarantees.
Landlord ↔ Tenant lean methodology
- Overall (STATE)
- 87 Strongly Landlord-Friendly
- State Florida
- 87 Strongly Landlord-Friendly · R+3
- County
- — inherits STATE
- City
- — inherits STATE
ZIP-level market 33908
- Home prices YoY
- -32.8%
- Rents YoY
- -1.2%
- Active inventory
- 1244
- Price-to-rent
- 8.1×
Monthly cashflow live
- Estimated rent
- $2,406 high interval (Pro) →
- Mortgage (P&I)
- −$1,232
- Tax from tax record
- −$177 /mo · $2,122/yr
- Insurance
- −$98
- Flood insurance flood zone
- −$427 /mo · $5,118/yr
- HOA
- −$0
- Vacancy / Maint / Mgmt
- −$505
- Net cashflow
- $-32
Break-even live
UW: 25.0% down · 7.5% · 30yr · 1.5% tax · 5.0% vac · 8.0% maint · 8.0% mgmt
Financing live
Cash to close
- Down payment
- $58,722
- Closing costs
- $7,047
- Reserves months
- —
- Total cash needed
- —
Loan-product check · same deal, 3 products live
Conventional
25% down · 7.5% · 30yr
- Down + closing
- —
- Monthly P&I
- —
- Monthly cashflow
- —
- DSCR
- —
- Eligible?
- —
Personal DTI + credit; lowest rate.
DSCR
20% down · 8.5% · 30yr
- Down + closing
- —
- Monthly P&I
- —
- Monthly cashflow
- —
- DSCR
- —
- Eligible?
- —
No personal income docs; deal must DSCR.
Hard money
10% down · 12.0% · 12mo
- Down + closing
- —
- Monthly P&I
- —
- Monthly cashflow
- —
- DSCR
- —
- Eligible?
- —
Short-term bridge; refi at stabilization.
Rent comps 40 comps
| Address | Beds | Baths | Sqft | Rent | $/sqft | DOM | Units | Dist |
|---|---|---|---|---|---|---|---|---|
| 10907 Meadow Lark Cove Dr Fort Myers, FL | 3.0 | 3.0 | 1600 | $1,580 | $0.99 | 3d | 1 | 0.04mi |
| 7113 Quail Run Ct W Unit W9 Fort Myers, FL | 2.0 | 2.0 | 1028 | $1,795 | $1.75 | 23d | 1 | 0.06mi |
| 7105 Quail Run Ct W #1 Fort Myers, FL | 2.0 | 2.0 | 1124 | $1,750 | $1.56 | 23d | 1 | 0.06mi |
| 11921 Seabreeze Cove Ln #208 Fort Myers, FL | 2.0 | 2.0 | 1455 | $4,399 | $3.02 | 3d | 1 | 0.12mi |
| 14570 Grande Cay Cir #2406 Fort Myers, FL | 2.0 | 2.0 | 1560 | $4,500 | $2.88 | 3d | 1 | 0.13mi |
| 5421 Peppertree Dr Fort Myers, FL | 2.0 | 2.0 | 1200 | $2,000 | $1.67 | 23d | 1 | 0.14mi |
| 7199 Blanquilla Ct Unit 1545910P Fort Myers, FL | 3.0 | 2.0 | 1345 | $2,341 | $1.74 | 16d | 1 | 0.18mi |
| 5479 Peppertree Dr Unit E13 Fort Myers, FL | 2.0 | 2.0 | 964 | $1,950 | $2.02 | 23d | 1 | 0.19mi |
| 11651 Pointe Cir Unit 1546272P Fort Myers, FL | 2.0 | 2.0 | 1367 | $1,249 | $0.91 | 16d | 1 | 0.23mi |
| 11674 Pointe Cir Unit 1 Fort Myers, FL | 3.0 | 2.5 | 1544 | $1,900 | $1.23 | 23d | 1 | 0.24mi |
| 15055 Tamarind Cay Ct #1205 Fort Myers, FL | 3.0 | 2.0 | 1760 | $2,700 | $1.53 | 23d | 1 | 0.27mi |
| 14819 Laguna Dr #501 Fort Myers, FL | 3.0 | 2.5 | 1857 | $5,000 | $2.69 | 19d | 1 | 0.31mi |
| 7171 Drake Dr Fort Myers, FL | 3.0 | 2.0 | 1346 | $2,350 | $1.75 | 23d | 1 | 0.31mi |
| 15091 Tamarind Cay Ct #907 Fort Myers, FL | 2.0 | 2.0 | 1487 | $5,000 | $3.36 | 23d | 1 | 0.34mi |
| 14815 Laguna Dr #103 Fort Myers, FL | 3.0 | 3.0 | 1857 | $4,100 | $2.21 | 3d | 1 | 0.37mi |
| 15037 Tamarind Cay Ct #1503 Fort Myers, FL | 3.0 | 2.0 | 1487 | $2,000 | $1.34 | 23d | 1 | 0.40mi |
| 11271 Jacana Ct #1706 Fort Myers, FL | 2.0 | 2.0 | 1487 | $4,500 | $3.03 | 23d | 1 | 0.46mi |
| 14873 Crescent Cove Dr Fort Myers, FL | 3.0 | 2.0 | 1134 | $3,500 | $3.09 | 23d | 1 | 0.46mi |
| 15514 Kapok Ct Fort Myers, FL | 2.0 | 2.0 | 900 | $1,850 | $2.06 | 23d | 1 | 0.54mi |
| 14967 Rivers Edge Ct Unit B2 Fort Myers, FL | 2.0 | 2.0 | 1166 | $1,700 | $1.46 | 3d | 1 | 0.56mi |
| 14971 Rivers Edge Ct #101 Fort Myers, FL | 2.0 | 2.0 | 1273 | $2,000 | $1.57 | 23d | 1 | 0.59mi |
| 14977 Rivers Edge Ct #219 Fort Myers, FL | 2.0 | 2.0 | 1128 | $1,599 | $1.42 | 23d | 1 | 0.60mi |
| 12131 Live Oak Dr Fort Myers, FL | 3.0 | 2.0 | 1186 | $1,700 | $1.43 | 3d | 1 | 0.60mi |
| 15625 Ocean Walk Cir #103 Fort Myers, FL | 2.0 | 2.0 | 1287 | $1,450 | $1.13 | 21d | 1 | 0.72mi |
| 11400 Ocean Walk Ln Fort Myers, FL | 1.0–2.0 | 1.0–2.0 | 856 | $1,500 | $1.75 | 3d | 2 | 0.75mi |
| 15270 Ballast Point Dr Fort Myers, FL | 1.0–3.0 | 1.0–2.0 | 1094 | $1,610 | $1.47 | 1d | 20 | 0.75mi |
| 15645 Ocean Walk Cir Fort Myers, FL | 3.0 | 2.0 | 1227 | $2,774 | $2.26 | 3d | 3 | 0.81mi |
| 15645 Ocean Walk Cir Fort Myers, FL | 3.0 | 2.0 | 1287 | $3,699 | $2.87 | 2d | 2 | 0.81mi |
| 15385 Bellamar Cir #413 Fort Myers, FL | 3.0 | 2.0 | 1043 | $1,600 | $1.53 | 23d | 1 | 0.82mi |
| 15655 Ocean Walk Cir Fort Myers, FL | 1.0–2.0 | 1.0–2.0 | 856 | $3,200 | $3.74 | 14d | 2 | 0.82mi |
| 15770 Windward Way Cir #2205 Fort Myers, FL | 2.0 | 2.0 | 1050 | $1,600 | $1.52 | 23d | 1 | 0.83mi |
| 15401 Bellamar Cir #621 Fort Myers, FL | 3.0 | 2.0 | 1040 | $1,700 | $1.63 | 11d | 1 | 0.85mi |
| 11701 Pasetto Ln Unit 1049715P Fort Myers, FL | 3.0 | 2.0 | 1496 | $2,960 | $1.98 | 21d | 1 | 0.85mi |
| 15761 Windward Way Cir #3302 Fort Myers, FL | 2.0 | 2.0 | 1050 | $4,500 | $4.29 | 3d | 1 | 0.86mi |
| 15430 Bellamar Cir #3023 Fort Myers, FL | 3.0 | 2.0 | 1043 | $3,500 | $3.36 | 3d | 1 | 0.88mi |
| 15430 Bellamar Cir Unit 1546283P Fort Myers, FL | 3.0 | 2.0 | 1033 | $1,873 | $1.81 | 14d | 1 | 0.88mi |
| 15430 Bellamar Cir Fort Myers, FL | 3.0 | 2.0 | 1043 | $2,400 | $2.30 | 16d | 2 | 0.88mi |
| 15417 Bellamar Cir #823 Fort Myers, FL | 3.0 | 2.0 | 1043 | $1,650 | $1.58 | 23d | 1 | 0.89mi |
| 15417 Bellamar Cir #823 Fort Myers, FL | 3.0 | 2.0 | 1043 | $1,650 | $1.58 | 21d | 1 | 0.89mi |
| 11711 Pasetto Ln #102 Fort Myers, FL | 2.0 | 2.0 | 1055 | $2,200 | $2.09 | 23d | 1 | 0.89mi |
HOA detail condo
- Monthly dues
- $0 · $0/yr
- Likely covers
- water
- Assessments
- None detected in remarks — confirm with the listing agent.
Listing history 8 events
-
2026-06-17days on market $234,890 Active 11 DOM
-
2026-06-16days on market $234,890 Active 10 DOM
-
2026-06-16days on market $234,890 Active 9 DOM
-
2026-06-13days on market $234,890 Active 7 DOM
-
2026-06-09days on market $234,890 Active 3 DOM
-
2026-06-07$234,890 Active 1 DOM
-
2026-06-02remarks 695-char remark
-
2026-06-02$234,890 Active 1 DOM
ⓘ Source: listings_history table (triggers on properties + properties_extension) + one-shot
backfill from property_details.listing_events for pre-trigger history.
Tax reassessment forecast FL · Resets to sale price
- Current annual tax
- $2,122 · $177/mo
- Projected year-2 tax
- $2,122 · $177/mo
- Expected delta
- $0/yr ($0/mo · 0.0%)
ⓘ Screening estimate from a state-policy table — verify with the county assessor before closing.
Climate risk First Street
- Flood 8/10 Severe FEMA zone AE · 97% chance over 30 yrs
- Wildfire 1/10 Low
- Heat 10/10 Extreme 7 d/yr ≥107°F today · 30 d/yr by 30 yrs out
- Wind 10/10 Extreme 99% chance of damaging wind over 30 yrs
- Air quality 2/10 Low 1 unhealthy d/yr today · 1 by 30 yrs out
Nearby sold comps map
Loading sold comps map…
Walkable amenities ~0.75 mi
Loading nearby amenities…
Taxation est. · year 1
- Rental income
- $28,875
- − Mortgage interest
- −$13,157
- − Property taxes
- −$2,122
- − Insurance
- −$6,293
- − Repairs & maintenance
- −$2,310
- − Management
- −$2,310
- − Depreciation
- −$6,833
- Taxable loss
- −$4,151
- Est. tax savings @ 24.0%
- +$996
- After-tax cash flow
- $611/yr
For passive investors: Depreciation is non-cash, so a rental often shows a tax loss while cash-flowing — sheltering income. Rental losses are passive: they offset passive income freely, and up to $25,000/yr can offset ordinary (W-2) income if you actively participate and your MAGI is under $100k (phasing out to $0 by $150k); unused losses carry forward. On sale, claimed depreciation is recaptured at up to 25%, and gains may owe capital-gains tax (a 1031 exchange can defer both). Figures are a year-1 estimate at your 24.0% rate — not tax advice; consult a CPA.
Schools (NCES district)
- District
- Lee
- NCES district ID
- 1201080
- Math proficiency
- 47% ▼ -11.00%
- Reading proficiency
- 50% ▼ -4.00%
- Median HH income
- $49,518
- Composite
- 41.49/100
- National rank
- #3458
- State rank
- #42 of 73 in FL
Livability — Iona
- Score
- 72/100
- State rank
- #359
- US rank
- #6253
Category grades
Schools grade is shown separately in the Schools card above.
Census & demographics
- Census place
- Iona, FL
- County
- Lee County · 788,662 people
- Metro
- Cape Coral-Fort Myers, FL
- Population (ZIP)
- 37,423
- Household income
- $75,396
- Rent vs Own
- Severe rent burden
- 1944.0
Population outlook (Lee County) Hauer SSP2
- Today (2025)
- 871,946 people
- By 2030
- 955,468 · +9.6%
- By 2040
- 1,113,587 · +27.7%
- By 2050
- 1,256,891 · +44.1%
- By 2075
- 1,560,270 · +78.9%
- By 2100
- 1,726,848 · +98.0%
Race, ethnicity, and origin ACS 2023
- Neighborhood character
- Predominantly White (88%)
- Race & ethnicity
- White 88% Hispanic / Latino 6% Two or more races 5% Black 3% Asian 1%
- Hispanic origin (detail)
- Mexican 1% Puerto Rican 2%
- Common ancestry
- Romanian 5% Lithuanian 4% Slovak 3%
- Foreign-born
- 10% · Canada, Jamaica
- Languages at home
- 90% English-only · Spanish 4% Russian/Polish/Slavic 1% Other Indo-European 1%
Political lean MEDSL · Lee
- 2024 margin
- Strong R (+28.4) · D 35.5% · R 63.9%
- 2008→2024 swing
- -18.0pp toward R · 2008: -10.4pp · 2024: -28.4pp
- All cycles
- 2024: R+28.4 2020: R+19.2 2016: R+20.4 2012: R+16.6 2008: R+10.4
Not yet ingested
- Civics
- —
Market trends
- HPI YoY
- ▼ -102.22%
- Current HPI
- 209.7595
- Rent YoY
- ▼ -1.18%
- Metro
- Cape Coral-Fort Myers, FL
- State GDP YoY
- ▲ 3.28%
- F500 in state
- 36
Industry mix (Fortune 500 HQ in FL)
| Industry | F500 HQs | Revenue |
|---|---|---|
| Industrial Technology | 2 | $29B |
|
||
| Insurance | 2 | $17B |
|
||
| Retail | 1 | $60B |
|
||
| Technology Distribution | 1 | $58B |
|
||
| Homebuilding | 1 | $35B |
|
||
| Technology Manufacturing | 1 | $35B |
|
||
Price history
+217.8% since first listed29 events — show timeline
- 2026-06-02 Listed $234,890 FSBO.com
- 2024-08-18 Listing Removed — FORTMLS
- 2024-07-17 Price Changed $290,000 FORTMLS
- 2024-05-13 Price Changed $300,000 FORTMLS
- 2024-04-29 Price Changed $309,000 FORTMLS
- 2024-04-11 Listed $314,000 FORTMLS
- 2023-05-17 Sold (Public Records) $280,000 Public Records
- 2023-05-17 Sold (MLS) $280,000 FORTMLS
- 2023-04-11 Pending — FORTMLS
- 2023-04-03 Listed $310,000 FORTMLS
- 2017-04-26 Sold (Public Records) $136,000 Public Records
- 2017-04-21 Sold (MLS) $136,000 FORTMLS
- 2017-03-07 Pending — FORTMLS
- 2017-02-23 Price Changed $136,900 FORTMLS
- 2017-01-18 Listed $139,900 FORTMLS
- 2016-06-29 Listing Removed — FORTMLS
- 2016-06-17 Relisted — FORTMLS
- 2016-06-15 Listing Removed — FORTMLS
- 2016-04-13 Price Changed $147,900 FORTMLS
- 2016-03-30 Price Changed $149,900 FORTMLS
- 2016-03-07 Price Changed $154,900 FORTMLS
- 2016-02-17 Listed $159,900 FORTMLS
- 2015-12-11 Price Changed $80,000 FORTMLS
- 2015-12-11 Sold (MLS) $80,000 FORTMLS
- 2015-12-08 Price Changed $89,500 FORTMLS
- 2015-11-22 Pending — FORTMLS
- 2015-11-11 Price Changed $89,500 FORTMLS
- 2015-10-07 Listed $94,500 FORTMLS
- 1982-10-01 Sold (Public Records) $73,900 Public Records
Property tax history
+12.2%/yrLatest (2025): $2,122 · -28.1% YoY. Source: county tax records.
Cash-flow waterfall
monthlySold comps — $/sqft
last 12 mo · ≤1 miLoading sold comps…