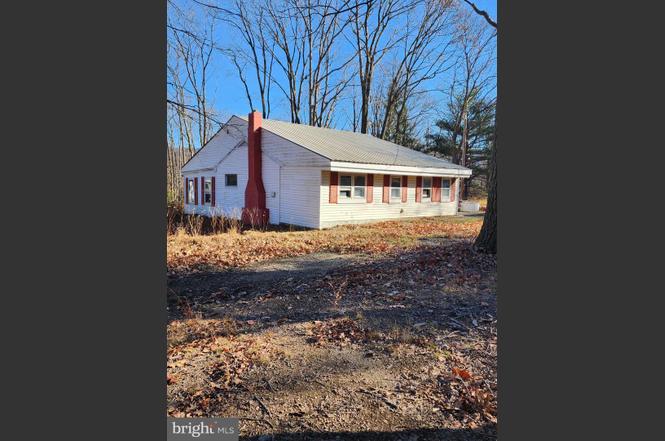
15689 Ridge Rd · Fort Loudon, PA
Flood risk 1/10 · Minimal
- FEMA flood zone
- X (unshaded)
- Chance of flooding over 30 yrs
- 0.0%
- Est. flood insurance / yr
- $507 – $1,088
Fire risk 3/10 · Minor
- Est. fire insurance / yr
- $511 – $949
Heat risk 4/10 · Minor
- Hot days now (above 97°F)
- 7 days/yr
- Hot days in 30 yrs
- 17 days/yr
Wind risk 2/10 · Minimal
- Chance of severe wind over 30 yrs
- 1.0%
Air-quality risk 2/10 · Minimal
- Unhealthy air days now
- 1 days/yr
- Unhealthy air days in 30 yrs
- 1 days/yr
Risk factors via First Street. Map © Google.
Why this score? — see what drove the B+ grade
The composite is a weighted blend of 9 inputs, each scored 0–100. Each bar is that input's sub-score; the figure is the points it added to the 100-point composite (weight × sub-score).
- Cash flow +26.5/30.0
- ARV discount +15.0/15.0
- DSCR +9.0/10.0
- 1% rule +7.1/10.0
- Appreciation +5.4/10.0
- Schools +4.2/10.0
- Livability +3.3/5.0
- Rent growth +2.5/5.0
- Condition / age +2.5/5.0
$90,900
🖨 Deal sheet 📄 Offer letter ✓ Due diligence
Listing remarks
Welcome to the great outdoors. Great mountain setting for this property in the Bricker Development, which includes 2 bedrooms and 1.5 baths. Huge kitchen/living room/ dining room measuring 18'x28'. Close to Cowans Gap State Park and Buchanan State Forest which offers acres of hunting, hiking and nature activities. New appliances, new switches and GCFI outlets. New LED lighting and exhaust fans in the bathrooms. New tub/shower, new bathroom flooring, new hot water heater and expansion tank as well as new line from well to hot water heater. Second bathroom is still under contruction and is ready to be finished. New flooring for 2nd bedroom is ready for installation. All appliances covey. 2 ne
Key facts
- Mountain setting
- New led lighting
- New tub/shower
Tags
Neighborhood map
What this means for you Summary
Snapshot
- This is a 2-bed/1.5-bath single-family listed at $91k.
Deal economics
- At list price, monthly cash flow is $240 ($3k/yr) — positive.
- The deal already cash-flows at list — no discount required.
- Meets the 1% rule at list price ($1k rent vs $91k).
- Recommended offer: $88k (3.0% below list) — sets the bar for market timing.
Location & tenants
- Location reads 66/100 on livability (#1,063 in PA) — a middle-class / working-renter tenant base. Strengths: crime A+, employment A+, housing A+; Watch: schools F, amenities F, commute F.
- Fannett-Metal SD (rural): math 36% / reading 57% proficiency, ranked #448 of 658 in PA (top 68%) — families likely to look elsewhere, expect single-tenant / working-renter base with shorter leases.
- Market conditions: 29 active listings in the ZIP; 633 units permitted in Franklin County in 2024 (112 in 5+ unit buildings).
Forward outlook
- In year one you build about $1k of equity ($628 loan paydown + $731 appreciation (0.8% local appreciation)).
- At projected returns (0.8% appreciation + 3.0% rent growth), your $25k cash investment doubles in ~6 years — after that, you're playing with house money.
Negotiation context
- It's been on market 36 days — a 3% lower offer ($88k) is reasonable based on typical stale-listing flexibility.
- 8 sale attempts since 22y ago; this cycle's ask has dropped $24k (21%) from the opening price — seller is motivated, your offer sets the floor, not the list.
- Current owner paid $60k; list at $91k implies a 52% gain — meaningful room to come down on a strong offer.
Risks & watch-outs
- Watch-outs: built in 1950 — expect roof / HVAC / electrical / plumbing capex.
Questions for the listing agent
- It's been on market 36 days. Have you received any prior offers? Is the seller open to a 3% concession, seller financing, or rate buy-down credit?
- Built in 1950 — when were the roof, HVAC, electrical panel, plumbing, and water heater last replaced?
- Is there a deadline driving the sale (1031 exchange, divorce, estate, relocation)? That informs how much negotiation room exists.
- Schools are F-rated, which usually means shorter tenancies and higher turnover. Who's the typical renter profile here, and what's been the actual vacancy rate?
- What's the average days-on-market for RENTAL listings here right now (not sales)? A rising rental-DOM trend means longer vacancies and softer asking-rent achievability than the comps imply.
- What's the recent tenant-quality profile in this submarket — average credit score on applications, eviction rate, late-payment / NSF rate, and stable-employment percentage? A property-management company in the area should have these aggregated.
- How much new for-sale + rental construction is in the pipeline within 1–3 miles? Heavy new supply typically softens prices + rents 12–24 months out; constrained supply supports both.
Investment metrics
- 1% rule
- 1.21% ✓
- Cap rate
- 9.46%
- Cash-on-cash
- 11.32%
- DSCR
- 1.50
- GRM
- 6.9
CMA / ARV
- ARV (on-the-fly)
- $131,250
- Comps found
- 2
Show comp detail 2 sales within ~0.75 mi
| Address | Dist | Beds/Ba | Sqft | Sold | Price | $/sf | Match |
|---|---|---|---|---|---|---|---|
| 3453 Lakeview Dr | 0.13mi | 3/2.0 (+1) | 1,156 (+10%) | 18mo | $145,000 | $125 | 55 |
| 3375 Dogwood Dr | 0.34mi | 3/1.0 (+1) | 1,162 (+11%) | 9mo | $100,000 | $86 | 52 |
Match score weights: distance 35% · size 25% · config 20% · recency 20%. Top-matched comps best support the ARV.
Projected returns pro-forma
0.8% appreciation · 3.0% rent growth · sell at horizon
- IRR
- 12.6%
- Equity multiple
- 1.63×
- Total profit
- $16,136
- Equity at exit
- $30,110
- IRR
- 16.5%
- Equity multiple
- 2.96×
- Total profit
- $49,814
- Equity at exit
- $39,311
Cash invested: $25,452 (down + closing). Projections, not guarantees.
Landlord ↔ Tenant lean methodology
- Overall (STATE)
- 62 Landlord-Friendly
- State Pennsylvania
- 62 Landlord-Friendly · EVEN
- County
- — inherits STATE
- City
- — inherits STATE
ZIP-level market 17224
- Home prices YoY
- 0.5%
- Active inventory
- 29
- Price-to-rent
- 6.9×
Monthly cashflow live
- Estimated rent
- $1,099 medium interval (Pro) →
- Mortgage (P&I)
- −$477
- Tax est. 1.5%
- −$114 /mo · $1,364/yr
- Insurance
- −$38
- HOA
- −$0
- Vacancy / Maint / Mgmt
- −$231
- Net cashflow
- $240
Break-even live
UW: 25.0% down · 7.5% · 30yr · 1.5% tax · 5.0% vac · 8.0% maint · 8.0% mgmt
Financing live
Cash to close
- Down payment
- $22,725
- Closing costs
- $2,727
- Reserves months
- —
- Total cash needed
- —
Loan-product check · same deal, 3 products live
Conventional
25% down · 7.5% · 30yr
- Down + closing
- —
- Monthly P&I
- —
- Monthly cashflow
- —
- DSCR
- —
- Eligible?
- —
Personal DTI + credit; lowest rate.
DSCR
20% down · 8.5% · 30yr
- Down + closing
- —
- Monthly P&I
- —
- Monthly cashflow
- —
- DSCR
- —
- Eligible?
- —
No personal income docs; deal must DSCR.
Hard money
10% down · 12.0% · 12mo
- Down + closing
- —
- Monthly P&I
- —
- Monthly cashflow
- —
- DSCR
- —
- Eligible?
- —
Short-term bridge; refi at stabilization.
Listing history 36 events
-
2026-04-24$114,900
-
2026-04-24historical
-
2026-04-24historical
-
2026-03-30status Pending
-
2026-03-24historical Active Under Contract
-
2026-03-16price $90,900
-
2026-02-25price $105,900
-
2026-02-16$114,900 Active
-
2026-02-05historical
-
2026-02-01price $114,900
-
2026-01-05$129,900 Active
-
2025-04-04soldstatus $60,000 Closed
-
2025-03-20status Pending
-
2025-03-19historical Active Under Contract
-
2025-03-14$70,000 Active
-
2024-12-18historical
-
2024-11-05price $69,000
-
2024-10-23price $75,000
-
2024-10-05$78,000 Active
-
2024-10-03historical
-
2023-09-01soldstatus $65,000 Closed
-
2023-08-21status Pending
-
2023-08-12price $70,000
-
2023-07-17$85,000 Active
-
2023-06-30historical $85,000
-
2023-04-03historical
-
2023-03-23price $79,900
-
2023-03-01price $79,995
-
2023-02-13price $84,995
-
2023-01-25price $89,900
-
2023-01-19price $89,995
-
2023-01-12price $99,995
-
2022-12-22$109,995 Active
-
2004-07-30soldstatus $67,500
-
2004-06-03historical
-
2004-03-06$70,000
ⓘ Source: listings_history table (triggers on properties + properties_extension) + one-shot
backfill from property_details.listing_events for pre-trigger history.
Climate risk First Street
- Flood 1/10 Low FEMA zone X (unshaded) · 0% chance over 30 yrs
- Wildfire 3/10 Moderate
- Heat 4/10 Moderate 7 d/yr ≥97°F today · 17 d/yr by 30 yrs out
- Wind 2/10 Low 100% chance of damaging wind over 30 yrs
- Air quality 2/10 Low 1 unhealthy d/yr today · 1 by 30 yrs out
Nearby sold comps map
Loading sold comps map…
Walkable amenities ~0.75 mi
Loading nearby amenities…
Taxation est. · year 1
- Rental income
- $13,188
- − Mortgage interest
- −$5,092
- − Property taxes
- −$1,364
- − Insurance
- −$454
- − Repairs & maintenance
- −$1,055
- − Management
- −$1,055
- − Depreciation
- −$2,644
- Taxable income
- $1,524
- Est. tax owed @ 24.0%
- −$366
- After-tax cash flow
- $2,514/yr
For passive investors: Depreciation is non-cash, so a rental often shows a tax loss while cash-flowing — sheltering income. Rental losses are passive: they offset passive income freely, and up to $25,000/yr can offset ordinary (W-2) income if you actively participate and your MAGI is under $100k (phasing out to $0 by $150k); unused losses carry forward. On sale, claimed depreciation is recaptured at up to 25%, and gains may owe capital-gains tax (a 1031 exchange can defer both). Figures are a year-1 estimate at your 24.0% rate — not tax advice; consult a CPA.
Schools (NCES district)
- District
- Fannett-Metal SD
- NCES district ID
- 4209660
- Math proficiency
- 36% ▼ -7.00%
- Reading proficiency
- 57% ▼ -5.00%
- Median HH income
- $46,373
- Composite
- 41.65/100
- National rank
- #7217
- State rank
- #448 of 658 in PA
Livability — Fort Loudon
- Score
- 66/100
- State rank
- #1063
- US rank
- #12020
Category grades
Schools grade is shown separately in the Schools card above.
Census & demographics
- Population (ZIP)
- 1,731
Population outlook (Franklin County) Hauer SSP2
- Today (2025)
- 157,827 people
- By 2030
- 158,933 · +0.7%
- By 2040
- 159,060 · +0.8%
- By 2050
- 155,132 · -1.7%
- By 2075
- 138,545 · -12.2%
- By 2100
- 112,321 · -28.8%
Race, ethnicity, and origin ACS 2023
- Neighborhood character
- Predominantly White (98%)
- Race & ethnicity
- White 98% Two or more races 2% Hispanic / Latino 2%
- Common ancestry
- Iranian 4% Slovak 2% Serbian 1%
- Foreign-born
- 0%
- Languages at home
- 99% English-only · German/W. Germanic 1%
Political lean MEDSL · Franklin
- 2024 margin
- Solid R (+43.0) · D 28.1% · R 71.1%
- 2008→2024 swing
- -10.4pp toward R · 2008: -32.6pp · 2024: -43.0pp
- All cycles
- 2024: R+43.0 2020: R+43.1 2016: R+46.5 2012: R+38.5 2008: R+32.6
Not yet ingested
- Civics
- —
Market trends
- HPI YoY
- ▲ 0.80%
- Current HPI
- 158.5314
- Rent YoY
- —
- Metro
- —
- State GDP YoY
- ▲ 1.68%
- F500 in state
- 34
Industry mix (Fortune 500 HQ in PA)
| Industry | F500 HQs | Revenue |
|---|---|---|
| Healthcare | 2 | $309B |
|
||
| Insurance | 2 | $27B |
|
||
| Telecommunications / Media | 1 | $124B |
|
||
| Industrial Distribution | 1 | $22B |
|
||
| Financial Services | 1 | $20B |
|
||
| Chemicals / Materials | 1 | $18B |
|
||
Price history
+64.1% since first listed36 events — show timeline
- 2026-04-24 Listing Removed — BRIGHT MLS
- 2026-04-24 Listing Removed — BRIGHT MLS
- 2026-04-24 Listed $114,900 BRIGHT MLS
- 2026-03-30 Pending — BRIGHT MLS
- 2026-03-24 Contingent — BRIGHT MLS
- 2026-03-16 Price Changed $90,900 BRIGHT MLS
- 2026-02-25 Price Changed $105,900 BRIGHT MLS
- 2026-02-16 Listed $114,900 BRIGHT MLS
- 2026-02-05 Listing Removed — BRIGHT MLS
- 2026-02-01 Price Changed $114,900 BRIGHT MLS
- 2026-01-05 Listed $129,900 BRIGHT MLS
- 2025-04-04 Sold (MLS) $60,000 BRIGHT MLS
- 2025-03-20 Pending — BRIGHT MLS
- 2025-03-19 Contingent — BRIGHT MLS
- 2025-03-14 Listed $70,000 BRIGHT MLS
- 2024-12-18 Listing Removed — BRIGHT MLS
- 2024-11-05 Price Changed $69,000 BRIGHT MLS
- 2024-10-23 Price Changed $75,000 BRIGHT MLS
- 2024-10-05 Listed $78,000 BRIGHT MLS
- 2024-10-03 Coming Soon — BRIGHT MLS
- 2023-09-01 Sold (MLS) $65,000 BRIGHT MLS
- 2023-08-21 Pending — BRIGHT MLS
- 2023-08-12 Price Changed $70,000 BRIGHT MLS
- 2023-07-17 Listed $85,000 BRIGHT MLS
- 2023-06-30 Coming Soon $85,000 BRIGHT MLS
- 2023-04-03 Listing Removed — BRIGHT MLS
- 2023-03-23 Price Changed $79,900 BRIGHT MLS
- 2023-03-01 Price Changed $79,995 BRIGHT MLS
- 2023-02-13 Price Changed $84,995 BRIGHT MLS
- 2023-01-25 Price Changed $89,900 BRIGHT MLS
- 2023-01-19 Price Changed $89,995 BRIGHT MLS
- 2023-01-12 Price Changed $99,995 BRIGHT MLS
- 2022-12-22 Listed $109,995 BRIGHT MLS
- 2004-07-30 Sold (MLS) $67,500 MRIS
- 2004-06-03 Delisted — MRIS
- 2004-03-06 Listed $70,000 MRIS
Cash-flow waterfall
monthlySold comps — $/sqft
last 12 mo · ≤1 miLoading sold comps…