5055 NE ELLIOTT CIR #217 Plan · Corvallis, OR
Flood risk 1/10 · Minimal
- FEMA flood zone
- X (unshaded)
- Chance of flooding over 30 yrs
- 0.0%
- Est. flood insurance / yr
- $507 – $1,088
Fire risk 4/10 · Minor
- Est. fire insurance / yr
- $498 – $926
Heat risk 4/10 · Minor
- Hot days now (above 92°F)
- 7 days/yr
- Hot days in 30 yrs
- 14 days/yr
Wind risk 1/10 · Minimal
- Chance of severe wind over 30 yrs
- —
Air-quality risk 9/10 · Severe
- Unhealthy air days now
- 12 days/yr
- Unhealthy air days in 30 yrs
- 12 days/yr
Risk factors via First Street. Map © Google.
Why this score? — see what drove the C- grade
The composite is a weighted blend of 9 inputs, each scored 0–100. Each bar is that input's sub-score; the figure is the points it added to the 100-point composite (weight × sub-score).
- Cash flow +21.3/30.0
- DSCR +6.8/10.0
- 1% rule +5.6/10.0
- Schools +4.9/10.0
- Livability +4.1/5.0
- Condition / age +4.0/5.0
- Rent growth +3.9/5.0
- ARV discount +0.0/15.0
- Appreciation +0.0/10.0
$229,500
🖨 Deal sheet 📄 Offer letter ✓ Due diligence
Listing remarks
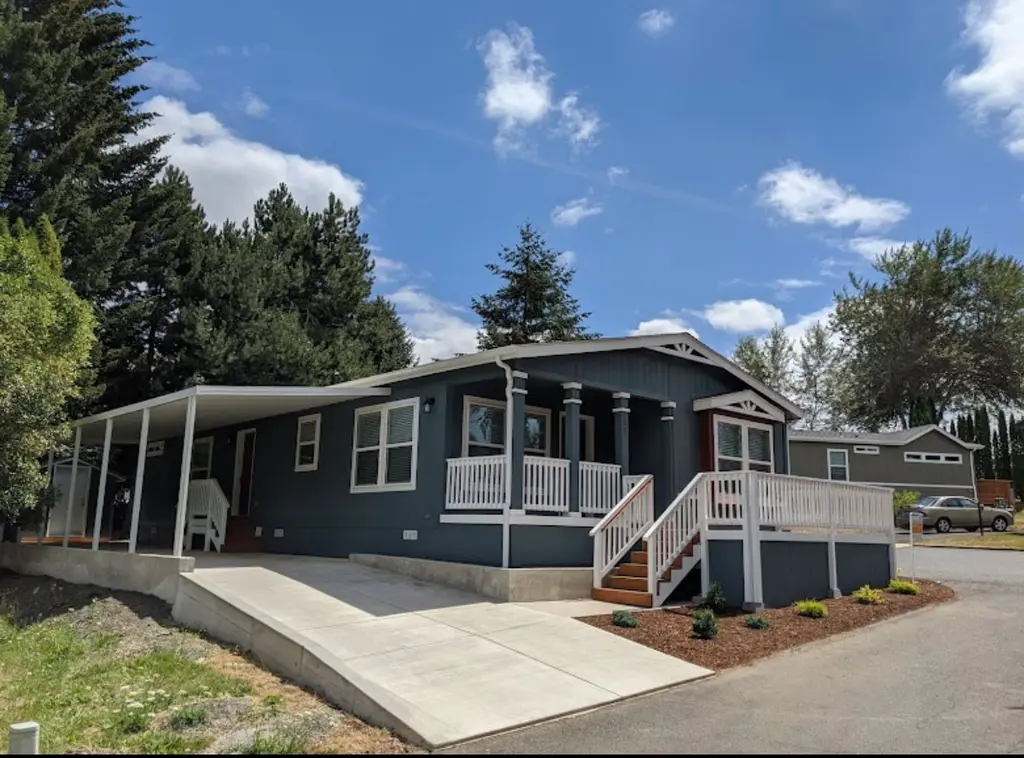
FOR SALE IN A MANUFACTURED HOME COMMUNITY: Brand new manufactured home under construction in Knoll Terrace at lot #217. Complete package includes set-up & delivery, covered carport w/ concrete driveway, walkway, skirting, steps & wood rails, rain gutters, front landscaping and Tuff shed. New kitchen appliances. Pet friendly, no weight or breed restrictions. Premier manufactured home community located in the heart of the Willamette Valley. Monthly space rent incentives and financing available on approval. Call for more info.
Key facts
- Covered carport
- Front landscaping
- Concrete driveway
Tags
Property features AI
Finance
- Financial info: List price $229,500
Exterior
- Utilities: Electric service
- Home design: Plan named '5055 NE ELLIOTT CIR #217'
- Exterior features: Address: 5055 NE Elliott Cir #217, Corvallis, OR
Interior
- Bedrooms: Three bedrooms
- Bathrooms: Two full bathrooms
- Heating & cooling: Electric forced-air heating
- Interior features: Plan home (new construction inventory type); Living area approximately 1404
Neighborhood map
What this means for you Summary
Snapshot
- This is a 3-bed/2.0-bath manufactured listed at $230k. Condition is rated good.
Deal economics
- At list price, monthly cash flow is $338 ($4k/yr) — positive.
- The deal already cash-flows at list — no discount required.
- Meets the 1% rule at list price ($2k rent vs $230k).
- Cap rate 8.1% vs local median 2.6% in Corvallis — top-decile yield for the area; either an underpriced asset or a hidden risk that comps aren't pricing in. Stress-test before assuming the spread holds.
Location & tenants
- Location reads 82/100 on livability (#45 in OR, #1,113 nationally) — a professional / high-income tenant draw. Strengths: amenities A+, commute A+, health & safety A+; Watch: cost of living F.
- Corvallis SD 509J (urban): math 49% / reading 62% proficiency, ranked #15 of 183 in OR (top 8%) — acceptable for families but not a draw, mixed tenant base, ~2y average lease.
- Market conditions: Rents rising fast (+5.7%/yr); 229 active listings in the ZIP; 116 units permitted in Benton County in 2024 (0 in 5+ unit buildings).
- This rent runs 41% of the median local income ($71k/yr) — at the standard rent-burdened threshold; future hikes will face affordability resistance.
Forward outlook
- Local home prices are declining (-3.0%/yr); year-one equity from $2k of loan paydown is wiped out by about $7k of value loss. Plan a longer hold.
- Benton County population projected at +23% by 2050 — long-run rental-demand tailwind backs the buy-and-hold thesis.
- At projected returns (-3.0% appreciation + 5.7% rent growth), your $64k cash investment doubles in ~10 years — after that, you're playing with house money.
Negotiation context
- Only 12 days on market — expect competitive offers; lowballing is unlikely to land.
Questions for the listing agent
- Is there a deadline driving the sale (1031 exchange, divorce, estate, relocation)? That informs how much negotiation room exists.
- Schools are A-rated — typically a magnet for longer-tenancy family renters. What's the average tenant stay here, and is there a school-zone premium baked into asking?
- What's the average days-on-market for RENTAL listings here right now (not sales)? A rising rental-DOM trend means longer vacancies and softer asking-rent achievability than the comps imply.
- What's the recent tenant-quality profile in this submarket — average credit score on applications, eviction rate, late-payment / NSF rate, and stable-employment percentage? A property-management company in the area should have these aggregated.
- How much new for-sale + rental construction is in the pipeline within 1–3 miles? Heavy new supply typically softens prices + rents 12–24 months out; constrained supply supports both.
Investment metrics
- 1% rule
- 1.06% ✓
- Cap rate
- 8.06%
- Cash-on-cash
- 6.31%
- DSCR
- 1.28
- GRM
- 7.9
CMA / ARV
- ARV (on-the-fly)
- $159,600
- Comps found
- 5
Show comp detail 5 sales within ~0.75 mi
| Address | Dist | Beds/Ba | Sqft | Sold | Price | $/sf | Match |
|---|---|---|---|---|---|---|---|
| 5055 NE Elliott Cir #51 | 0.19mi | 4/2.0 (+1) | 1,404 (+0%) | 9mo | $160,000 | $114 | 78 |
| 5055 NE Elliott Cir #35 | 0.19mi | 3/2.0 | 1,512 (+8%) | 6mo | $125,000 | $83 | 73 |
| 5055 NE Elliott Cir #8 | 0.19mi | 2/2.0 (-1) | 1,344 (-4%) | 10mo | $100,000 | $74 | 71 |
| 5055 NE Elliott Cir #30 | 0.19mi | 3/2.0 | 1,512 (+8%) | 19mo | $173,750 | $115 | 62 |
| 5055 NE Elliott Cir #20 | 0.19mi | 3/2.0 | 1,224 (-13%) | 23mo | $174,900 | $143 | 51 |
Match score weights: distance 35% · size 25% · config 20% · recency 20%. Top-matched comps best support the ARV.
Projected returns pro-forma
-3.0% appreciation · 5.74% rent growth · sell at horizon
- IRR
- -3.5%
- Equity multiple
- 0.86×
- Total profit
- $-8,728
- Equity at exit
- $34,219
- IRR
- 9.0%
- Equity multiple
- 1.78×
- Total profit
- $50,210
- Equity at exit
- $19,843
Cash invested: $64,260 (down + closing). Projections, not guarantees.
Landlord ↔ Tenant lean methodology
- Overall (STATE)
- 28 Tenant-Leaning
- State Oregon
- 28 Tenant-Leaning · D+6
- County
- — inherits STATE
- City
- — inherits STATE
ZIP-level market 97330
- Rents YoY
- 5.7%
- Active inventory
- 229
- Price-to-rent
- 7.9×
Monthly cashflow live
- Estimated rent
- $2,435 medium interval (Pro) →
- Mortgage (P&I)
- −$1,204
- Tax est. 1.5%
- −$287 /mo · $3,442/yr
- Insurance
- −$96
- HOA
- −$0
- Vacancy / Maint / Mgmt
- −$511
- Net cashflow
- $338
Break-even live
UW: 25.0% down · 7.5% · 30yr · 1.5% tax · 5.0% vac · 8.0% maint · 8.0% mgmt
Financing live
Cash to close
- Down payment
- $57,375
- Closing costs
- $6,885
- Reserves months
- —
- Total cash needed
- —
Loan-product check · same deal, 3 products live
Conventional
25% down · 7.5% · 30yr
- Down + closing
- —
- Monthly P&I
- —
- Monthly cashflow
- —
- DSCR
- —
- Eligible?
- —
Personal DTI + credit; lowest rate.
DSCR
20% down · 8.5% · 30yr
- Down + closing
- —
- Monthly P&I
- —
- Monthly cashflow
- —
- DSCR
- —
- Eligible?
- —
No personal income docs; deal must DSCR.
Hard money
10% down · 12.0% · 12mo
- Down + closing
- —
- Monthly P&I
- —
- Monthly cashflow
- —
- DSCR
- —
- Eligible?
- —
Short-term bridge; refi at stabilization.
Listing history 10 events
-
2026-06-19days on market $229,500 Active 12 DOM
-
2026-06-18days on market $229,500 Active 11 DOM
-
2026-06-17days on market $229,500 Active 10 DOM
-
2026-06-16days on market $229,500 Active 9 DOM
-
2026-06-15days on market $229,500 Active 8 DOM
-
2026-06-14days on market $229,500 Active 6 DOM
-
2026-06-10days on market $229,500 Active 3 DOM
-
2026-06-09days on market $229,500 Active 2 DOM
-
2026-06-08remarks 534-char remark
-
2026-06-08$229,500 Active 1 DOM
ⓘ Source: listings_history table (triggers on properties + properties_extension) + one-shot
backfill from property_details.listing_events for pre-trigger history.
Climate risk First Street
- Flood 1/10 Low FEMA zone X (unshaded) · 0% chance over 30 yrs
- Wildfire 4/10 Moderate
- Heat 4/10 Moderate 7 d/yr ≥92°F today · 14 d/yr by 30 yrs out
- Wind 1/10 Low
- Air quality 9/10 Extreme 12 unhealthy d/yr today · 12 by 30 yrs out
Nearby sold comps map
Loading sold comps map…
Walkable amenities ~0.75 mi
Loading nearby amenities…
Taxation est. · year 1
- Rental income
- $29,225
- − Mortgage interest
- −$12,856
- − Property taxes
- −$3,442
- − Insurance
- −$1,148
- − Repairs & maintenance
- −$2,338
- − Management
- −$2,338
- − Depreciation
- −$6,676
- Taxable income
- $427
- Est. tax owed @ 24.0%
- −$103
- After-tax cash flow
- $3,953/yr
For passive investors: Depreciation is non-cash, so a rental often shows a tax loss while cash-flowing — sheltering income. Rental losses are passive: they offset passive income freely, and up to $25,000/yr can offset ordinary (W-2) income if you actively participate and your MAGI is under $100k (phasing out to $0 by $150k); unused losses carry forward. On sale, claimed depreciation is recaptured at up to 25%, and gains may owe capital-gains tax (a 1031 exchange can defer both). Figures are a year-1 estimate at your 24.0% rate — not tax advice; consult a CPA.
Condition & rehab AI · 12 photos
This manufactured home is in excellent condition with new appliances, fixtures, and flooring, making it move-in ready and highly attractive for both resale and rental.
Value-add opportunities
- Resale New kitchen appliances — Modern appliances enhance the home's appeal and functionality
- Resale New sink and toilet — Fresh fixtures improve the home's functionality and aesthetic
- Resale New blinds — New blinds enhance privacy and energy efficiency
- Resale New wood-look flooring — New flooring improves the home's appearance and durability
- Rental Landscaping — Well-maintained landscaping enhances curb appeal and tenant satisfaction
Renovation cost estimate screening
Value-add ROI direction
- Resale New kitchen appliances — Modern appliances enhance the home's appeal and functionality ↑
- Resale New sink and toilet — Fresh fixtures improve the home's functionality and aesthetic ↑
- Resale New blinds — New blinds enhance privacy and energy efficiency ↑
- Resale New wood-look flooring — New flooring improves the home's appearance and durability ↑
- Rental Landscaping — Well-maintained landscaping enhances curb appeal and tenant satisfaction ↑
ⓘ Cost ranges are severity-bucket heuristics (US national rule-of-thumb). Get contractor quotes + a written scope before underwriting a rehab budget.
Schools (NCES district)
- District
- Corvallis SD 509J
- NCES district ID
- 4103480
- Math proficiency
- 49% ▼ -3.00%
- Reading proficiency
- 62% ▼ -1.00%
- Median HH income
- $44,820
- Composite
- 48.62/100
- National rank
- #4584
- State rank
- #15 of 183 in OR
Livability — Corvallis
- Score
- 82/100
- State rank
- #45
- US rank
- #1113
Category grades
Schools grade is shown separately in the Schools card above.
Census & demographics
- County
- Benton County · 98,484 people
- City population
- 67,812
- Metro
- Corvallis, OR
- Population (ZIP)
- 43,878
- Household income
- $70,742
- Rent vs Own
- Severe rent burden
- 3416.0
Population outlook (Benton County) Hauer SSP2
- Today (2025)
- 96,963 people
- By 2030
- 101,658 · +4.8%
- By 2040
- 110,157 · +13.6%
- By 2050
- 119,275 · +23.0%
- By 2075
- 145,172 · +49.7%
- By 2100
- 165,349 · +70.5%
Race, ethnicity, and origin ACS 2023
- Neighborhood character
- Predominantly White (75%)
- Race & ethnicity
- White 75% Hispanic / Latino 9% Asian 9% Two or more races 7% Black 2%
- Hispanic origin (detail)
- Mexican 6%
- Common ancestry
- Italian 4% Portuguese 4% Slovak 3%
- Foreign-born
- 13% · Canada, China, South Korea
- Languages at home
- 84% English-only · Spanish 6% Chinese 3% Korean 2%
Political lean MEDSL · Benton
- 2024 margin
- Solid D (+39.6) · D 68.1% · R 28.5% · Other 3.5%
- 2008→2024 swing
- +8.1pp toward D · 2008: 31.5pp · 2024: 39.6pp
- All cycles
- 2024: D+39.6 2020: D+39.7 2016: D+33.8 2012: D+28.8 2008: D+31.5
Not yet ingested
- Civics
- —
Market trends
- HPI YoY
- ▼ -420.12%
- Current HPI
- 298.7746
- Rent YoY
- ▲ 5.74%
- Metro
- Corvallis, OR
- State GDP YoY
- ▲ 2.05%
- F500 in state
- 2
Industry mix (Fortune 500 HQ in OR)
| Industry | F500 HQs | Revenue |
|---|---|---|
| Consumer Goods | 1 | $51B |
|
||
Cash-flow waterfall
monthlySold comps — $/sqft
last 12 mo · ≤1 miLoading sold comps…