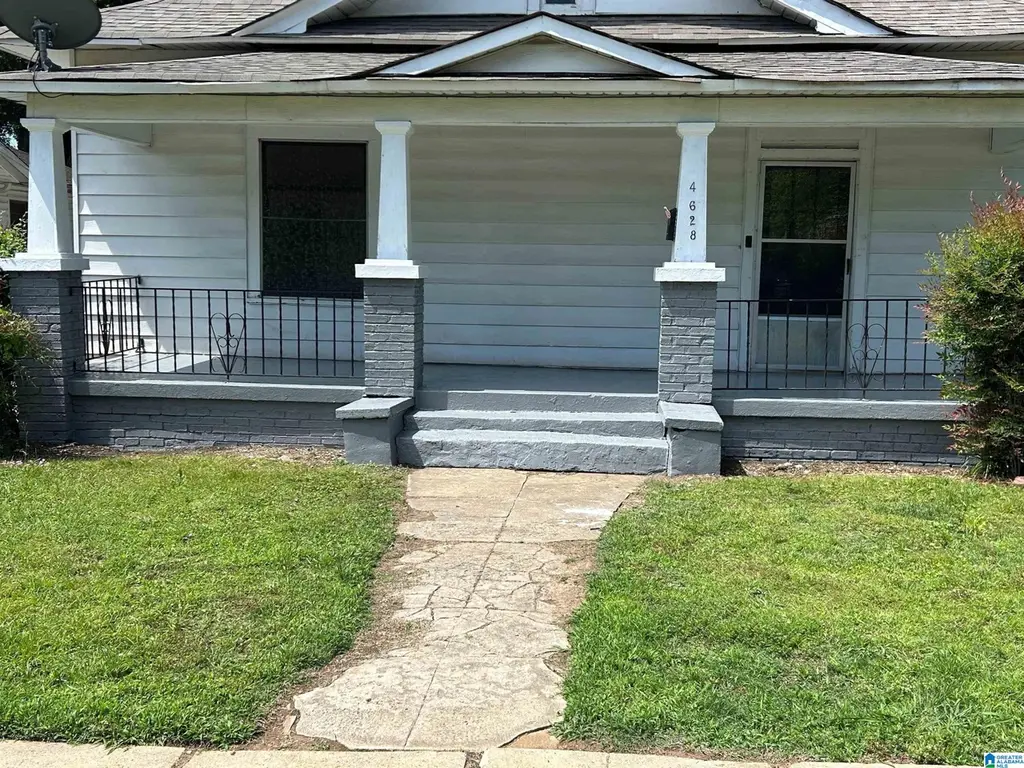
4628 Avenue · Birmingham, AL
Flood risk 1/10 · Minimal
- FEMA flood zone
- X (unshaded)
- Chance of flooding over 30 yrs
- 0.0%
- Est. flood insurance / yr
- $507 – $1,088
Fire risk 1/10 · Minimal
- Est. fire insurance / yr
- $916 – $1,700
Heat risk 7/10 · Major
- Hot days now (above 106°F)
- 7 days/yr
- Hot days in 30 yrs
- 19 days/yr
Wind risk 6/10 · Moderate
- Chance of severe wind over 30 yrs
- 27.0%
Air-quality risk 4/10 · Minor
- Unhealthy air days now
- 5 days/yr
- Unhealthy air days in 30 yrs
- 5 days/yr
Risk factors via First Street. Map © Google.
Why this score? — see what drove the C+ grade
The composite is a weighted blend of 9 inputs, each scored 0–100. Each bar is that input's sub-score; the figure is the points it added to the 100-point composite (weight × sub-score).
- Cash flow +30.0/30.0
- DSCR +10.0/10.0
- 1% rule +9.6/10.0
- Rent growth +4.3/5.0
- Livability +3.4/5.0
- Condition / age +2.5/5.0
- Schools +0.9/10.0
- ARV discount +0.0/15.0
- Appreciation +0.0/10.0
$74,500
🖨 Deal sheet (PDF) 📄 Offer letter ✓ Due diligence
Listing remarks
Welcome to 4628 Ave S, a promising property nestled in the heart of Birmingham, AL 35208—an area gaining attention for its potential, revitalization, and value. Whether you're a savvy investor, first-time buyer, or someone looking to expand your rental portfolio, this home offers a compelling opportunity at an affordable price point. This property features a classic Southern layout with generous living space, offering multiple bedrooms and a functional floor plan that can easily be customized to fit your vision. Large windows invite natural light, creating a warm and inviting atmosphere throughout the home. With solid bones and plenty of character, this residence is ideal for renovati
Key facts
- Large windows
- Natural light
- Spacious lot
Tags
Property features AI
Finance
- Other: Subdivision: Central Park; Approximately 0.16 acres
Exterior
- Parking: Off-street parking
- Utilities: Public water; Connected sewer; Electric water heater; Internet availability unknown
- Home design: Existing construction; Siding vinyl exterior
- Construction: Crawl space foundation
- Exterior features: No pool; No patio; No decks; No garden/patio; Not waterfront; Lot view: none
Interior
- Kitchen: Laminate and solid surface countertops
- Bedrooms: Two bedrooms on the main level
- Flooring: Carpet; Hardwood laminate
- Bathrooms: Two full bathrooms with tub/shower combinations
- Heating & cooling: Electric heating; No air conditioning
- Interior features: Smooth ceilings; No additional interior features listed
- Laundry & utility: Main-level laundry room; Washer hookup; Electric dryer hookup; Utility sink; Laundry room with a pull-down attic access nearby
Neighborhood map
What this means for you Summary
Snapshot
- This is a 2-bed/2.0-bath single-family listed at $74k.
Deal economics
- At list price, monthly cash flow is $359 ($4k/yr) — positive.
- The deal already cash-flows at list — no discount required.
- Meets the 1% rule at list price ($1k rent vs $74k).
- Recommended offer: $73k (1.5% below list) — sets the bar for market timing.
- Cap rate 12.1% vs local median 6.2% in Birmingham — top-decile yield for the area; either an underpriced asset or a hidden risk that comps aren't pricing in. Stress-test before assuming the spread holds.
Location & tenants
- Location reads 67/100 on livability (#78 in AL) — a middle-class / working-renter tenant base. Strengths: commute A+, cost of living A+, housing A+; Watch: amenities C-, crime F, employment F.
- Birmingham City (urban): math 4% / reading 20% proficiency, ranked #116 of 129 in AL (top 90%) — low school quality limits family demand, transient renter base, plan for 1-2y turnover; 82% free/reduced lunch — lower-income household profile, screen leases tightly.
- Zoned schools: Central Park Elementary School (math 0% / reading 12%, grade F, #616 of 627 statewide, top 98%, 447 students, 83% FRL) — zoned schools at 83% FRL track the district average.
- Market conditions: Rents rising fast (+7.2%/yr); 126 active listings in the ZIP; 40 comparable units currently listed for rent nearby; rentals lingering (median 45d on market — plan ~5-8 weeks vacancy on turnover, expect pricing pressure); 50% of comp listings sitting > 30 days — soft ceiling on asking rent; lower-income renter base — watch delinquency; 2,114 units permitted in Jefferson County in 2024 (556 in 5+ unit buildings).
- This rent runs 34% of the median local income ($39k/yr) — at the standard rent-burdened threshold; future hikes will face affordability resistance.
Forward outlook
- Local home prices are declining (-3.0%/yr); year-one equity from $515 of loan paydown is wiped out by about $2k of value loss. Plan a longer hold.
- Jefferson County population projected to shrink 4% by 2050 — rents likely to lag national; underwrite the cash flow, not the appreciation.
- At projected returns (-3.0% appreciation + 7.2% rent growth), your $21k cash investment doubles in ~5 years — after that, you're playing with house money.
Negotiation context
- It's been on market 25 days — a 2% lower offer ($73k) is reasonable based on typical stale-listing flexibility.
- 2 sale attempts since 3y ago with the ask held roughly flat each time — persistent listings suggest the price (not the market) is what's stuck; bring a comps-based counter.
Risks & watch-outs
- Watch-outs: built in 1920 — expect roof / HVAC / electrical / plumbing capex.
- Climate carrying-cost: major wind risk, 27% chance of damaging wind over 30y; extreme-heat days projected 7→19/yr by 2055 (HVAC capex compounding) — expect insurance premiums to compound above CPI over the hold.
Questions for the listing agent
- Built in 1920 — when were the roof, HVAC, electrical panel, plumbing, and water heater last replaced?
- Is there a deadline driving the sale (1031 exchange, divorce, estate, relocation)? That informs how much negotiation room exists.
- Schools are F-rated, which usually means shorter tenancies and higher turnover. Who's the typical renter profile here, and what's been the actual vacancy rate?
- Crime grade is F in this area — have there been break-ins, vandalism, or insurance claims at this property in the last 3 years? What carrier currently insures it and at what premium?
- What's the average days-on-market for RENTAL listings here right now (not sales)? A rising rental-DOM trend means longer vacancies and softer asking-rent achievability than the comps imply.
- What's the recent tenant-quality profile in this submarket — average credit score on applications, eviction rate, late-payment / NSF rate, and stable-employment percentage? A property-management company in the area should have these aggregated.
- How much new for-sale + rental construction is in the pipeline within 1–3 miles? Heavy new supply typically softens prices + rents 12–24 months out; constrained supply supports both.
Investment metrics
- 1% rule
- 1.46% ✓
- Cap rate
- 12.07%
- Cash-on-cash
- 20.64%
- DSCR
- 1.92
- GRM
- 5.7
CMA / ARV
- ARV (on-the-fly)
- $56,960
- Comps found
- 12
Show comp detail 12 sales within ~0.75 mi
| Address | Dist | Beds/Ba | Sqft | Sold | Price | $/sf | Match |
|---|---|---|---|---|---|---|---|
| 4637 Avenue R | 0.19mi | 2/1.0 | 1,378 (-3%) | 3mo | $28,500 | $21 | 79 |
| 1607 43rd St | 0.32mi | 3/2.0 (+1) | 1,435 (+1%) | 5mo | $85,000 | $59 | 74 |
| 4728 Terrace | 0.18mi | 3/2.0 (+1) | 1,276 (-10%) | 4mo | $29,900 | $23 | 66 |
| 1836 Bessemer Rd | 0.13mi | 3/1.0 (+1) | 1,258 (-12%) | 4mo | $55,000 | $44 | 62 |
| 1825 49th St | 0.34mi | 3/1.0 (+1) | 1,532 (+8%) | 4mo | $51,000 | $33 | 59 |
| 1523 44th St E | 0.42mi | 3/2.0 (+1) | 1,307 (-8%) | 5mo | $133,000 | $102 | 57 |
| 4829 Avenue | 0.25mi | 3/1.0 (+1) | 1,247 (-12%) | 5mo | $50,000 | $40 | 54 |
| 3300 Avenue Q | 0.47mi | 2/1.0 | 1,227 (-14%) | 0mo | $35,000 | $29 | 50 |
| 1527 46th Street Ensley | 0.47mi | 3/1.0 (+1) | 1,571 (+10%) | 6mo | $35,000 | $22 | 47 |
| 1113 51st St | 0.50mi | 3/2.0 (+1) | 1,231 (-14%) | 3mo | $204,900 | $166 | 47 |
| 1341 41st St | 0.64mi | 3/1.0 (+1) | 1,340 (-6%) | 6mo | $106,000 | $79 | 47 |
| 1508 W 51st St | 0.61mi | 3/1.5 (+1) | 1,264 (-11%) | 2mo | $30,000 | $24 | 44 |
Match score weights: distance 35% · size 25% · config 20% · recency 20%. Top-matched comps best support the ARV.
Projected returns pro-forma
-3.0% appreciation · 7.24% rent growth · sell at horizon
- IRR
- 17.6%
- Equity multiple
- 1.75×
- Total profit
- $15,630
- Equity at exit
- $11,108
- IRR
- 28.9%
- Equity multiple
- 4.11×
- Total profit
- $64,771
- Equity at exit
- $6,441
Cash invested: $20,860 (down + closing). Projections, not guarantees.
Landlord ↔ Tenant lean methodology
- Overall (STATE)
- 90 Strongly Landlord-Friendly
- State Alabama
- 90 Strongly Landlord-Friendly · R+15
- County
- — inherits STATE
- City
- — inherits STATE
ZIP-level market 35208
- Home prices YoY
- -18.1%
- Rents YoY
- 7.2%
- Active inventory
- 126
- Price-to-rent
- 5.7×
Monthly cashflow live
- Estimated rent
- $1,089 high interval (Pro) →
- Mortgage (P&I)
- −$391
- Tax from tax record
- −$80 /mo · $963/yr
- Insurance
- −$31
- HOA
- −$0
- Vacancy / Maint / Mgmt
- −$229
- Net cashflow
- $359
Break-even live
Sensitivity live
| Price | -10% $401 | -5% $380 | +0% $359 | +5% $338 | +10% $317 |
|---|---|---|---|---|---|
| Rent | -10% $273 | -5% $316 | +0% $359 | +5% $402 | +10% $445 |
| Rate | -1.0pp $396 | -0.5pp $378 | base $359 | +0.5pp $339 | +1.0pp $320 |
UW: 25.0% down · 7.5% · 30yr · 1.5% tax · 5.0% vac · 8.0% maint · 8.0% mgmt
Financing live
Cash to close
- Down payment
- $18,625
- Closing costs
- $2,235
- Reserves months
- —
- Total cash needed
- —
Loan-product check · same deal, 3 products live
Conventional
25% down · 7.5% · 30yr
- Down + closing
- —
- Monthly P&I
- —
- Monthly cashflow
- —
- DSCR
- —
- Eligible?
- —
Personal DTI + credit; lowest rate.
DSCR
20% down · 8.5% · 30yr
- Down + closing
- —
- Monthly P&I
- —
- Monthly cashflow
- —
- DSCR
- —
- Eligible?
- —
No personal income docs; deal must DSCR.
Hard money
10% down · 12.0% · 12mo
- Down + closing
- —
- Monthly P&I
- —
- Monthly cashflow
- —
- DSCR
- —
- Eligible?
- —
Short-term bridge; refi at stabilization.
Rent comps 40 comps
| Address | Beds | Baths | Sqft | Rent | $/sqft | DOM | Units | Dist |
|---|---|---|---|---|---|---|---|---|
| 4637 Court S Birmingham, AL | 3.0 | 1.0 | 1225 | $975 | $0.80 | 3d | 1 | 0.12mi |
| 4612 Terrace S Birmingham, AL | 3.0 | 1.0 | 1612 | $1,050 | $0.65 | 45d | 1 | 0.15mi |
| 4732 Court S Birmingham, AL | 3.0 | 1.0 | 1372 | $1,100 | $0.80 | 45d | 1 | 0.17mi |
| 4736 Court S Birmingham, AL | 3.0 | 1.5 | 1300 | $1,200 | $0.92 | 4d | 1 | 0.18mi |
| 4724 Court R Birmingham, AL | 2.0 | 1.0 | 1016 | $895 | $0.88 | 16d | 1 | 0.18mi |
| 4801 Avenue S Birmingham, AL | 3.0 | 1.0 | 1310 | $1,000 | $0.76 | 45d | 1 | 0.20mi |
| 4619 Terrace Q Birmingham, AL | 3.0 | 2.0 | 1198 | $900 | $0.75 | 45d | 1 | 0.23mi |
| 4105 Avenue Q Unit Q Birmingham, AL | 3.0 | 3.0 | 1760 | $1,250 | $0.71 | 4d | 1 | 0.24mi |
| 4813 Court S Birmingham, AL | 3.0 | 2.0 | 1118 | $1,125 | $1.01 | 45d | 1 | 0.25mi |
| 4825 Avenue S Birmingham, AL | 3.0 | 1.0 | 1310 | $1,050 | $0.80 | 17d | 1 | 0.26mi |
| 4817 Court R Birmingham, AL | 3.0 | 2.0 | 1530 | $1,300 | $0.85 | 17d | 1 | 0.26mi |
| 1617 42nd Street Ensley Unit ENSLEY Birmingham, AL | 3.0 | 1.0 | 1413 | $1,030 | $0.73 | 17d | 1 | 0.29mi |
| 1607 43rd Street Ensley Unit ENSLEY Birmingham, AL | 3.0 | 2.0 | 1435 | $1,150 | $0.80 | 25d | 1 | 0.30mi |
| 1604 44th Street Ensley Unit ENSLEY Birmingham, AL | 3.0 | 1.0 | 1100 | $1,200 | $1.09 | 25d | 1 | 0.32mi |
| 2017 48th Street Ensley Birmingham, AL | 3.0 | 2.0 | 1383 | $1,250 | $0.90 | 45d | 1 | 0.35mi |
| 1540 42nd Street Ensley Unit ENSLEY Birmingham, AL | 2.0 | 1.0 | 899 | $1,037 | $1.15 | 45d | 1 | 0.37mi |
| 2133 47th Street Ensley Unit ENSLEY Birmingham, AL | 3.0 | 1.5 | 1308 | $1,300 | $0.99 | 45d | 1 | 0.39mi |
| 1606 49th Street Ensley Unit ENSLEY Birmingham, AL | 3.0 | 2.0 | 1136 | $1,100 | $0.97 | 45d | 1 | 0.42mi |
| 4929 Avenue R Unit R Birmingham, AL | 2.0 | 1.0 | 962 | $950 | $0.99 | 45d | 1 | 0.42mi |
| 3221 Avenue S Birmingham, AL | 3.0 | 2.0 | 1190 | $1,250 | $1.05 | 25d | 1 | 0.43mi |
| 1509 44th Street Ensley Unit ENSLEY Birmingham, AL | 3.0 | 1.5 | 1260 | $1,123 | $0.89 | 13d | 1 | 0.43mi |
| 1520 41st Street Ensley Birmingham, AL | 3.0 | 2.0 | 1068 | $1,195 | $1.12 | 45d | 1 | 0.44mi |
| 1515 45th Street Ensley Unit ENSLEY Birmingham, AL | 3.0 | 1.0 | 1440 | $875 | $0.61 | 4d | 1 | 0.44mi |
| 1556 Burgin Ave Birmingham, AL | 3.0 | 1.0 | 1168 | $1,100 | $0.94 | 22d | 1 | 0.46mi |
| 1781 51st Street Ensley Unit ENSLEY Birmingham, AL | 3.0 | 1.5 | 1069 | $950 | $0.89 | 45d | 1 | 0.51mi |
| 3009 Prince Ave Birmingham, AL | 3.0 | 2.0 | 1176 | $1,095 | $0.93 | 25d | 1 | 0.53mi |
| 1632 51st St W Birmingham, AL | 3.0 | 1.0 | 1337 | $1,000 | $0.75 | 3d | 1 | 0.53mi |
| 1528 34th Street Ensley Birmingham, AL | 3.0 | 2.0 | 972 | $1,073 | $1.10 | 45d | 1 | 0.53mi |
| 1632 51st Street Ensley Unit ENSLEY Birmingham, AL | 3.0 | 1.0 | 1337 | $1,100 | $0.82 | 45d | 1 | 0.53mi |
| 1429 Warrior Rd Birmingham, AL | 3.0 | 1.0 | 1036 | $850 | $0.82 | 17d | 1 | 0.54mi |
| 1410 46th Street Ensley Unit ENSLEY Birmingham, AL | 3.0 | 1.0 | 1200 | $1,000 | $0.83 | 45d | 1 | 0.57mi |
| 1420 Warrior Rd Birmingham, AL | 3.0 | 1.0 | 1061 | $1,050 | $0.99 | 45d | 1 | 0.57mi |
| 5219 Court Q Birmingham, AL | 3.0 | 2.0 | 1082 | $1,200 | $1.11 | 20d | 1 | 0.59mi |
| 1345 46th Street Ensley Unit ENSLEY Birmingham, AL | 3.0 | 2.0 | 1617 | $1,175 | $0.73 | 4d | 1 | 0.62mi |
| 1417 34th Street Ensley Birmingham, AL | 3.0 | 1.0 | 1103 | $1,025 | $0.93 | 45d | 1 | 0.63mi |
| 2519 Saint Charles Ave SW Birmingham, AL | 2.0 | 1.0 | 990 | $975 | $0.98 | 46d | 1 | 0.65mi |
| 208 22nd St SW Birmingham, AL | 2.0 | 1.0 | 926 | $1,050 | $1.13 | 4d | 1 | 0.66mi |
| 5320 Ter Q Unit Q Birmingham, AL | 3.0 | 2.0 | 1116 | $1,250 | $1.12 | 45d | 1 | 0.66mi |
| 3017 Ensley Ave Birmingham, AL | 3.0 | 1.0 | 1540 | $1,400 | $0.91 | 3d | 1 | 0.69mi |
| 1417 Bessemer Rd Birmingham, AL | 3.0 | 1.0 | 1688 | $1,200 | $0.71 | 45d | 1 | 0.69mi |
Listing history 22 events
-
2026-06-21days on market $74,500 Active 25 DOM
-
2026-06-18days on market $74,500 Active 22 DOM
-
2026-06-17days on market $74,500 Active 21 DOM
-
2026-06-16days on market $74,500 Active 20 DOM
-
2026-06-15days on market $74,500 Active 19 DOM
-
2026-06-13days on market $74,500 Active 17 DOM
-
2026-06-10days on market $74,500 Active 14 DOM
-
2026-06-09days on market $74,500 Active 13 DOM
-
2026-06-08days on market $74,500 Active 12 DOM
-
2026-06-07remarks 693-char remark
-
2026-06-07days on market $74,500 Active 11 DOM
-
2026-06-03days on market $74,500 Active 7 DOM
-
2026-06-02days on market $74,500 Active 6 DOM
-
2026-06-01days on market $74,500 Active 5 DOM
-
2026-05-31days on market $74,500 Active 4 DOM
-
2026-05-27$74,500 Active
-
2025-04-01soldstatus $66,400
-
2024-03-07historical $945
-
2024-02-14price $945
-
2023-11-18$995
-
1996-04-17soldstatus $500
-
1992-01-09soldstatus $16,000
ⓘ Source: listings_history table (triggers on properties + properties_extension) + one-shot
backfill from property_details.listing_events for pre-trigger history.
Tax reassessment forecast AL · Resets to sale price
- Current annual tax
- $963 · $80/mo
- Projected year-2 tax
- $963 · $80/mo
- Expected delta
- $0/yr ($0/mo · 0.0%)
ⓘ Screening estimate from a state-policy table — verify with the county assessor before closing.
Climate risk First Street
- Flood 1/10 Low FEMA zone X (unshaded) · 0% chance over 30 yrs
- Wildfire 1/10 Low
- Heat 7/10 Severe 7 d/yr ≥106°F today · 19 d/yr by 30 yrs out
- Wind 6/10 Major 27% chance of damaging wind over 30 yrs
- Air quality 4/10 Moderate 5 unhealthy d/yr today · 5 by 30 yrs out
Nearby sold comps map
Loading sold comps map…
Walkable amenities ~0.75 mi
Loading nearby amenities…
Taxation est. · year 1
- Rental income
- $13,074
- − Mortgage interest
- −$4,173
- − Property taxes
- −$963
- − Insurance
- −$372
- − Repairs & maintenance
- −$1,046
- − Management
- −$1,046
- − Depreciation
- −$2,167
- Taxable income
- $3,306
- Est. tax owed @ 24.0%
- −$793
- After-tax cash flow
- $3,511/yr
For passive investors: Depreciation is non-cash, so a rental often shows a tax loss while cash-flowing — sheltering income. Rental losses are passive: they offset passive income freely, and up to $25,000/yr can offset ordinary (W-2) income if you actively participate and your MAGI is under $100k (phasing out to $0 by $150k); unused losses carry forward. On sale, claimed depreciation is recaptured at up to 25%, and gains may owe capital-gains tax (a 1031 exchange can defer both). Figures are a year-1 estimate at your 24.0% rate — not tax advice; consult a CPA.
Schools (NCES district)
- District
- Birmingham City
- NCES district ID
- 0100390
- Math proficiency
- 4% ▼ -17.00%
- Reading proficiency
- 20% ▼ -4.00%
- Median HH income
- $31,988
- Composite
- 9.49/100
- National rank
- #9850
- State rank
- #116 of 129 in AL
Livability — Birmingham
- Score
- 67/100
- State rank
- #78
- US rank
- #10412
Category grades
Schools grade is shown separately in the Schools card above.
Census & demographics
- Census place
- Birmingham, AL
- County
- Jefferson County · 527,445 people
- City population
- 210,422
- Metro
- Birmingham-Hoover, AL
- Population (ZIP)
- 13,412
- Household income
- $38,561
- Rent vs Own
- Severe rent burden
- 573.0
Population outlook (Jefferson County) Hauer SSP2
- Today (2025)
- 669,185 people
- By 2030
- 669,694 · +0.1%
- By 2040
- 661,388 · -1.2%
- By 2050
- 643,086 · -3.9%
- By 2075
- 577,267 · -13.7%
- By 2100
- 474,758 · -29.1%
Race, ethnicity, and origin ACS 2023
- Neighborhood character
- Predominantly Black (94%)
- Race & ethnicity
- Black 94% White 4% Hispanic / Latino 2% Two or more races 1%
- Foreign-born
- 3% · Canada
- Languages at home
- 96% English-only · Spanish 2%
Political lean MEDSL · Jefferson
- 2024 margin
- D (+10.4) · D 54.6% · R 44.2% · Other 1.2%
- 2008→2024 swing
- +5.4pp toward D · 2008: 5.1pp · 2024: 10.4pp
- All cycles
- 2024: D+10.4 2020: D+13.2 2016: D+7.2 2012: D+6.0 2008: D+5.1
Not yet ingested
- Civics
- —
Market trends
- HPI YoY
- ▼ -33.99%
- Current HPI
- 153.414
- Rent YoY
- ▲ 7.24%
- Metro
- Birmingham-Hoover, AL
- State GDP YoY
- ▲ 2.94%
- F500 in state
- 4
Industry mix (Fortune 500 HQ in AL)
| Industry | F500 HQs | Revenue |
|---|---|---|
| Financial Services | 1 | $8B |
|
||
| Healthcare | 1 | $5B |
|
||
Price history
+365.6% since first listed7 events — show timeline
- 2026-05-27 Listed $74,500 Greater Alabama MLS
- 2025-04-01 Sold (Public Records) $66,400 Public Records
- 2024-03-07 Rental Removed $945 RENTLY
- 2024-02-14 Price Changed $945 RENTLY
- 2023-11-18 Listed for Rent $995 RENTLY
- 1996-04-17 Sold (Public Records) $500 Public Records
- 1992-01-09 Sold (Public Records) $16,000 Public Records
Property tax history
+3.2%/yrLatest (2025): $963 · +0.0% YoY. Source: county tax records.
Cash-flow waterfall
monthlySold comps — $/sqft
last 12 mo · ≤1 miLoading sold comps…