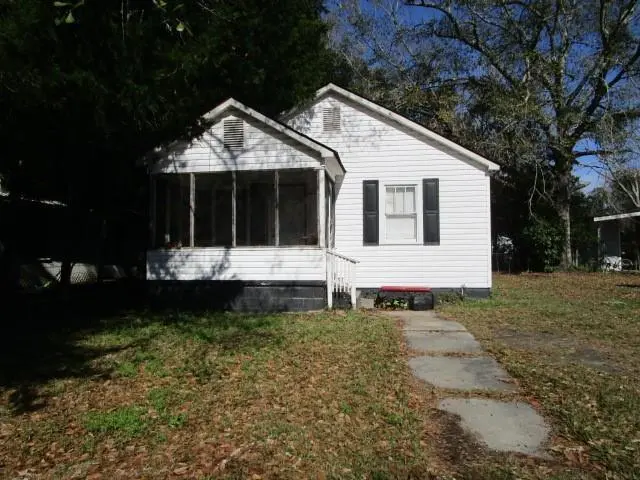
2606 Cameron St · Mobile, AL
Flood risk 1/10 · Minimal
- FEMA flood zone
- X (unshaded)
- Chance of flooding over 30 yrs
- 0.0%
- Est. flood insurance / yr
- $507 – $1,088
Fire risk 1/10 · Minimal
- Est. fire insurance / yr
- $916 – $1,700
Heat risk 9/10 · Severe
- Hot days now (above 105°F)
- 7 days/yr
- Hot days in 30 yrs
- 20 days/yr
Wind risk 9/10 · Severe
- Chance of severe wind over 30 yrs
- 99.0%
Air-quality risk 2/10 · Minimal
- Unhealthy air days now
- 1 days/yr
- Unhealthy air days in 30 yrs
- 1 days/yr
Risk factors via First Street. Map © Google.
Why this score? — see what drove the B+ grade
The composite is a weighted blend of 9 inputs, each scored 0–100. Each bar is that input's sub-score; the figure is the points it added to the 100-point composite (weight × sub-score).
- Cash flow +30.0/30.0
- ARV discount +15.0/15.0
- DSCR +10.0/10.0
- 1% rule +9.2/10.0
- Livability +3.8/5.0
- Rent growth +2.5/5.0
- Condition / age +2.5/5.0
- Schools +2.3/10.0
- Appreciation +0.0/10.0
$95,000
🖨 Deal sheet (PDF) 📄 Offer letter ✓ Due diligence
Listing remarks MLS
Attention Investors! Great investment opportunities!! Fix or flip or add to your rental portfolio. Excellent midtown location walking distance to UMS Wright. This property sits off Tacon & Alexander Street. Nice size lot. Call your favorite realtor today for this gem located in the heart of Mobile, AL. Cabinets & Countertops new. Back Bedroom newly remodeled with new carpet.
Key facts
- New cabinets
- Midtown location
- New countertops
Tags
Neighborhood map
What this means for you Summary
Snapshot
- This is a 3-bed/1.0-bath single-family listed at $95k.
Deal economics
- At list price, monthly cash flow is $491 ($6k/yr) — positive.
- The deal already cash-flows at list — no discount required.
- Meets the 1% rule at list price ($1k rent vs $95k).
- Recommended offer: $84k (12.0% below list) — sets the bar for market timing.
- Cap rate 12.5% vs local median 4.9% in Mobile — top-decile yield for the area; either an underpriced asset or a hidden risk that comps aren't pricing in. Stress-test before assuming the spread holds.
Location & tenants
- Location reads 75/100 on livability (#20 in AL, #4,262 nationally) — a middle-class / working-renter tenant base. Strengths: commute A+, cost of living A+, housing A+; Watch: schools D-, crime F, employment D-.
- Mobile County (urban): math 15% / reading 39% proficiency, ranked #81 of 129 in AL (top 63%) — low school quality limits family demand, transient renter base, plan for 1-2y turnover; 67% free/reduced lunch — lower-income household profile, screen leases tightly.
- Market conditions: 45 active listings in the ZIP; 37 comparable units currently listed for rent nearby; rentals at typical pace (median 22d on market — plan ~3-4 weeks tenant-placement turnaround); 1,678 units permitted in Mobile County in 2024 (264 in 5+ unit buildings).
Forward outlook
- Local home prices are declining (-3.0%/yr); year-one equity from $657 of loan paydown is wiped out by about $3k of value loss. Plan a longer hold.
- Mobile County population projected to shrink 8% by 2050 — rents likely to lag national; underwrite the cash flow, not the appreciation.
- At projected returns (-3.0% appreciation + 3.0% rent growth), your $27k cash investment doubles in ~6 years — after that, you're playing with house money.
Negotiation context
- It's been on market 124 days — a 12% lower offer ($84k) is reasonable based on typical stale-listing flexibility.
Risks & watch-outs
- Climate carrying-cost: severe wind risk, 99% chance of damaging wind over 30y; extreme-heat days projected 7→20/yr by 2055 (HVAC capex compounding) — expect insurance premiums to compound above CPI over the hold.
Questions for the listing agent
- It's been on market 124 days. Have you received any prior offers? Is the seller open to a 12% concession, seller financing, or rate buy-down credit?
- Why hasn't it sold? Are there any deal-killer items the seller is aware of (foundation, flood, title, zoning, code violations)?
- Is there a deadline driving the sale (1031 exchange, divorce, estate, relocation)? That informs how much negotiation room exists.
- Schools are D-rated, which usually means shorter tenancies and higher turnover. Who's the typical renter profile here, and what's been the actual vacancy rate?
- Crime grade is F in this area — have there been break-ins, vandalism, or insurance claims at this property in the last 3 years? What carrier currently insures it and at what premium?
- What's the average days-on-market for RENTAL listings here right now (not sales)? A rising rental-DOM trend means longer vacancies and softer asking-rent achievability than the comps imply.
- What's the recent tenant-quality profile in this submarket — average credit score on applications, eviction rate, late-payment / NSF rate, and stable-employment percentage? A property-management company in the area should have these aggregated.
- How much new for-sale + rental construction is in the pipeline within 1–3 miles? Heavy new supply typically softens prices + rents 12–24 months out; constrained supply supports both.
Investment metrics
- 1% rule
- 1.42% ✓
- Cap rate
- 12.49%
- Cash-on-cash
- 22.15%
- DSCR
- 1.99
- GRM
- 5.9
CMA / ARV
- ARV (median comp)
- $152,969
- List price
- $95,000
- Delta
- -37.90%
- Verdict
- UNDERPRICED
- Comps
- 20 within 1.0 mi
Show comp detail 12 sales within ~0.75 mi
| Address | Dist | Beds/Ba | Sqft | Sold | Price | $/sf | Match |
|---|---|---|---|---|---|---|---|
| 105 Tally Ct W | 0.43mi | 3/1.0 | 1,064 (-6%) | 1mo | $130,000 | $122 | 70 |
| 2507 Myrtle St | 0.42mi | 2/1.0 (-1) | 1,150 (+2%) | 4mo | $169,500 | $147 | 69 |
| 137 Item Ave | 0.28mi | 2/1.0 (-1) | 1,020 (-10%) | 5mo | $89,000 | $87 | 62 |
| 2308 Churchill Dr | 0.65mi | 3/1.0 | 1,149 (+2%) | 8mo | $185,000 | $161 | 60 |
| 2647 Weems Dr | 0.69mi | 3/2.0 | 1,124 (-0%) | 7mo | $175,000 | $156 | 57 |
| 134 Hyland Ave | 0.29mi | 2/2.0 (-1) | 1,272 (+13%) | 2mo | $227,500 | $179 | 55 |
| 61 Sherwood Dr W | 0.54mi | 3/1.0 | 1,251 (+11%) | 4mo | $169,900 | $136 | 54 |
| 57 Westwood St | 0.68mi | 3/1.0 | 1,191 (+6%) | 7mo | $240,000 | $202 | 53 |
| 10 Crenshaw St | 0.66mi | 2/1.0 (-1) | 1,032 (-8%) | 1mo | $163,000 | $158 | 50 |
| 165 Stephens St | 0.63mi | 3/2.0 | 1,200 (+6%) | 8mo | $145,000 | $121 | 49 |
| 1813 Woodcock St | 0.67mi | 3/2.0 | 1,269 (+12%) | 1mo | $195,000 | $154 | 43 |
| 2706 Briley St | 0.62mi | 2/1.0 (-1) | 969 (-14%) | 2mo | $72,000 | $74 | 40 |
Match score weights: distance 35% · size 25% · config 20% · recency 20%. Top-matched comps best support the ARV.
Projected returns pro-forma
-3.0% appreciation · 3.0% rent growth · sell at horizon
- IRR
- 14.9%
- Equity multiple
- 1.60×
- Total profit
- $15,846
- Equity at exit
- $14,165
- IRR
- 23.6%
- Equity multiple
- 3.03×
- Total profit
- $53,947
- Equity at exit
- $8,214
Cash invested: $26,600 (down + closing). Projections, not guarantees.
Landlord ↔ Tenant lean methodology
- Overall (STATE)
- 90 Strongly Landlord-Friendly
- State Alabama
- 90 Strongly Landlord-Friendly · R+15
- County
- — inherits STATE
- City
- — inherits STATE
ZIP-level market 36607
- Active inventory
- 45
- Price-to-rent
- 5.9×
Monthly cashflow live
- Estimated rent
- $1,352 high interval (Pro) →
- Mortgage (P&I)
- −$498
- Tax from tax record
- −$40 /mo · $475/yr
- Insurance
- −$40
- HOA
- −$0
- Vacancy / Maint / Mgmt
- −$284
- Net cashflow
- $491
Break-even live
Sensitivity live
| Price | -10% $545 | -5% $518 | +0% $491 | +5% $464 | +10% $437 |
|---|---|---|---|---|---|
| Rent | -10% $384 | -5% $438 | +0% $491 | +5% $544 | +10% $598 |
| Rate | -1.0pp $539 | -0.5pp $515 | base $491 | +0.5pp $466 | +1.0pp $441 |
UW: 25.0% down · 7.5% · 30yr · 1.5% tax · 5.0% vac · 8.0% maint · 8.0% mgmt
Financing live
Cash to close
- Down payment
- $23,750
- Closing costs
- $2,850
- Reserves months
- —
- Total cash needed
- —
Loan-product check · same deal, 3 products live
Conventional
25% down · 7.5% · 30yr
- Down + closing
- —
- Monthly P&I
- —
- Monthly cashflow
- —
- DSCR
- —
- Eligible?
- —
Personal DTI + credit; lowest rate.
DSCR
20% down · 8.5% · 30yr
- Down + closing
- —
- Monthly P&I
- —
- Monthly cashflow
- —
- DSCR
- —
- Eligible?
- —
No personal income docs; deal must DSCR.
Hard money
10% down · 12.0% · 12mo
- Down + closing
- —
- Monthly P&I
- —
- Monthly cashflow
- —
- DSCR
- —
- Eligible?
- —
Short-term bridge; refi at stabilization.
Rent comps 37 comps
| Address | Beds | Baths | Sqft | Rent | $/sqft | DOM | Units | Dist |
|---|---|---|---|---|---|---|---|---|
| 2604 Dauphin St #210 Mobile, AL | 2.0 | 1.0 | 950 | $1,150 | $1.21 | 21d | 1 | 0.19mi |
| 2604 Dauphin St Mobile, AL | 2.0 | 1.0 | 950 | $1,072 | $1.13 | 44d | 2 | 0.19mi |
| 107 Grand Blvd Mobile, AL | 2.0 | 2.0 | 1200 | $1,295 | $1.08 | 21d | 1 | 0.29mi |
| 2500 Dauphinwood Dr Mobile, AL | 2.0–3.0 | 1.0–2.0 | 1250 | $1,395 | $1.12 | 14d | 19 | 0.30mi |
| 55 Macks St Mobile, AL | 2.0 | 1.0 | 848 | $945 | $1.11 | 21d | 1 | 0.66mi |
| 104 Ellinor St Mobile, AL | 2.0 | 1.0 | 896 | $1,275 | $1.42 | 21d | 1 | 0.66mi |
| 2500 Taylor Ave Mobile, AL | 2.0 | 1.0 | 840 | $1,195 | $1.42 | 44d | 1 | 0.68mi |
| 2507 Taylor Ave Mobile, AL | 3.0 | 1.0 | 1230 | $1,495 | $1.22 | 14d | 1 | 0.69mi |
| 200 S Florida St Unit 101 Mobile, AL | 2.0 | 2.0 | 1150 | $1,375 | $1.20 | 21d | 1 | 0.72mi |
| 150 Dunn Ave Mobile, AL | 3.0 | 2.0 | 1455 | $1,250 | $0.86 | 21d | 1 | 0.74mi |
| 156 Hemley Ave Mobile, AL | 3.0 | 1.0 | 936 | $1,195 | $1.28 | 44d | 1 | 0.75mi |
| 2503 Richard Ave Mobile, AL | 2.0 | 1.0 | 928 | $805 | $0.87 | 14d | 1 | 0.75mi |
| 168 W Collins St Mobile, AL | 3.0 | 1.0 | 968 | $725 | $0.75 | 21d | 1 | 0.77mi |
| 186 Stanton Rd Mobile, AL | 1.0–3.0 | 1.0–2.5 | 1263 | $2,450 | $1.94 | 44d | 1 | 0.86mi |
| 2656 Pathway Pl Mobile, AL | 2.0–3.0 | 1.0 | 778 | $1,261 | $1.62 | 14d | 9 | 0.88mi |
| 2855 Potter Dr Mobile, AL | 2.0 | 1.0 | 1127 | $1,050 | $0.93 | 44d | 1 | 0.90mi |
| 2850 Edgewood St Mobile, AL | 2.0 | 1.0 | 816 | $1,000 | $1.23 | 21d | 1 | 0.92mi |
| 2861 Potter Dr Unit 1043844P Mobile, AL | 3.0 | 2.0 | 1496 | $2,492 | $1.67 | 21d | 1 | 0.92mi |
| 2863 Potter Dr Unit 1043693P Mobile, AL | 4.0 | 2.0 | 1496 | $3,049 | $2.04 | 14d | 1 | 0.92mi |
| 423 Devon Dr Mobile, AL | 3.0 | 1.0 | 1220 | $950 | $0.78 | 44d | 1 | 0.97mi |
| 3060 Emogene St Mobile, AL | 3.0 | 1.0 | 1200 | $1,400 | $1.17 | 14d | 1 | 1.02mi |
| 2853 Josephine St Mobile, AL | 2.0 | 1.0 | 780 | $975 | $1.25 | 21d | 1 | 1.03mi |
| 2859 Brierwood Dr Mobile, AL | 3.0 | 1.0 | 1057 | $1,500 | $1.42 | 14d | 1 | 1.06mi |
| 402 Havens St Mobile, AL | 4.0 | 2.0 | 960 | $1,350 | $1.41 | 14d | 1 | 1.09mi |
| 209 S Fulton St Mobile, AL | 2.0 | 1.5 | 1255 | $1,750 | $1.39 | 21d | 1 | 1.09mi |
| 182 Williams St Unit 1043570P Mobile, AL | 3.0 | 1.0 | 1399 | $2,476 | $1.77 | 14d | 1 | 1.10mi |
| 129 Shell Road Pl Unit 1043713P Mobile, AL | 4.0 | 2.0 | 1496 | $3,389 | $2.27 | 21d | 1 | 1.14mi |
| 305 Indian Creek Dr E Unit 1043809P Mobile, AL | 3.0 | 2.5 | 1496 | $3,985 | $2.66 | 14d | 1 | 1.18mi |
| 276 S Sage Ave Mobile, AL | 1.0–2.0 | 1.0 | 850 | $1,055 | $1.24 | 44d | 1 | 1.22mi |
| 120 Paris Ave Mobile, AL | 2.0 | 1.0 | 1054 | $1,150 | $1.09 | 21d | 1 | 1.26mi |
| 418 Durande Dr Mobile, AL | 3.0 | 2.0 | 1456 | $1,350 | $0.93 | 14d | 1 | 1.26mi |
| 400 Westwood St Mobile, AL | 1.0–2.0 | 1.0 | 750 | $1,005 | $1.34 | 44d | 1 | 1.27mi |
| 122 Demouy Ave Unit 1/2 Mobile, AL | 2.0 | 1.0 | 1300 | $1,530 | $1.18 | 44d | 1 | 1.28mi |
| 3252 Orleans St Mobile, AL | 2.0 | 1.0 | 900 | $850 | $0.94 | 44d | 1 | 1.28mi |
| 510 Schwartz St Mobile, AL | 3.0 | 2.0 | 1288 | $1,400 | $1.09 | 14d | 1 | 1.40mi |
| 1704 McGill Ave Unit B Mobile, AL | 3.0 | 2.5 | 1500 | $1,750 | $1.17 | 44d | 1 | 1.48mi |
| 672 Burden St Mobile, AL | 3.0 | 1.5 | 1421 | $1,300 | $0.91 | 21d | 1 | 1.48mi |
Listing history 4 events
-
2026-05-19status Pending 389-char remark
Show marketing remark (389 chars)
Attention Investors! Great investment opportunities!! Fix or flip or add to your rental portfolio. Excellent midtown location walking distance to UMS Wright. This property sits off Tacon & Alexander Street. Nice size lot. Call your favorite realtor today for this gem located in the heart of Mobile, AL. Cabinets & Countertops new. Back Bedroom newly remodeled with new carpet.
-
2026-04-28price $95,000 389-char remark
Show marketing remark (389 chars)
Attention Investors! Great investment opportunities!! Fix or flip or add to your rental portfolio. Excellent midtown location walking distance to UMS Wright. This property sits off Tacon & Alexander Street. Nice size lot. Call your favorite realtor today for this gem located in the heart of Mobile, AL. Cabinets & Countertops new. Back Bedroom newly remodeled with new carpet.
-
2026-02-26price $99,900 389-char remark
Show marketing remark (389 chars)
Attention Investors! Great investment opportunities!! Fix or flip or add to your rental portfolio. Excellent midtown location walking distance to UMS Wright. This property sits off Tacon & Alexander Street. Nice size lot. Call your favorite realtor today for this gem located in the heart of Mobile, AL. Cabinets & Countertops new. Back Bedroom newly remodeled with new carpet.
-
2026-01-15$105,500 Active 389-char remark
Show marketing remark (389 chars)
Attention Investors! Great investment opportunities!! Fix or flip or add to your rental portfolio. Excellent midtown location walking distance to UMS Wright. This property sits off Tacon & Alexander Street. Nice size lot. Call your favorite realtor today for this gem located in the heart of Mobile, AL. Cabinets & Countertops new. Back Bedroom newly remodeled with new carpet.
ⓘ Source: listings_history table (triggers on properties + properties_extension) + one-shot
backfill from property_details.listing_events for pre-trigger history.
Tax reassessment forecast AL · Resets to sale price
- Current annual tax
- $475 · $40/mo
- Projected year-2 tax
- $475 · $40/mo
- Expected delta
- $0/yr ($0/mo · 0.0%)
ⓘ Screening estimate from a state-policy table — verify with the county assessor before closing.
Climate risk First Street
- Flood 1/10 Low FEMA zone X (unshaded) · 0% chance over 30 yrs
- Wildfire 1/10 Low
- Heat 9/10 Extreme 7 d/yr ≥105°F today · 20 d/yr by 30 yrs out
- Wind 9/10 Extreme 99% chance of damaging wind over 30 yrs
- Air quality 2/10 Low 1 unhealthy d/yr today · 1 by 30 yrs out
Nearby sold comps map
Loading sold comps map…
Walkable amenities ~0.75 mi
Loading nearby amenities…
Taxation est. · year 1
- Rental income
- $16,228
- − Mortgage interest
- −$5,321
- − Property taxes
- −$475
- − Insurance
- −$475
- − Repairs & maintenance
- −$1,298
- − Management
- −$1,298
- − Depreciation
- −$2,764
- Taxable income
- $4,596
- Est. tax owed @ 24.0%
- −$1,103
- After-tax cash flow
- $4,788/yr
For passive investors: Depreciation is non-cash, so a rental often shows a tax loss while cash-flowing — sheltering income. Rental losses are passive: they offset passive income freely, and up to $25,000/yr can offset ordinary (W-2) income if you actively participate and your MAGI is under $100k (phasing out to $0 by $150k); unused losses carry forward. On sale, claimed depreciation is recaptured at up to 25%, and gains may owe capital-gains tax (a 1031 exchange can defer both). Figures are a year-1 estimate at your 24.0% rate — not tax advice; consult a CPA.
Schools (NCES district)
- District
- Mobile County
- NCES district ID
- 0102370
- Math proficiency
- 15% ▼ -28.00%
- Reading proficiency
- 39% ▬ 0.00%
- Median HH income
- $42,455
- Composite
- 22.9/100
- National rank
- #8002
- State rank
- #81 of 129 in AL
Livability — Mobile
- Score
- 75/100
- State rank
- #20
- US rank
- #4262
Category grades
Schools grade is shown separately in the Schools card above.
Census & demographics
- Census place
- Mobile, AL
- City population
- 205,729
- Population (ZIP)
- 5,529
Population outlook (Mobile County) Hauer SSP2
- Today (2025)
- 415,303 people
- By 2030
- 411,755 · -0.9%
- By 2040
- 399,670 · -3.8%
- By 2050
- 382,616 · -7.9%
- By 2075
- 337,353 · -18.8%
- By 2100
- 283,391 · -31.8%
Race, ethnicity, and origin ACS 2023
- Neighborhood character
- Majority Black (56%)
- Race & ethnicity
- Black 56% White 40% Two or more races 3%
- Common ancestry
- Slovak 4% Lithuanian 2% Scotch-Irish 1%
- Foreign-born
- 1%
Political lean MEDSL · Mobile
- 2024 margin
- R (+16.4) · D 41.3% · R 57.7%
- 2008→2024 swing
- -7.7pp toward R · 2008: -8.7pp · 2024: -16.4pp
- All cycles
- 2024: R+16.4 2020: R+11.9 2016: R+13.9 2012: R+9.3 2008: R+8.7
Not yet ingested
- Civics
- —
Market trends
- HPI YoY
- ▼ -155.04%
- Current HPI
- 127.0483
- Rent YoY
- —
- Metro
- —
- State GDP YoY
- ▲ 2.94%
- F500 in state
- 4
Industry mix (Fortune 500 HQ in AL)
| Industry | F500 HQs | Revenue |
|---|---|---|
| Financial Services | 1 | $8B |
|
||
| Healthcare | 1 | $5B |
|
||
Price history
-10.0% since first listed4 events — show timeline
- 2026-05-19 Pending — GCMLS AL
- 2026-04-28 Price Changed $95,000 GCMLS AL
- 2026-02-26 Price Changed $99,900 GCMLS AL
- 2026-01-15 Listed $105,500 GCMLS AL
Property tax history
-4.9%/yrLatest (2025): $475 · +3.9% YoY. Source: county tax records.
Cash-flow waterfall
monthlySold comps — $/sqft
last 12 mo · ≤1 miLoading sold comps…