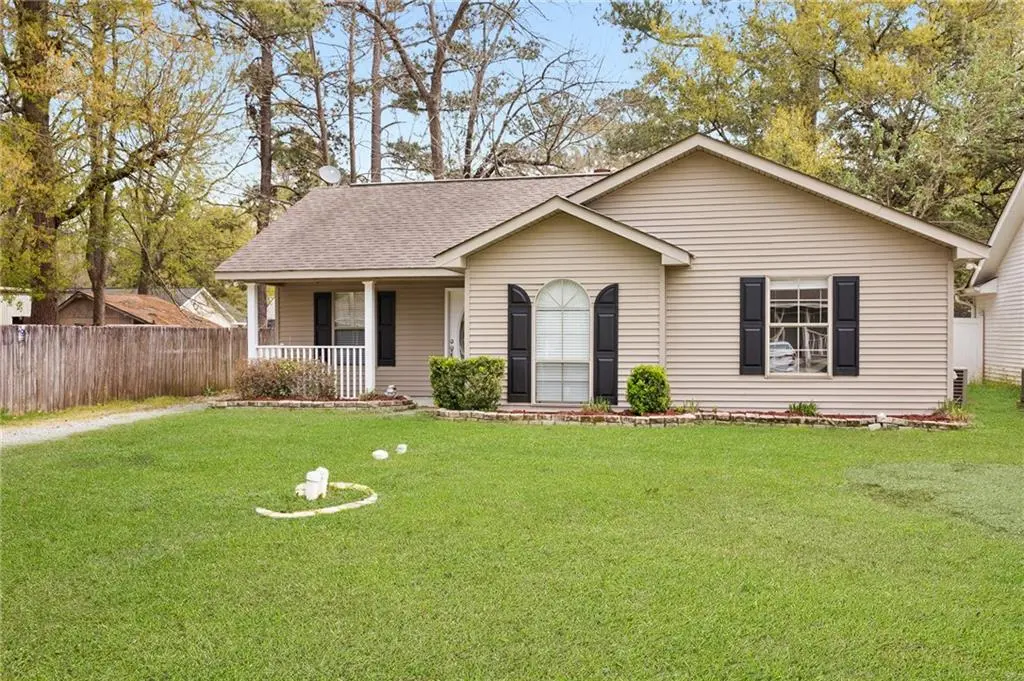
70296 F St · Covington, LA
Flood risk 1/10 · Minimal
- FEMA flood zone
- X
- Chance of flooding over 30 yrs
- 0.0%
- Est. flood insurance / yr
- $507 – $1,088
Fire risk 3/10 · Minor
- Est. fire insurance / yr
- $1,269 – $2,357
Heat risk 10/10 · Severe
- Hot days now (above 109°F)
- 7 days/yr
- Hot days in 30 yrs
- 22 days/yr
Wind risk 9/10 · Severe
- Chance of severe wind over 30 yrs
- 99.0%
Air-quality risk 2/10 · Minimal
- Unhealthy air days now
- 0 days/yr
- Unhealthy air days in 30 yrs
- 1 days/yr
Risk factors via First Street. Map © Google.
Why this score? — see what drove the D+ grade
The composite is a weighted blend of 9 inputs, each scored 0–100. Each bar is that input's sub-score; the figure is the points it added to the 100-point composite (weight × sub-score).
- Cash flow +15.9/30.0
- ARV discount +10.5/15.0
- DSCR +4.9/10.0
- Schools +4.3/10.0
- Livability +3.8/5.0
- 1% rule +3.6/10.0
- Rent growth +3.6/5.0
- Condition / age +2.5/5.0
- Appreciation +0.0/10.0
$209,000
🖨 Deal sheet 📄 Offer letter ✓ Due diligence
Listing remarks MLS
HERE IS YOUR CHANCE TO GRAB AFFORDABLE LIVING IN HIGH-DEMAND ST. TAMMANY PARISH, WITHOUT HAVING TO UPDATE THE INTERIOR * THIS 3BD/2BA HOME OFFERS NEW FLOORING & FRESH PAINT THROUGHOUT * NO CARPET * MUST SEE TO FULLY APPRECIATE * EASY ACCESS TO I-12 & SUPER CLOSE TO SHOPPING, RESTAURANTS, ETC. * KITCHEN OFFERS GRANITE COUNTERTOPS & STAINLESS APPLIANCES * PRIMARY SUITE OFFERS LARGE CLOSET, HIGH CEILINGS, & SOAKING TUB * NICE OPEN FLOOR-PLAN, NEUTRAL COLORS, AND WOOD-BURNING FIREPLACE * THE EXTERIOR FEATURES ABUNDANT OFF-STREET PARKING, FENCED YARD, COZY FRONT PORCH AND A SHED FOR ADDED STORAGE * EASY TO VIEW * CAN CLOSE FAST!!
Key facts
- Fresh paint
- Large closet
- Soaking tub
Tags
Neighborhood map
What this means for you Summary
Snapshot
- This is a 3-bed/2.0-bath single-family listed at $209k.
Deal economics
- At list price, monthly cash flow is $98 ($1k/yr) — positive.
- The deal already cash-flows at list — no discount required.
- To meet the 1% rule (rent ≥ 1% of price), the offer needs to be $180k (13.7% below list).
- Recommended offer: $180k (13.7% below list) — sets the bar for 1% rule.
- Cap rate 6.9% vs local median 3.9% in Covington — top-decile yield for the area; either an underpriced asset or a hidden risk that comps aren't pricing in. Stress-test before assuming the spread holds.
Location & tenants
- Location reads 75/100 on livability (#17 in LA, #3,876 nationally) — a middle-class / working-renter tenant base. Strengths: employment A+, housing A+, health & safety A+; Watch: amenities F, commute F.
- St. Tammany Parish (suburban): math 43% / reading 55% proficiency, ranked #11 of 98 in LA (top 11%) — families likely to look elsewhere, expect single-tenant / working-renter base with shorter leases.
- Market conditions: Rents rising fast (+4.3%/yr); 524 active listings in the ZIP; 28 comparable units currently listed for rent nearby; rentals at typical pace (median 24d on market — plan ~3-4 weeks tenant-placement turnaround); solid renter incomes; 1,064 units permitted in St. Tammany Parish in 2024 (0 in 5+ unit buildings).
Forward outlook
- Local home prices are declining (-3.0%/yr); year-one equity from $1k of loan paydown is wiped out by about $6k of value loss. Plan a longer hold.
- St. Tammany County population projected at +27% by 2050 — long-run rental-demand tailwind backs the buy-and-hold thesis.
Negotiation context
- It's been on market 117 days — a 9% lower offer ($190k) is reasonable based on typical stale-listing flexibility.
- 7 sale attempts since 21y ago with the ask held roughly flat each time — persistent listings suggest the price (not the market) is what's stuck; bring a comps-based counter.
- Current owner paid $140k; 49% above their basis — modest negotiation headroom, anchor on the comps not their cost.
Risks & watch-outs
- Climate carrying-cost: severe wind risk, 99% chance of damaging wind over 30y; extreme-heat days projected 7→22/yr by 2055 (HVAC capex compounding) — expect insurance premiums to compound above CPI over the hold.
Questions for the listing agent
- It's been on market 117 days. Have you received any prior offers? Is the seller open to a 14% concession, seller financing, or rate buy-down credit?
- Why hasn't it sold? Are there any deal-killer items the seller is aware of (foundation, flood, title, zoning, code violations)?
- Is there a deadline driving the sale (1031 exchange, divorce, estate, relocation)? That informs how much negotiation room exists.
- Schools are B-rated — typically a magnet for longer-tenancy family renters. What's the average tenant stay here, and is there a school-zone premium baked into asking?
- The area grade is low — what's the realistic commute time and amenity access for the typical tenant pool here? Any planned neighborhood developments (good or bad) we should know about?
- What's the average days-on-market for RENTAL listings here right now (not sales)? A rising rental-DOM trend means longer vacancies and softer asking-rent achievability than the comps imply.
- What's the recent tenant-quality profile in this submarket — average credit score on applications, eviction rate, late-payment / NSF rate, and stable-employment percentage? A property-management company in the area should have these aggregated.
- How much new for-sale + rental construction is in the pipeline within 1–3 miles? Heavy new supply typically softens prices + rents 12–24 months out; constrained supply supports both.
Investment metrics
- 1% rule
- 0.86% ✗
- Cap rate
- 6.86%
- Cash-on-cash
- 2.01%
- DSCR
- 1.09
- GRM
- 9.7
CMA / ARV
- ARV (median comp)
- $223,812
- List price
- $209,000
- Delta
- -6.62%
- Verdict
- FAIR
- Comps
- 20 within 1.0 mi
Show comp detail 12 sales within ~0.75 mi
| Address | Dist | Beds/Ba | Sqft | Sold | Price | $/sf | Match |
|---|---|---|---|---|---|---|---|
| 70281 C St | 0.08mi | 3/2.0 | 1,463 (+7%) | 2mo | $215,000 | $147 | 84 |
| 70333 H St | 0.14mi | 4/2.0 (+1) | 1,404 (+3%) | 1mo | $239,900 | $171 | 83 |
| 70432 2nd St | 0.39mi | 3/2.0 | 1,347 (-2%) | 2mo | $227,500 | $169 | 78 |
| 70381 L St | 0.38mi | 3/2.0 | 1,322 (-3%) | 1mo | $218,000 | $165 | 76 |
| 70519 K St | 0.49mi | 3/2.0 | 1,374 (+0%) | 1mo | $257,000 | $187 | 76 |
| 70405 F St | 0.21mi | 3/2.0 | 1,200 (-12%) | 1mo | $182,000 | $152 | 68 |
| 70312 7th St | 0.56mi | 3/2.0 | 1,410 (+3%) | 2mo | $224,000 | $159 | 68 |
| 70261 K St | 0.30mi | 3/2.0 | 1,230 (-10%) | 2mo | $245,000 | $199 | 67 |
| 70325 L St | 0.35mi | 3/2.0 | 1,564 (+14%) | 0mo | $190,000 | $121 | 60 |
| 70408 3rd St | 0.41mi | 3/2.0 | 1,163 (-15%) | 1mo | $205,000 | $176 | 55 |
| 70085 4th St | 0.55mi | 3/2.0 | 1,554 (+14%) | 1mo | $252,500 | $162 | 51 |
| 70371 10th St | 0.71mi | 3/2.0 | 1,212 (-12%) | 2mo | $192,500 | $159 | 46 |
Match score weights: distance 35% · size 25% · config 20% · recency 20%. Top-matched comps best support the ARV.
Projected returns pro-forma
-3.0% appreciation · 4.31% rent growth · sell at horizon
- IRR
- -11.8%
- Equity multiple
- 0.57×
- Total profit
- $-25,270
- Equity at exit
- $31,163
- IRR
- -0.9%
- Equity multiple
- 0.93×
- Total profit
- $-4,016
- Equity at exit
- $18,071
Cash invested: $58,520 (down + closing). Projections, not guarantees.
Landlord ↔ Tenant lean methodology
- Overall (STATE)
- 90 Strongly Landlord-Friendly
- State Louisiana
- 90 Strongly Landlord-Friendly · R+12
- County
- — inherits STATE
- City
- — inherits STATE
ZIP-level market 70433
- Rents YoY
- 4.3%
- Active inventory
- 524
- Price-to-rent
- 9.7×
Monthly cashflow live
- Estimated rent
- $1,803 high interval (Pro) →
- Mortgage (P&I)
- −$1,096
- Tax from tax record
- −$143 /mo · $1,717/yr
- Insurance
- −$87
- HOA
- −$0
- Vacancy / Maint / Mgmt
- −$379
- Net cashflow
- $98
Break-even live
UW: 25.0% down · 7.5% · 30yr · 1.5% tax · 5.0% vac · 8.0% maint · 8.0% mgmt
Financing live
Cash to close
- Down payment
- $52,250
- Closing costs
- $6,270
- Reserves months
- —
- Total cash needed
- —
Loan-product check · same deal, 3 products live
Conventional
25% down · 7.5% · 30yr
- Down + closing
- —
- Monthly P&I
- —
- Monthly cashflow
- —
- DSCR
- —
- Eligible?
- —
Personal DTI + credit; lowest rate.
DSCR
20% down · 8.5% · 30yr
- Down + closing
- —
- Monthly P&I
- —
- Monthly cashflow
- —
- DSCR
- —
- Eligible?
- —
No personal income docs; deal must DSCR.
Hard money
10% down · 12.0% · 12mo
- Down + closing
- —
- Monthly P&I
- —
- Monthly cashflow
- —
- DSCR
- —
- Eligible?
- —
Short-term bridge; refi at stabilization.
Rent comps 28 comps
| Address | Beds | Baths | Sqft | Rent | $/sqft | DOM | Units | Dist |
|---|---|---|---|---|---|---|---|---|
| 70361 D St Covington, LA | 3.0 | 2.0 | 1409 | $1,750 | $1.24 | 23d | 1 | 0.10mi |
| 70330 A St Covington, LA | 3.0 | 2.0 | 1163 | $1,600 | $1.38 | 19d | 1 | 0.18mi |
| 70412 1st St Covington, LA | 3.0 | 2.0 | 1182 | $1,700 | $1.44 | 17d | 1 | 0.30mi |
| 70466 1st St Covington, LA | 3.0 | 2.0 | 1443 | $2,100 | $1.46 | 17d | 1 | 0.38mi |
| 70403 L St Covington, LA | 3.0 | 2.0 | 1250 | $1,695 | $1.36 | 43d | 1 | 0.41mi |
| 70293 7th St Covington, LA | 3.0 | 2.0 | 1450 | $1,695 | $1.17 | 43d | 1 | 0.51mi |
| 4025 Monarch Ln Covington, LA | 3.0 | 2.0 | 1853 | $2,800 | $1.51 | 43d | 1 | 0.51mi |
| 70300 7th St Covington, LA | 3.0 | 2.0 | 1448 | $1,750 | $1.21 | 23d | 1 | 0.54mi |
| 70266 7th St Covington, LA | 3.0 | 2.0 | 1736 | $1,575 | $0.91 | 43d | 1 | 0.54mi |
| 70040 2nd St Covington, LA | 3.0 | 2.0 | 1416 | $2,000 | $1.41 | 3d | 1 | 0.60mi |
| 70252 8th St Covington, LA | 3.0 | 2.0 | 1230 | $1,650 | $1.34 | 23d | 1 | 0.60mi |
| 70045 3rd St Covington, LA | 3.0 | 2.0 | 1430 | $1,750 | $1.22 | 3d | 1 | 0.60mi |
| 70439 8th St Covington, LA | 3.0 | 2.0 | 1267 | $1,500 | $1.18 | 23d | 1 | 0.61mi |
| 70076 6th St Covington, LA | 3.0 | 2.0 | 1151 | $1,600 | $1.39 | 23d | 1 | 0.66mi |
| 70371 10th St Covington, LA | 3.0 | 2.0 | 1212 | $1,695 | $1.40 | 43d | 1 | 0.68mi |
| 711 Lionel Ct Abita Springs, LA | 3.0 | 2.0 | 1497 | $2,000 | $1.34 | 23d | 1 | 0.78mi |
| 70096 10th St Covington, LA | 3.0 | 2.0 | 1391 | $1,950 | $1.40 | 17d | 1 | 0.84mi |
| 350 Emerald Forest Blvd Covington, LA | 1.0–2.0 | 1.0–2.0 | 845 | $1,600 | $1.89 | 11d | 2 | 0.84mi |
| 21096 Washington Ave Unit B Abita Springs, LA | 2.0 | 1.5 | 900 | $1,050 | $1.17 | 43d | 1 | 0.93mi |
| 28 Park Place Dr Covington, LA | 1.0–3.0 | 1.0–2.0 | 963 | $1,407 | $1.46 | 1d | 9 | 0.96mi |
| 212 Covington Cottage Ln Covington, LA | 3.0 | 2.0 | 1690 | $2,275 | $1.35 | 43d | 1 | 1.04mi |
| 2021 Sullivan Ln Covington, LA | 1.0–2.0 | 1.0–2.0 | 860 | $1,856 | $2.16 | 2d | 18 | 1.21mi |
| 445 Tiger Ave Covington, LA | 3.0 | 2.0 | 1538 | $2,300 | $1.50 | 23d | 1 | 1.28mi |
| 3 Hollycrest Blvd Covington, LA | 2.0 | 2.0 | 1413 | $1,495 | $1.06 | 2d | 1 | 1.28mi |
| 308 Robinhood Dr Covington, LA | 3.0 | 2.0 | 1650 | $1,800 | $1.09 | 3d | 1 | 1.39mi |
| 140 Holiday Blvd Covington, LA | 2.0 | 1.0–2.0 | 652 | $1,525 | $2.34 | 1d | 12 | 1.41mi |
| 110 Robinhood Dr Covington, LA | 3.0 | 2.0 | 1600 | $1,500 | $0.94 | 43d | 1 | 1.46mi |
| 19425 Slemmer Rd Unit 2 Covington, LA | 3.0 | 2.0 | 1100 | $1,100 | $1.00 | 21d | 1 | 1.50mi |
Listing history 25 events
-
2026-06-18days on market $209,000 Active 117 DOM
-
2026-06-17days on market $209,000 Active 116 DOM
-
2026-06-16days on market $209,000 Active 115 DOM
-
2026-06-15days on market $209,000 Active 114 DOM
-
2026-06-13pricedays on market $209,000 Active 112 DOM
-
2026-06-10days on market $219,000 Active 109 DOM
-
2026-06-09days on market $219,000 Active 108 DOM
-
2026-06-08days on market $219,000 Active 107 DOM
-
2026-06-07days on market $219,000 Active 106 DOM
-
2026-06-03days on market $219,000 Active 102 DOM
-
2026-06-02days on market $219,000 Active 101 DOM
-
2026-06-01days on market $219,000 Active 100 DOM
-
2026-05-31days on market $219,000 Active 99 DOM
-
2026-02-21$219,000 Active 648-char remark
Show marketing remark (675 chars)
HERE IS YOUR CHANCE TO GRAB AFFORDABLE LIVING IN HIGH-DEMAND ST. TAMMANY PARISH, WITHOUT HAVING TO UPDATE THE INTERIOR * THIS 3BD/2BA HOME OFFERS NEW FLOORING & FRESH PAINT THROUGHOUT * NO CARPET * MUST SEE TO FULLY APPRECIATE * EASY ACCESS TO I-12 & SUPER CLOSE TO SHOPPING, RESTAURANTS, ETC. * KITCHEN OFFERS GRANITE COUNTERTOPS & STAINLESS APPLIANCES * PRIMARY SUITE OFFERS LARGE CLOSET, HIGH CEILINGS, & SOAKING TUB * NICE OPEN FLOOR-PLAN, NEUTRAL COLORS, AND WOOD-BURNING FIREPLACE * THE EXTERIOR FEATURES ABUNDANT OFF-STREET PARKING, FENCED YARD, COZY FRONT PORCH AND A SHED FOR ADDED STORAGE * EASY TO VIEW * CAN CLOSE FAST!!
-
2026-02-21$219,000 Active 675-char remark
Show marketing remark (675 chars)
HERE IS YOUR CHANCE TO GRAB AFFORDABLE LIVING IN HIGH-DEMAND ST. TAMMANY PARISH, WITHOUT HAVING TO UPDATE THE INTERIOR * THIS 3BD/2BA HOME OFFERS NEW FLOORING & FRESH PAINT THROUGHOUT * NO CARPET * MUST SEE TO FULLY APPRECIATE * EASY ACCESS TO I-12 & SUPER CLOSE TO SHOPPING, RESTAURANTS, ETC. * KITCHEN OFFERS GRANITE COUNTERTOPS & STAINLESS APPLIANCES * PRIMARY SUITE OFFERS LARGE CLOSET, HIGH CEILINGS, & SOAKING TUB * NICE OPEN FLOOR-PLAN, NEUTRAL COLORS, AND WOOD-BURNING FIREPLACE * THE EXTERIOR FEATURES ABUNDANT OFF-STREET PARKING, FENCED YARD, COZY FRONT PORCH AND A SHED FOR ADDED STORAGE * EASY TO VIEW * CAN CLOSE FAST!!
-
2025-03-25$235,000 Active
-
2022-03-11soldstatus $140,000
-
2010-08-06soldstatus $110,000
-
2010-05-05$114,900
-
2010-05-05$114,900
-
2005-10-25soldstatus $140,000
-
2005-10-20soldstatus $140,000
-
2005-09-20$140,000
-
2005-09-20$140,000
-
2004-10-18soldstatus $113,300
ⓘ Source: listings_history table (triggers on properties + properties_extension) + one-shot
backfill from property_details.listing_events for pre-trigger history.
Tax reassessment forecast LA · Resets to sale price
- Current annual tax
- $1,717 · $143/mo
- Projected year-2 tax
- $1,717 · $143/mo
- Expected delta
- $0/yr ($0/mo · 0.0%)
ⓘ Screening estimate from a state-policy table — verify with the county assessor before closing.
Climate risk First Street
- Flood 1/10 Low FEMA zone X · 0% chance over 30 yrs
- Wildfire 3/10 Moderate
- Heat 10/10 Extreme 7 d/yr ≥109°F today · 22 d/yr by 30 yrs out
- Wind 9/10 Extreme 99% chance of damaging wind over 30 yrs
- Air quality 2/10 Low 0 unhealthy d/yr today · 1 by 30 yrs out
Nearby sold comps map
Loading sold comps map…
Walkable amenities ~0.75 mi
Loading nearby amenities…
Taxation est. · year 1
- Rental income
- $21,632
- − Mortgage interest
- −$11,707
- − Property taxes
- −$1,717
- − Insurance
- −$1,045
- − Repairs & maintenance
- −$1,731
- − Management
- −$1,731
- − Depreciation
- −$6,080
- Taxable loss
- −$2,379
- Est. tax savings @ 24.0%
- +$571
- After-tax cash flow
- $1,746/yr
For passive investors: Depreciation is non-cash, so a rental often shows a tax loss while cash-flowing — sheltering income. Rental losses are passive: they offset passive income freely, and up to $25,000/yr can offset ordinary (W-2) income if you actively participate and your MAGI is under $100k (phasing out to $0 by $150k); unused losses carry forward. On sale, claimed depreciation is recaptured at up to 25%, and gains may owe capital-gains tax (a 1031 exchange can defer both). Figures are a year-1 estimate at your 24.0% rate — not tax advice; consult a CPA.
Schools (NCES district)
- District
- St. Tammany Parish
- NCES district ID
- 2201650
- Math proficiency
- 43% ▼ -32.00%
- Reading proficiency
- 55% ▼ -26.00%
- Median HH income
- $61,752
- Composite
- 43.04/100
- National rank
- #3098
- State rank
- #11 of 98 in LA
Livability — Covington
- Score
- 75/100
- State rank
- #17
- US rank
- #3876
Category grades
Schools grade is shown separately in the Schools card above.
Census & demographics
- County
- Saint Tammany Parish · 228,296 people
- City population
- 64,351
- Metro
- New Orleans-Metairie, LA
- Population (ZIP)
- 41,876
- Household income
- $81,241
- Rent vs Own
- Severe rent burden
- 1287.0
Population outlook (St. Tammany County) Hauer SSP2
- Today (2025)
- 286,725 people
- By 2030
- 304,175 · +6.1%
- By 2040
- 336,203 · +17.3%
- By 2050
- 364,590 · +27.2%
- By 2075
- 433,362 · +51.1%
- By 2100
- 470,333 · +64.0%
Race, ethnicity, and origin ACS 2023
- Neighborhood character
- Predominantly White (78%)
- Race & ethnicity
- White 78% Black 9% Hispanic / Latino 7% Two or more races 7% Native American 1% Asian 1%
- Hispanic origin (detail)
- Mexican 2%
- Common ancestry
- Lithuanian 17% Italian 2% Slovak 2%
- Foreign-born
- 5% · Canada, Vietnam
- Languages at home
- 92% English-only · Spanish 5% French/Haitian/Cajun 1% Vietnamese 1%
Political lean MEDSL · St. Tammany
- 2024 margin
- Solid R (+43.8) · D 27.3% · R 71.1% · Other 1.6%
- 2008→2024 swing
- +9.6pp toward D · 2008: -53.4pp · 2024: -43.8pp
- All cycles
- 2024: R+43.8 2020: R+44.2 2016: R+50.8 2012: R+52.2 2008: R+53.4
Not yet ingested
- Civics
- —
Market trends
- HPI YoY
- ▼ -112.14%
- Current HPI
- 181.8348
- Rent YoY
- ▲ 4.31%
- Metro
- New Orleans-Metairie, LA
- State GDP YoY
- ▲ 3.29%
- F500 in state
- 10
Industry mix (Fortune 500 HQ in LA)
| Industry | F500 HQs | Revenue |
|---|---|---|
| Telecommunications | 2 | $23B |
|
||
| Utilities | 1 | $12B |
|
||
| Wholesale / Distribution | 1 | $5B |
|
||
| Advertising | 1 | $2B |
|
||
Price history
+93.3% since first listed12 events — show timeline
- 2026-02-21 Listed $219,000 GSREIN
- 2026-02-21 Listed $219,000 AcadianaMLS
- 2025-03-25 Listed $235,000 AcadianaMLS
- 2022-03-11 Sold (Public Records) $140,000 Public Records
- 2010-08-06 Sold (MLS) $110,000 GSREIN
- 2010-05-05 Listed $114,900 GSREIN
- 2010-05-05 Listed $114,900 AcadianaMLS
- 2005-10-25 Sold (Public Records) $140,000 Public Records
- 2005-10-20 Sold (MLS) $140,000 GSREIN
- 2005-09-20 Listed $140,000 GSREIN
- 2005-09-20 Listed $140,000 AcadianaMLS
- 2004-10-18 Sold (Public Records) $113,300 Public Records
Property tax history
+0.8%/yrLatest (2025): $1,717 · -3.6% YoY. Source: county tax records.
Cash-flow waterfall
monthlySold comps — $/sqft
last 12 mo · ≤1 miLoading sold comps…