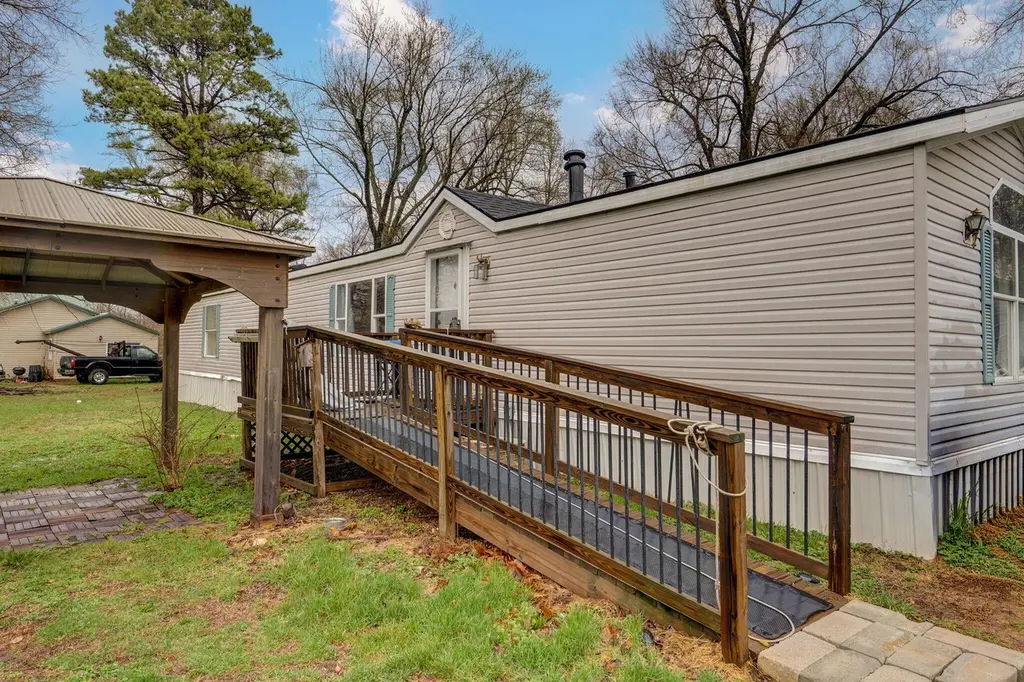
106 Missouri St · Urbana, MO
Flood risk 1/10 · Minimal
- FEMA flood zone
- X (unshaded)
- Chance of flooding over 30 yrs
- 0.0%
- Est. flood insurance / yr
- $507 – $1,088
Fire risk 4/10 · Minor
- Est. fire insurance / yr
- $1,054 – $1,958
Heat risk 4/10 · Minor
- Hot days now (above 106°F)
- 7 days/yr
- Hot days in 30 yrs
- 19 days/yr
Wind risk 2/10 · Minimal
- Chance of severe wind over 30 yrs
- 0.0%
Air-quality risk 2/10 · Minimal
- Unhealthy air days now
- 0 days/yr
- Unhealthy air days in 30 yrs
- 1 days/yr
Risk factors via First Street. Map © Google.
Why this score? — see what drove the B grade
The composite is a weighted blend of 9 inputs, each scored 0–100. Each bar is that input's sub-score; the figure is the points it added to the 100-point composite (weight × sub-score).
- Cash flow +26.8/30.0
- DSCR +9.2/10.0
- Appreciation +8.2/10.0
- ARV discount +7.5/15.0
- 1% rule +6.0/10.0
- Schools +5.4/10.0
- Livability +2.9/5.0
- Rent growth +2.5/5.0
- Condition / age +2.5/5.0
$92,500
🖨 Deal sheet (PDF) 📄 Offer letter ✓ Due diligence
Listing remarks MLS
Great mobile home close to Pomme de Terre Lake! Outside you'll find a 2-bay shop for your vehicle and/or boat, a covered gazebo, and a fenced in back yard. Windows and roof are in good condition and trailer has central heat and air!Seller is selling as-is. Trailer to be conveyed with MO Bill of Sale.
Key facts
- Covered gazebo
- 2-bay shop
- Central heat and air
Tags
Neighborhood map
What this means for you Summary
Snapshot
- This is a 2-bed/2.0-bath manufactured listed at $92k.
Deal economics
- At list price, monthly cash flow is $254 ($3k/yr) — positive.
- The deal already cash-flows at list — no discount required.
- Meets the 1% rule at list price ($1k rent vs $92k).
- Recommended offer: $84k (9.0% below list) — sets the bar for market timing.
- Cap rate 9.6% vs local median 4.0% in Urbana — top-decile yield for the area; either an underpriced asset or a hidden risk that comps aren't pricing in. Stress-test before assuming the spread holds.
Location & tenants
- Location reads 57/100 on livability (#629 in MO) — a working-class tenant base; expect higher turnover. Strengths: cost of living A+, housing A+; Watch: crime F, amenities F, commute F.
- Hickory County R-I (rural): math 65% / reading 66% proficiency, ranked #8 of 324 in MO (top 2%) — acceptable for families but not a draw, mixed tenant base, ~2y average lease.
- Zoned schools: Skyline Elem. (math 82% / reading 82%, grade A+, #4 of 1,115 statewide, top 0%, 306 students, 45% FRL); Skyline Middle (math 57% / reading 59%, grade B, #26 of 391 statewide, top 7%, 206 students, 40% FRL); Skyline High (math 64% / reading 74%, grade B, #10 of 521 statewide, top 2%, 215 students, 38% FRL) — zoned schools at 41% FRL track the district average.
- Market conditions: 36 active listings in the ZIP; 8 units permitted in Dallas County in 2024 (0 in 5+ unit buildings).
Forward outlook
- In year one you build about $7k of equity ($640 loan paydown + $6k appreciation (6.3% local appreciation)).
- Dallas County population projected at -26% by 2050 — secular population decline; favor cash flow + early exit over multi-decade hold.
- At projected returns (6.3% appreciation + 3.0% rent growth), your $26k cash investment doubles in ~3 years — after that, you're playing with house money.
- By year 6, paydown + projected appreciation supports a ~$36k cash-out refi (75% LTV) — recoverable capital for the next deal without selling this one.
Negotiation context
- It's been on market 101 days — a 9% lower offer ($84k) is reasonable based on typical stale-listing flexibility.
- 6 sale attempts since 6y ago with the ask held roughly flat each time — persistent listings suggest the price (not the market) is what's stuck; bring a comps-based counter.
Questions for the listing agent
- It's been on market 101 days. Have you received any prior offers? Is the seller open to a 9% concession, seller financing, or rate buy-down credit?
- Why hasn't it sold? Are there any deal-killer items the seller is aware of (foundation, flood, title, zoning, code violations)?
- Is there a deadline driving the sale (1031 exchange, divorce, estate, relocation)? That informs how much negotiation room exists.
- Schools are B-rated — typically a magnet for longer-tenancy family renters. What's the average tenant stay here, and is there a school-zone premium baked into asking?
- Crime grade is F in this area — have there been break-ins, vandalism, or insurance claims at this property in the last 3 years? What carrier currently insures it and at what premium?
- What's the average days-on-market for RENTAL listings here right now (not sales)? A rising rental-DOM trend means longer vacancies and softer asking-rent achievability than the comps imply.
- What's the recent tenant-quality profile in this submarket — average credit score on applications, eviction rate, late-payment / NSF rate, and stable-employment percentage? A property-management company in the area should have these aggregated.
- How much new for-sale + rental construction is in the pipeline within 1–3 miles? Heavy new supply typically softens prices + rents 12–24 months out; constrained supply supports both.
Investment metrics
- 1% rule
- 1.10% ✓
- Cap rate
- 9.59%
- Cash-on-cash
- 11.77%
- DSCR
- 1.52
- GRM
- 7.6
CMA / ARV
No comps found within radius.
Projected returns pro-forma
6.35% appreciation · 3.0% rent growth · sell at horizon
- IRR
- 25.8%
- Equity multiple
- 2.73×
- Total profit
- $44,774
- Equity at exit
- $60,200
- IRR
- 24.0%
- Equity multiple
- 5.57×
- Total profit
- $118,480
- Equity at exit
- $110,986
Cash invested: $25,900 (down + closing). Projections, not guarantees.
Landlord ↔ Tenant lean methodology
- Overall (STATE)
- 81 Strongly Landlord-Friendly
- State Missouri
- 81 Strongly Landlord-Friendly · R+10
- County
- — inherits STATE
- City
- — inherits STATE
ZIP-level market 65767
- Home prices YoY
- 2.5%
- Active inventory
- 36
- Price-to-rent
- 7.6×
Monthly cashflow live
- Estimated rent
- $1,016 medium interval (Pro) →
- Mortgage (P&I)
- −$485
- Tax from tax record
- −$25 /mo · $297/yr
- Insurance
- −$39
- HOA
- −$0
- Vacancy / Maint / Mgmt
- −$213
- Net cashflow
- $254
Break-even live
Sensitivity live
| Price | -10% $306 | -5% $280 | +0% $254 | +5% $228 | +10% $202 |
|---|---|---|---|---|---|
| Rent | -10% $174 | -5% $214 | +0% $254 | +5% $294 | +10% $334 |
| Rate | -1.0pp $301 | -0.5pp $278 | base $254 | +0.5pp $230 | +1.0pp $206 |
UW: 25.0% down · 7.5% · 30yr · 1.5% tax · 5.0% vac · 8.0% maint · 8.0% mgmt
Financing live
Cash to close
- Down payment
- $23,125
- Closing costs
- $2,775
- Reserves months
- —
- Total cash needed
- —
Loan-product check · same deal, 3 products live
Conventional
25% down · 7.5% · 30yr
- Down + closing
- —
- Monthly P&I
- —
- Monthly cashflow
- —
- DSCR
- —
- Eligible?
- —
Personal DTI + credit; lowest rate.
DSCR
20% down · 8.5% · 30yr
- Down + closing
- —
- Monthly P&I
- —
- Monthly cashflow
- —
- DSCR
- —
- Eligible?
- —
No personal income docs; deal must DSCR.
Hard money
10% down · 12.0% · 12mo
- Down + closing
- —
- Monthly P&I
- —
- Monthly cashflow
- —
- DSCR
- —
- Eligible?
- —
Short-term bridge; refi at stabilization.
Listing history 32 events
-
2026-06-21days on market $92,500 Active 101 DOM
-
2026-06-19days on market $92,500 Active 99 DOM
-
2026-06-18days on market $92,500 Active 98 DOM
-
2026-06-17days on market $92,500 Active 97 DOM
-
2026-06-16days on market $92,500 Active 96 DOM
-
2026-06-15days on market $92,500 Active 95 DOM
-
2026-06-14days on market $92,500 Active 93 DOM
-
2026-06-12days on market $92,500 Active 92 DOM
-
2026-06-09days on market $92,500 Active 89 DOM
-
2026-06-08days on market $92,500 Active 88 DOM
-
2026-06-07days on market $92,500 Active 87 DOM
-
2026-06-05days on market $92,500 Active 84 DOM
-
2026-06-03days on market $92,500 Active 83 DOM
-
2026-06-02days on market $92,500 Active 82 DOM
-
2026-06-01days on market $92,500 Active 81 DOM
-
2026-05-31days on market $92,500 Active 80 DOM
-
2026-05-30days on market $92,500 Active 79 DOM
-
2026-04-10price $92,500 302-char remark
Show marketing remark (302 chars)
Great mobile home close to Pomme de Terre Lake! Outside you'll find a 2-bay shop for your vehicle and/or boat, a covered gazebo, and a fenced in back yard. Windows and roof are in good condition and trailer has central heat and air!Seller is selling as-is. Trailer to be conveyed with MO Bill of Sale.
-
2026-03-12$94,900 Active 302-char remark
Show marketing remark (302 chars)
Great mobile home close to Pomme de Terre Lake! Outside you'll find a 2-bay shop for your vehicle and/or boat, a covered gazebo, and a fenced in back yard. Windows and roof are in good condition and trailer has central heat and air!Seller is selling as-is. Trailer to be conveyed with MO Bill of Sale.
-
2025-11-19price $87,000
-
2025-10-19$95,000 Active
-
2025-08-29soldstatus Closed
-
2025-08-21status Pending
-
2025-08-15status Active
-
2025-07-21status Pending
-
2025-07-11$87,000 Active
-
2021-07-22soldstatus
-
2021-07-20soldstatus
-
2021-02-27$46,000
-
2020-08-03soldstatus
-
2020-07-24soldstatus
-
2020-04-16$35,000
ⓘ Source: listings_history table (triggers on properties + properties_extension) + one-shot
backfill from property_details.listing_events for pre-trigger history.
Tax reassessment forecast MO · Resets to sale price
- Current annual tax
- $297 · $25/mo
- Projected year-2 tax
- $897 · $75/mo
- Expected delta
- +$600/yr (+$50/mo · 202.2%)
ⓘ Screening estimate from a state-policy table — verify with the county assessor before closing.
Climate risk First Street
- Flood 1/10 Low FEMA zone X (unshaded) · 0% chance over 30 yrs
- Wildfire 4/10 Moderate
- Heat 4/10 Moderate 7 d/yr ≥106°F today · 19 d/yr by 30 yrs out
- Wind 2/10 Low 0% chance of damaging wind over 30 yrs
- Air quality 2/10 Low 0 unhealthy d/yr today · 1 by 30 yrs out
Nearby sold comps map
Loading sold comps map…
Walkable amenities ~0.75 mi
Loading nearby amenities…
Taxation est. · year 1
- Rental income
- $12,188
- − Mortgage interest
- −$5,181
- − Property taxes
- −$297
- − Insurance
- −$462
- − Repairs & maintenance
- −$975
- − Management
- −$975
- − Depreciation
- −$2,691
- Taxable income
- $1,606
- Est. tax owed @ 24.0%
- −$386
- After-tax cash flow
- $2,663/yr
For passive investors: Depreciation is non-cash, so a rental often shows a tax loss while cash-flowing — sheltering income. Rental losses are passive: they offset passive income freely, and up to $25,000/yr can offset ordinary (W-2) income if you actively participate and your MAGI is under $100k (phasing out to $0 by $150k); unused losses carry forward. On sale, claimed depreciation is recaptured at up to 25%, and gains may owe capital-gains tax (a 1031 exchange can defer both). Figures are a year-1 estimate at your 24.0% rate — not tax advice; consult a CPA.
Schools (NCES district)
- District
- Hickory County R-I
- NCES district ID
- 2914320
- Math proficiency
- 65% ▼ -4.00%
- Reading proficiency
- 66% ▲ 1.00%
- Median HH income
- $33,125
- Composite
- 54.03/100
- National rank
- #1393
- State rank
- #8 of 324 in MO
Livability — Urbana
- Score
- 57/100
- State rank
- #629
- US rank
- #21576
Category grades
Schools grade is shown separately in the Schools card above.
Census & demographics
- Census place
- Urbana, MO
- Population (ZIP)
- 1,860
Population outlook (Dallas County) Hauer SSP2
- Today (2025)
- 15,419 people
- By 2030
- 14,668 · -4.9%
- By 2040
- 13,045 · -15.4%
- By 2050
- 11,341 · -26.4%
- By 2075
- 8,096 · -47.5%
- By 2100
- 5,656 · -63.3%
Race, ethnicity, and origin ACS 2023
- Neighborhood character
- Predominantly White (94%)
- Race & ethnicity
- White 94% Two or more races 5%
- Common ancestry
- Romanian 14% Iranian 9% Italian 1%
- Foreign-born
- 0%
Political lean MEDSL · Dallas
- 2024 margin
- Solid R (+64.6) · D 17.3% · R 81.8%
- 2008→2024 swing
- -35.4pp toward R · 2008: -29.1pp · 2024: -64.6pp
- All cycles
- 2024: R+64.6 2020: R+64.7 2016: R+62.1 2012: R+39.4 2008: R+29.1
Not yet ingested
- Civics
- —
Market trends
- HPI YoY
- ▲ 6.35%
- Current HPI
- 256.3794
- Rent YoY
- —
- Metro
- —
- State GDP YoY
- ▲ 1.84%
- F500 in state
- 20
Industry mix (Fortune 500 HQ in MO)
| Industry | F500 HQs | Revenue |
|---|---|---|
| Healthcare | 1 | $163B |
|
||
| Insurance | 1 | $21B |
|
||
| Industrial Technology | 1 | $17B |
|
||
| Retail | 1 | $16B |
|
||
| Industrial Distribution | 1 | $10B |
|
||
| Utilities | 1 | $9B |
|
||
Price history
+164.3% since first listed15 events — show timeline
- 2026-04-10 Price Changed $92,500 SOMO
- 2026-03-12 Listed $94,900 SOMO
- 2025-11-19 Price Changed $87,000 SOMO
- 2025-10-19 Listed $95,000 SOMO
- 2025-08-29 Sold (MLS) — SOMO
- 2025-08-21 Pending — SOMO
- 2025-08-15 Relisted — SOMO
- 2025-07-21 Pending — SOMO
- 2025-07-11 Listed $87,000 SOMO
- 2021-07-22 Sold (Public Records) — Public Records
- 2021-07-20 Sold (MLS) — SOMO
- 2021-02-27 Listed $46,000 SOMO
- 2020-08-03 Sold (MLS) — SOMO
- 2020-07-24 Sold (Public Records) — Public Records
- 2020-04-16 Listed $35,000 SOMO
Property tax history
+3.1%/yrLatest (2025): $297 · +1.7% YoY. Source: county tax records.
Cash-flow waterfall
monthlySold comps — $/sqft
last 12 mo · ≤1 miLoading sold comps…