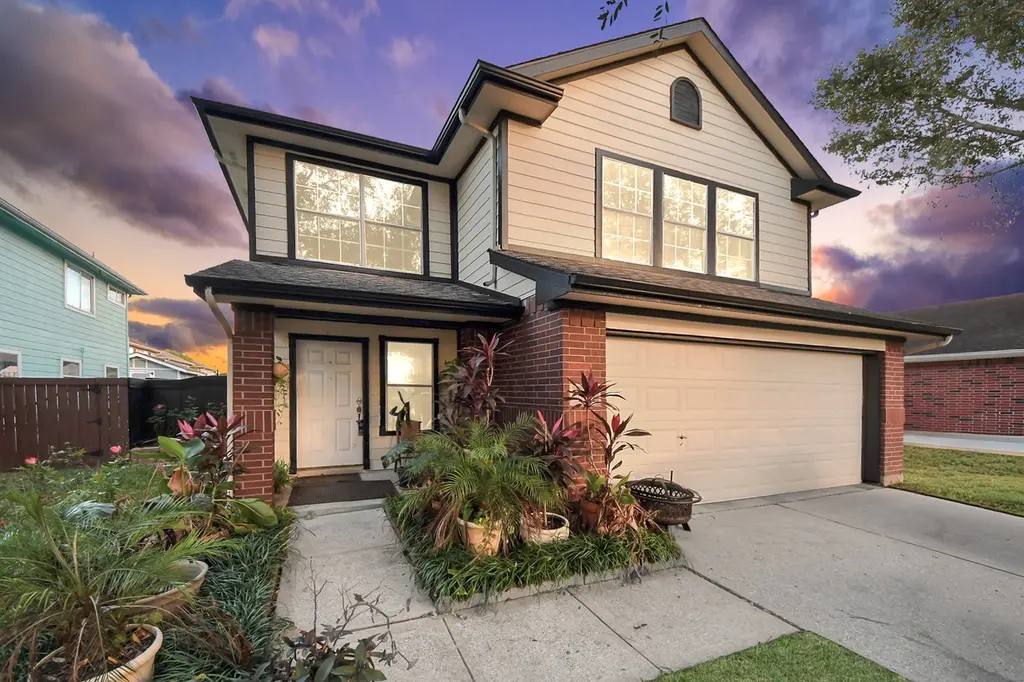
13019 Lindenloch Ln · Houston, TX
Flood risk 3/10 · Minor
- FEMA flood zone
- X (unshaded)
- Chance of flooding over 30 yrs
- 0.2%
- Est. flood insurance / yr
- $507 – $1,088
Fire risk 1/10 · Minimal
- Est. fire insurance / yr
- $1,222 – $2,270
Heat risk 9/10 · Severe
- Hot days now (above 110°F)
- 7 days/yr
- Hot days in 30 yrs
- 23 days/yr
Wind risk 9/10 · Severe
- Chance of severe wind over 30 yrs
- 99.0%
Air-quality risk 3/10 · Minor
- Unhealthy air days now
- 2 days/yr
- Unhealthy air days in 30 yrs
- 3 days/yr
Risk factors via First Street. Map © Google.
Why this score? — see what drove the C+ grade
The composite is a weighted blend of 9 inputs, each scored 0–100. Each bar is that input's sub-score; the figure is the points it added to the 100-point composite (weight × sub-score).
- Cash flow +27.2/30.0
- DSCR +9.4/10.0
- 1% rule +8.1/10.0
- Appreciation +4.4/10.0
- Livability +3.7/5.0
- Rent growth +2.9/5.0
- Schools +2.7/10.0
- Condition / age +2.5/5.0
- ARV discount +0.0/15.0
$312,660
🖨 Deal sheet 📄 Offer letter ✓ Due diligence
Listing remarks MLS
Stop renting and start owning —4 beds, 2.5 baths, move-in ready.- The interior features fresh, neutral paint and no carpet throughout, with beautiful wood-inspired flooring in the living areas and stylish tile in the kitchen and dining zones. The heart of the home is the open-concept kitchen and breakfast area, showcasing natural wood cabinetry, stainless steel appliances, and a charming arched opening that overlooks the dining space. The spacious, fully fenced backyard includes a large, well-maintained storage shed — perfect for a workshop or extra storage. Solar panels already installed keep your energy costs low from day one, and the location puts you minutes from the Texas Medical Center and major highways. Buyer to verify all information, including room dimensions, schools, taxes, HOA details and restrictions.
Key facts
- Open-concept kitchen
- 5,052 sq ft lot
- 2 garage spots
Tags
Neighborhood map
What this means for you Summary
Snapshot
- This is a 3-bed/2.5-bath single-family listed at $313k.
Deal economics
- At list price, monthly cash flow is $891 ($11k/yr) — positive.
- The deal already cash-flows at list — no discount required.
- Meets the 1% rule at list price ($4k rent vs $313k).
- Recommended offer: $294k (6.0% below list) — sets the bar for market timing.
- Cap rate 9.7% vs local median 3.2% in Houston — top-decile yield for the area; either an underpriced asset or a hidden risk that comps aren't pricing in. Stress-test before assuming the spread holds.
Location & tenants
- Location reads 74/100 on livability (#184 in TX, #4,771 nationally) — a middle-class / working-renter tenant base. Strengths: amenities A+, cost of living A+, housing A+; Watch: schools D, crime F.
- Houston ISD (urban): math 27% / reading 35% proficiency, ranked #593 of 826 in TX (top 72%) — families likely to look elsewhere, expect single-tenant / working-renter base with shorter leases; 71% free/reduced lunch — lower-income household profile, screen leases tightly.
- Market conditions: Rents rising (+1.5%/yr); 37 active listings in the ZIP; 7 comparable units currently listed for rent nearby; rentals at typical pace (median 22d on market — plan ~3-4 weeks tenant-placement turnaround); 43% of comp listings sitting > 30 days — soft ceiling on asking rent; 29,883 units permitted in Harris County in 2024 (8,621 in 5+ unit buildings).
- At $4,084/mo this rent would consume 72% of the median local household income ($68k/yr) (locally 519% of renters already pay >50% of income on rent) — very limited rent-growth headroom before tenants either downsize or default.
Forward outlook
- Local home prices are declining (-1.2%/yr); year-one equity from $2k of loan paydown is wiped out by about $4k of value loss. Plan a longer hold.
- Harris County population projected at +47% by 2050 — long-run rental-demand tailwind backs the buy-and-hold thesis.
- At projected returns (-1.2% appreciation + 1.5% rent growth), your $88k cash investment doubles in ~8 years — after that, you're playing with house money.
Negotiation context
- It's been on market 65 days — a 6% lower offer ($294k) is reasonable based on typical stale-listing flexibility.
- 2 sale attempts with the ask held roughly flat each time — persistent listings suggest the price (not the market) is what's stuck; bring a comps-based counter.
Risks & watch-outs
- Climate carrying-cost: severe wind risk, 99% chance of damaging wind over 30y; extreme-heat days projected 7→23/yr by 2055 (HVAC capex compounding) — expect insurance premiums to compound above CPI over the hold.
Questions for the listing agent
- It's been on market 65 days. Have you received any prior offers? Is the seller open to a 6% concession, seller financing, or rate buy-down credit?
- Why hasn't it sold? Are there any deal-killer items the seller is aware of (foundation, flood, title, zoning, code violations)?
- Is there a deadline driving the sale (1031 exchange, divorce, estate, relocation)? That informs how much negotiation room exists.
- Schools are D-rated, which usually means shorter tenancies and higher turnover. Who's the typical renter profile here, and what's been the actual vacancy rate?
- Crime grade is F in this area — have there been break-ins, vandalism, or insurance claims at this property in the last 3 years? What carrier currently insures it and at what premium?
- What's the average days-on-market for RENTAL listings here right now (not sales)? A rising rental-DOM trend means longer vacancies and softer asking-rent achievability than the comps imply.
- What's the recent tenant-quality profile in this submarket — average credit score on applications, eviction rate, late-payment / NSF rate, and stable-employment percentage? A property-management company in the area should have these aggregated.
- How much new for-sale + rental construction is in the pipeline within 1–3 miles? Heavy new supply typically softens prices + rents 12–24 months out; constrained supply supports both.
Investment metrics
- 1% rule
- 1.31% ✓
- Cap rate
- 9.71%
- Cash-on-cash
- 12.22%
- DSCR
- 1.54
- GRM
- 6.4
CMA / ARV
- ARV (median comp)
- $265,898
- List price
- $312,660
- Delta
- 17.59%
- Verdict
- OVERPRICED
- Comps
- 20 within 1.0 mi
Show comp detail 12 sales within ~0.75 mi
| Address | Dist | Beds/Ba | Sqft | Sold | Price | $/sf | Match |
|---|---|---|---|---|---|---|---|
| 6027 Nodaway Creek Ct | 0.32mi | 3/2.5 | 2,136 (-4%) | 0mo | $315,000 | $147 | 79 |
| 5819 Tidewater Dr | 0.29mi | 3/2.5 | 2,260 (+2%) | 9mo | $261,000 | $115 | 76 |
| 6014 Pinacle Pt | 0.26mi | 3/2.5 | 2,044 (-8%) | 2mo | $264,900 | $130 | 73 |
| 5906 Nodaway Creek Ct | 0.38mi | 3/2.5 | 2,169 (-2%) | 12mo | $309,000 | $142 | 69 |
| 12842 Colony Heath Ln | 0.21mi | 4/2.5 (+1) | 2,360 (+6%) | 12mo | $333,000 | $141 | 65 |
| 13102 Lindenloch Ln | 0.04mi | 4/2.5 (+1) | 2,043 (-8%) | 18mo | $295,584 | $145 | 65 |
| 6031 Valley Cove Ln | 0.26mi | 4/2.5 (+1) | 2,360 (+6%) | 19mo | $289,500 | $123 | 57 |
| 6502 River Bluff Dr | 0.49mi | 4/2.0 (+1) | 2,044 (-8%) | 2mo | $289,500 | $142 | 56 |
| 13522 Titus Pt | 0.45mi | 3/2.0 | 2,002 (-10%) | 8mo | $299,786 | $150 | 54 |
| 6527 River Bluff Dr | 0.57mi | 4/2.5 (+1) | 2,368 (+7%) | 12mo | $295,000 | $125 | 48 |
| 5726 Coastal Way | 0.37mi | 4/2.5 (+1) | 1,910 (-14%) | 11mo | $285,000 | $149 | 46 |
| 5743 Coastal Way | 0.34mi | 3/2.5 | 1,910 (-14%) | 23mo | $230,000 | $120 | 42 |
Match score weights: distance 35% · size 25% · config 20% · recency 20%. Top-matched comps best support the ARV.
Projected returns pro-forma
-1.21% appreciation · 1.54% rent growth · sell at horizon
- IRR
- 6.4%
- Equity multiple
- 1.28×
- Total profit
- $24,457
- Equity at exit
- $72,259
- IRR
- 11.8%
- Equity multiple
- 2.07×
- Total profit
- $93,896
- Equity at exit
- $73,173
Cash invested: $87,545 (down + closing). Projections, not guarantees.
Landlord ↔ Tenant lean methodology
- Overall (STATE)
- 87 Strongly Landlord-Friendly
- State Texas
- 87 Strongly Landlord-Friendly · R+5
- County
- — inherits STATE
- City
- — inherits STATE
ZIP-level market 77085
- Home prices YoY
- -0.5%
- Rents YoY
- 1.5%
- Active inventory
- 37
- Price-to-rent
- 6.4×
Monthly cashflow live
- Estimated rent
- $4,084 medium interval (Pro) →
- Mortgage (P&I)
- −$1,640
- Tax from tax record
- −$565 /mo · $6,780/yr
- Insurance
- −$130
- HOA
- −$0
- Vacancy / Maint / Mgmt
- −$858
- Net cashflow
- $891
Break-even live
UW: 25.0% down · 7.5% · 30yr · 1.5% tax · 5.0% vac · 8.0% maint · 8.0% mgmt
Financing live
Cash to close
- Down payment
- $78,165
- Closing costs
- $9,380
- Reserves months
- —
- Total cash needed
- —
Loan-product check · same deal, 3 products live
Conventional
25% down · 7.5% · 30yr
- Down + closing
- —
- Monthly P&I
- —
- Monthly cashflow
- —
- DSCR
- —
- Eligible?
- —
Personal DTI + credit; lowest rate.
DSCR
20% down · 8.5% · 30yr
- Down + closing
- —
- Monthly P&I
- —
- Monthly cashflow
- —
- DSCR
- —
- Eligible?
- —
No personal income docs; deal must DSCR.
Hard money
10% down · 12.0% · 12mo
- Down + closing
- —
- Monthly P&I
- —
- Monthly cashflow
- —
- DSCR
- —
- Eligible?
- —
Short-term bridge; refi at stabilization.
Rent comps 7 comps
| Address | Beds | Baths | Sqft | Rent | $/sqft | DOM | Units | Dist |
|---|---|---|---|---|---|---|---|---|
| 5751 Firenza Dr Houston, TX | 4.0 | 3.0 | 1777 | $5,750 | $3.24 | 1d | 1 | 0.97mi |
| 5815 Farwell Dr Houston, TX | 4.0 | 2.0 | 2418 | $2,200 | $0.91 | 43d | 1 | 0.99mi |
| 5615 Cerritos Dr Unit 1514815P Houston, TX | 4.0 | 2.0 | 1883 | $7,300 | $3.88 | 43d | 1 | 1.36mi |
| 12115 Hillcroft Ave Houston, TX | 3.0 | 2.0 | 1837 | $1,961 | $1.07 | 43d | 1 | 1.37mi |
| 5631 Cerritos Dr Unit 1514826P Houston, TX | 4.0 | 3.0 | 1883 | $11,906 | $6.32 | 21d | 1 | 1.37mi |
| 13939 Hillcroft Ave Unit 13972 Houston, TX | 3.0 | 2.0 | 1404 | $2,164 | $1.54 | 20d | 1 | 1.42mi |
| 13939 Hillcroft Ave Houston, TX | 1.0–3.0 | 1.0–2.0 | 985 | $2,254 | $2.29 | 3d | 22 | 1.42mi |
Listing history 14 events
-
2026-06-18days on market $312,660 Active 65 DOM
-
2026-06-17days on market $312,660 Active 64 DOM
-
2026-06-16days on market $312,660 Active 63 DOM
-
2026-06-15days on market $312,660 Active 62 DOM
-
2026-06-13days on market $312,660 Active 60 DOM
-
2026-06-10days on market $312,660 Active 56 DOM
-
2026-06-08days on market $312,660 Active 55 DOM
-
2026-06-07days on market $312,660 Active 54 DOM
-
2026-06-04days on market $312,660 Active 51 DOM
-
2026-06-01days on market $312,660 Active 48 DOM
-
2026-05-31days on market $312,660 Active 47 DOM
-
2026-04-14$312,660 Active 840-char remark
Show marketing remark (840 chars)
Stop renting and start owning —4 beds, 2.5 baths, move-in ready.- The interior features fresh, neutral paint and no carpet throughout, with beautiful wood-inspired flooring in the living areas and stylish tile in the kitchen and dining zones. The heart of the home is the open-concept kitchen and breakfast area, showcasing natural wood cabinetry, stainless steel appliances, and a charming arched opening that overlooks the dining space. The spacious, fully fenced backyard includes a large, well-maintained storage shed — perfect for a workshop or extra storage. Solar panels already installed keep your energy costs low from day one, and the location puts you minutes from the Texas Medical Center and major highways. Buyer to verify all information, including room dimensions, schools, taxes, HOA details and restrictions.
-
2026-04-07historical
-
2026-01-23$312,660 Active
ⓘ Source: listings_history table (triggers on properties + properties_extension) + one-shot
backfill from property_details.listing_events for pre-trigger history.
Tax reassessment forecast TX · Resets to sale price
- Current annual tax
- $6,780 · $565/mo
- Projected year-2 tax
- $6,780 · $565/mo
- Expected delta
- $0/yr ($0/mo · 0.0%)
ⓘ Screening estimate from a state-policy table — verify with the county assessor before closing.
Climate risk First Street
- Flood 3/10 Moderate FEMA zone X (unshaded) · 20% chance over 30 yrs
- Wildfire 1/10 Low
- Heat 9/10 Extreme 7 d/yr ≥110°F today · 23 d/yr by 30 yrs out
- Wind 9/10 Extreme 99% chance of damaging wind over 30 yrs
- Air quality 3/10 Moderate 2 unhealthy d/yr today · 3 by 30 yrs out
Nearby sold comps map
Loading sold comps map…
Walkable amenities ~0.75 mi
Loading nearby amenities…
Taxation est. · year 1
- Rental income
- $49,005
- − Mortgage interest
- −$17,514
- − Property taxes
- −$6,780
- − Insurance
- −$1,563
- − Repairs & maintenance
- −$3,920
- − Management
- −$3,920
- − Depreciation
- −$9,096
- Taxable income
- $6,211
- Est. tax owed @ 24.0%
- −$1,491
- After-tax cash flow
- $9,204/yr
For passive investors: Depreciation is non-cash, so a rental often shows a tax loss while cash-flowing — sheltering income. Rental losses are passive: they offset passive income freely, and up to $25,000/yr can offset ordinary (W-2) income if you actively participate and your MAGI is under $100k (phasing out to $0 by $150k); unused losses carry forward. On sale, claimed depreciation is recaptured at up to 25%, and gains may owe capital-gains tax (a 1031 exchange can defer both). Figures are a year-1 estimate at your 24.0% rate — not tax advice; consult a CPA.
Schools (NCES district)
- District
- Houston ISD
- NCES district ID
- 4823640
- Math proficiency
- 27% ▼ -18.00%
- Reading proficiency
- 35% ▼ -6.00%
- Median HH income
- $46,054
- Composite
- 26.63/100
- National rank
- #7173
- State rank
- #593 of 826 in TX
Livability — Houston
- Score
- 74/100
- State rank
- #184
- US rank
- #4771
Category grades
Schools grade is shown separately in the Schools card above.
Census & demographics
- Census place
- Houston, TX
- County
- Harris County · 4,702,590 people
- City population
- 3,226,434
- Metro
- Houston-The Woodlands-Sugar Land, TX
- Population (ZIP)
- 16,513
- Household income
- $68,470
- Rent vs Own
- Severe rent burden
- 519.0
Population outlook (Harris County) Hauer SSP2
- Today (2025)
- 5,571,493 people
- By 2030
- 6,089,821 · +9.3%
- By 2040
- 7,142,806 · +28.2%
- By 2050
- 8,185,864 · +46.9%
- By 2075
- 10,574,329 · +89.8%
- By 2100
- 12,109,958 · +117.4%
Race, ethnicity, and origin ACS 2023
- Neighborhood character
- Majority Hispanic (64%)
- Race & ethnicity
- Hispanic / Latino 64% Black 28% Two or more races 19% Native American 6% White 5% Asian 2%
- Hispanic origin (detail)
- Mexican 41%
- Common ancestry
- Italian 1%
- Foreign-born
- 32% · Canada, Vietnam, Dominican Republic
- Languages at home
- 38% English-only · Spanish 57% Other Indo-European 1% Vietnamese 1%
Political lean MEDSL · Harris
- 2024 margin
- Lean D (+5.5) · D 52.0% · R 46.4% · Other 1.6%
- 2008→2024 swing
- +3.9pp toward D · 2008: 1.6pp · 2024: 5.5pp
- All cycles
- 2024: D+5.5 2020: D+13.3 2016: D+12.4 2012: D+0.1 2008: D+1.6
Not yet ingested
- Civics
- —
Market trends
- HPI YoY
- ▼ -1.21%
- Current HPI
- 254.3084
- Rent YoY
- ▲ 1.54%
- Metro
- Houston-The Woodlands-Sugar Land, TX
- State GDP YoY
- ▲ 3.95%
- F500 in state
- 110
Industry mix (Fortune 500 HQ in TX)
| Industry | F500 HQs | Revenue |
|---|---|---|
| Energy | 16 | $1,198B |
|
||
| Technology | 5 | $198B |
|
||
| Engineering / Construction | 4 | $72B |
|
||
| Energy Services | 3 | $60B |
|
||
| Utilities | 3 | $41B |
|
||
| Healthcare | 2 | $330B |
|
||
Price history
+0.0% since first listed3 events — show timeline
- 2026-04-14 Listed $312,660 HARMLS
- 2026-04-07 Listing Removed — HARMLS
- 2026-01-23 Listed $312,660 HARMLS
Property tax history
+9.1%/yrLatest (2025): $6,780 · +4.8% YoY. Source: county tax records.
Cash-flow waterfall
monthlySold comps — $/sqft
last 12 mo · ≤1 miLoading sold comps…