135 Chandler Blvd · Macomb, IL
Flood risk 1/10 · Minimal
- FEMA flood zone
- —
- Chance of flooding over 30 yrs
- 0.0%
- Est. flood insurance / yr
- —
Fire risk 1/10 · Minimal
- Est. fire insurance / yr
- $804 – $1,492
Heat risk 3/10 · Minor
- Hot days now (above 107°F)
- 7 days/yr
- Hot days in 30 yrs
- 17 days/yr
Wind risk 2/10 · Minimal
- Chance of severe wind over 30 yrs
- —
Air-quality risk 2/10 · Minimal
- Unhealthy air days now
- 1 days/yr
- Unhealthy air days in 30 yrs
- 1 days/yr
Risk factors via First Street. Map © Google.
Why this score? — see what drove the D grade
The composite is a weighted blend of 9 inputs, each scored 0–100. Each bar is that input's sub-score; the figure is the points it added to the 100-point composite (weight × sub-score).
- Cash flow +14.5/30.0
- ARV discount +7.5/15.0
- 1% rule +4.4/10.0
- DSCR +4.4/10.0
- Livability +3.5/5.0
- Rent growth +2.5/5.0
- Condition / age +2.5/5.0
- Schools +1.8/10.0
- Appreciation +0.0/10.0
$79,000
🖨 Deal sheet 📄 Offer letter ✓ Due diligence
Listing remarks MLS
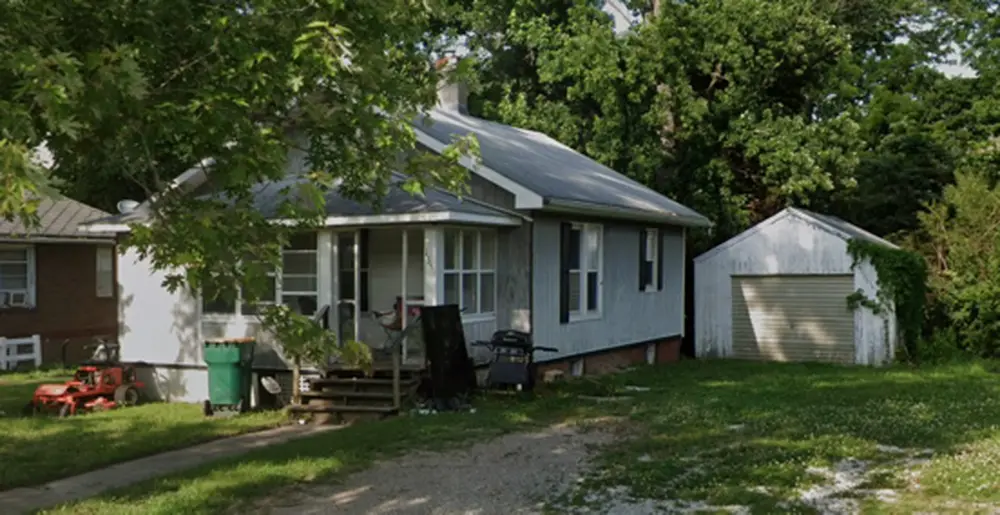
This 2-bedroom, 1-bath bungalow offers loads of potential for the right buyer. With approximately 800 square feet of living space, it features an enclosed front porch, a deck off the back, and a detached garage for extra storage or parking. Inside, you’ll find a cozy layout ready for your personal touch and vision. Conveniently located within walking distance to the local university, this home presents an excellent opportunity for an investor, student housing, or anyone looking to bring new life to a classic home.
Key facts
- Single family home
- Large lot
- Built 1930
Tags
Neighborhood map
What this means for you Summary
Snapshot
- This is a 2-bed/1.0-bath single-family listed at $79k.
Deal economics
- At list price, monthly cash flow is $17 ($208/yr) — positive.
- The deal already cash-flows at list — no discount required.
- To meet the 1% rule (rent ≥ 1% of price), the offer needs to be $75k (5.6% below list).
- Recommended offer: $75k (5.6% below list) — sets the bar for 1% rule.
Location & tenants
- Location reads 70/100 on livability (#379 in IL) — a middle-class / working-renter tenant base. Strengths: cost of living A+, health & safety A+, housing B; Watch: schools D, crime D, amenities D.
- Macomb CUSD 185 (town): math 19% / reading 26% proficiency, ranked #410 of 620 in IL (top 66%) — low school quality limits family demand, transient renter base, plan for 1-2y turnover.
- Market conditions: 135 active listings in the ZIP; 4 comparable units currently listed for rent nearby; rentals lingering (median 44d on market — plan ~5-8 weeks vacancy on turnover, expect pricing pressure); 100% of comp listings sitting > 30 days — soft ceiling on asking rent.
Forward outlook
- Local home prices are declining (-3.0%/yr); year-one equity from $546 of loan paydown is wiped out by about $2k of value loss. Plan a longer hold.
Negotiation context
- It's been on market 15 days — a 2% lower offer ($78k) is reasonable based on typical stale-listing flexibility.
- 4 sale attempts since 4y ago with the ask held roughly flat each time — persistent listings suggest the price (not the market) is what's stuck; bring a comps-based counter.
- Current owner paid $16k; list at $79k implies a 394% gain — meaningful room to come down on a strong offer.
Risks & watch-outs
- Watch-outs: built in 1930 — expect roof / HVAC / electrical / plumbing capex.
Questions for the listing agent
- Built in 1930 — when were the roof, HVAC, electrical panel, plumbing, and water heater last replaced?
- Is there a deadline driving the sale (1031 exchange, divorce, estate, relocation)? That informs how much negotiation room exists.
- Schools are D-rated, which usually means shorter tenancies and higher turnover. Who's the typical renter profile here, and what's been the actual vacancy rate?
- Crime grade is D in this area — have there been break-ins, vandalism, or insurance claims at this property in the last 3 years? What carrier currently insures it and at what premium?
- The area grade is low — what's the realistic commute time and amenity access for the typical tenant pool here? Any planned neighborhood developments (good or bad) we should know about?
- What's the average days-on-market for RENTAL listings here right now (not sales)? A rising rental-DOM trend means longer vacancies and softer asking-rent achievability than the comps imply.
- What's the recent tenant-quality profile in this submarket — average credit score on applications, eviction rate, late-payment / NSF rate, and stable-employment percentage? A property-management company in the area should have these aggregated.
- How much new for-sale + rental construction is in the pipeline within 1–3 miles? Heavy new supply typically softens prices + rents 12–24 months out; constrained supply supports both.
Investment metrics
- 1% rule
- 0.94% ✗
- Cap rate
- 6.56%
- Cash-on-cash
- 0.94%
- DSCR
- 1.04
- GRM
- 8.8
CMA / ARV
- ARV (on-the-fly)
- $43,576
- Comps found
- 10
Show comp detail 10 sales within ~0.75 mi
| Address | Dist | Beds/Ba | Sqft | Sold | Price | $/sf | Match |
|---|---|---|---|---|---|---|---|
| 135 Chandler Blvd | 0.00mi | 2/1.0 | 838 (0%) | 4mo | $16,000 | $19 | 97 |
| 716 N Albert St | 0.09mi | 3/1.0 (+1) | 864 (+3%) | 4mo | $37,000 | $43 | 82 |
| 437 W Pierce St | 0.21mi | 2/1.0 | 748 (-11%) | 13mo | $20,000 | $27 | 62 |
| 410 W Pierce St | 0.16mi | 2/1.0 | 720 (-14%) | 10mo | $69,000 | $96 | 61 |
| 520 W Jefferson St | 0.74mi | 2/1.0 | 839 (+0%) | 12mo | $50,000 | $60 | 55 |
| 515 E Pierce St | 0.54mi | 2/1.0 | 728 (-13%) | 1mo | $37,500 | $52 | 52 |
| 633 N Madison St | 0.50mi | 2/1.0 | 768 (-8%) | 15mo | $22,000 | $29 | 50 |
| 826 N Charles St | 0.19mi | 2/1.0 | 720 (-14%) | 24mo | $30,000 | $42 | 48 |
| 313 N Edwards St | 0.68mi | 1/1.0 (-1) | 882 (+5%) | 10mo | $52,000 | $59 | 46 |
| 525 W Washington St | 0.70mi | 2/1.0 | 786 (-6%) | 14mo | $59,000 | $75 | 45 |
Match score weights: distance 35% · size 25% · config 20% · recency 20%. Top-matched comps best support the ARV.
Projected returns pro-forma
-3.0% appreciation · 3.0% rent growth · sell at horizon
- IRR
- -14.8%
- Equity multiple
- 0.47×
- Total profit
- $-11,673
- Equity at exit
- $11,779
- IRR
- -6.0%
- Equity multiple
- 0.61×
- Total profit
- $-8,635
- Equity at exit
- $6,830
Cash invested: $22,120 (down + closing). Projections, not guarantees.
Landlord ↔ Tenant lean methodology
- Overall (STATE)
- 43 Moderately Tenant-Leaning
- State Illinois
- 43 Moderately Tenant-Leaning · D+7
- County
- — inherits STATE
- City
- — inherits STATE
ZIP-level market 61455
- Home prices YoY
- -33.3%
- Active inventory
- 135
- Price-to-rent
- 8.8×
Monthly cashflow live
- Estimated rent
- $746 medium interval (Pro) →
- Mortgage (P&I)
- −$414
- Tax from tax record
- −$125 /mo · $1,498/yr
- Insurance
- −$33
- HOA
- −$0
- Vacancy / Maint / Mgmt
- −$157
- Net cashflow
- $17
Break-even live
UW: 25.0% down · 7.5% · 30yr · 1.5% tax · 5.0% vac · 8.0% maint · 8.0% mgmt
Financing live
Cash to close
- Down payment
- $19,750
- Closing costs
- $2,370
- Reserves months
- —
- Total cash needed
- —
Loan-product check · same deal, 3 products live
Conventional
25% down · 7.5% · 30yr
- Down + closing
- —
- Monthly P&I
- —
- Monthly cashflow
- —
- DSCR
- —
- Eligible?
- —
Personal DTI + credit; lowest rate.
DSCR
20% down · 8.5% · 30yr
- Down + closing
- —
- Monthly P&I
- —
- Monthly cashflow
- —
- DSCR
- —
- Eligible?
- —
No personal income docs; deal must DSCR.
Hard money
10% down · 12.0% · 12mo
- Down + closing
- —
- Monthly P&I
- —
- Monthly cashflow
- —
- DSCR
- —
- Eligible?
- —
Short-term bridge; refi at stabilization.
Rent comps 4 comps
| Address | Beds | Baths | Sqft | Rent | $/sqft | DOM | Units | Dist |
|---|---|---|---|---|---|---|---|---|
| 902 N Charles St Macomb, IL | 2.0 | 1.5 | 840 | $695 | $0.83 | 43d | 1 | 0.21mi |
| 303 S Dudley St Macomb, IL | 1.0 | 1.0 | 625 | $575 | $0.92 | 43d | 1 | 0.85mi |
| 218 Charleston Blvd Unit 5 Macomb, IL | 1.0 | 1.0 | 535 | $610 | $1.14 | 43d | 1 | 1.03mi |
| 217 Charleston Blvd Unit 1 Macomb, IL | 1.0 | 1.0 | 535 | $610 | $1.14 | 43d | 1 | 1.03mi |
Listing history 11 events
-
2026-06-19days on market $79,000 Active 15 DOM
-
2026-06-18days on market $79,000 Active 14 DOM
-
2026-06-17days on market $79,000 Active 13 DOM
-
2026-06-16days on market $79,000 Active 12 DOM
-
2026-06-15days on market $79,000 Active 11 DOM
-
2026-06-14days on market $79,000 Active 9 DOM
-
2026-06-12days on market $79,000 Active 8 DOM
-
2026-06-09days on market $79,000 Active 5 DOM
-
2026-06-08days on market $79,000 Active 4 DOM
-
2026-06-07remarks 695-char remark
-
2026-06-07$79,000 Active 3 DOM
ⓘ Source: listings_history table (triggers on properties + properties_extension) + one-shot
backfill from property_details.listing_events for pre-trigger history.
Tax reassessment forecast IL · Partial reset (capped growth)
- Current annual tax
- $1,498 · $125/mo
- Projected year-2 tax
- $1,646 · $137/mo
- Expected delta
- +$148/yr (+$12/mo · 9.8%)
ⓘ Screening estimate from a state-policy table — verify with the county assessor before closing.
Climate risk First Street
- Flood 1/10 Low 0% chance over 30 yrs
- Wildfire 1/10 Low
- Heat 3/10 Moderate 7 d/yr ≥107°F today · 17 d/yr by 30 yrs out
- Wind 2/10 Low
- Air quality 2/10 Low 1 unhealthy d/yr today · 1 by 30 yrs out
Nearby sold comps map
Loading sold comps map…
Walkable amenities ~0.75 mi
Loading nearby amenities…
Taxation est. · year 1
- Rental income
- $8,952
- − Mortgage interest
- −$4,425
- − Property taxes
- −$1,498
- − Insurance
- −$395
- − Repairs & maintenance
- −$716
- − Management
- −$716
- − Depreciation
- −$2,298
- Taxable loss
- −$1,097
- Est. tax savings @ 24.0%
- +$263
- After-tax cash flow
- $471/yr
For passive investors: Depreciation is non-cash, so a rental often shows a tax loss while cash-flowing — sheltering income. Rental losses are passive: they offset passive income freely, and up to $25,000/yr can offset ordinary (W-2) income if you actively participate and your MAGI is under $100k (phasing out to $0 by $150k); unused losses carry forward. On sale, claimed depreciation is recaptured at up to 25%, and gains may owe capital-gains tax (a 1031 exchange can defer both). Figures are a year-1 estimate at your 24.0% rate — not tax advice; consult a CPA.
Schools (NCES district)
- District
- Macomb CUSD 185
- NCES district ID
- 1723920
- Math proficiency
- 19% ▼ -7.00%
- Reading proficiency
- 26% ▼ -8.00%
- Median HH income
- $34,162
- Composite
- 18.45/100
- National rank
- #8927
- State rank
- #410 of 620 in IL
Livability — Macomb
- Score
- 70/100
- State rank
- #379
- US rank
- #7918
Category grades
Schools grade is shown separately in the Schools card above.
Census & demographics
- Census place
- Macomb, IL
- County
- McDonough County · 17,317 people
- City population
- 17,317
- Metro
- Macomb, IL
- Population (ZIP)
- 17,317
- Household income
- $48,679
- Rent vs Own
- Severe rent burden
- 1062.0
Population outlook (McDonough County) Hauer SSP2
- Today (2025)
- 33,242 people
- By 2030
- 33,318 · +0.2%
- By 2040
- 33,520 · +0.8%
- By 2050
- 33,630 · +1.2%
- By 2075
- 33,657 · +1.2%
- By 2100
- 33,127 · -0.3%
Race, ethnicity, and origin ACS 2023
- Neighborhood character
- Predominantly White (81%)
- Race & ethnicity
- White 81% Black 9% Two or more races 5% Hispanic / Latino 5% Asian 3%
- Common ancestry
- Romanian 3% Italian 3% Iranian 2%
- Foreign-born
- 4% · Canada, South Korea, China
- Languages at home
- 94% English-only · Spanish 2% Other Indo-European 1% Russian/Polish/Slavic 1%
Political lean MEDSL · McDonough
- 2024 margin
- R (+18.9) · D 39.7% · R 58.5% · Other 1.8%
- 2008→2024 swing
- -24.4pp toward R · 2008: 5.6pp · 2024: -18.9pp
- All cycles
- 2024: R+18.9 2020: R+16.6 2016: R+11.7 2012: R+1.5 2008: D+5.6
Not yet ingested
- Civics
- —
Market trends
- HPI YoY
- ▼ -70.20%
- Current HPI
- 140.4351
- Rent YoY
- —
- Metro
- Macomb, IL
- State GDP YoY
- ▲ 1.59%
- F500 in state
- 60
Industry mix (Fortune 500 HQ in IL)
| Industry | F500 HQs | Revenue |
|---|---|---|
| Insurance | 4 | $201B |
|
||
| Consumer Goods | 4 | $87B |
|
||
| Industrial Machinery | 3 | $64B |
|
||
| Healthcare | 2 | $55B |
|
||
| Retail / Pharmacy | 1 | $148B |
|
||
| Agriculture / Food | 1 | $86B |
|
||
Price history
+49.1% since first listed11 events — show timeline
- 2026-06-04 Listed $79,000 ForSaleByOwner.com
- 2026-04-18 Rental Removed $800 TURBOTENANT
- 2026-03-26 Price Changed $800 TURBOTENANT
- 2026-03-18 Listed for Rent $875 TURBOTENANT
- 2026-03-05 Sold (MLS) $16,000 IAR
- 2026-02-03 Pending — IAR
- 2026-01-15 Price Changed $19,000 IAR
- 2025-11-24 Price Changed $24,900 IAR
- 2025-10-23 Listed $29,900 IAR
- 2022-10-24 Sold (Public Records) $53,000 Public Records
- 2022-08-26 Listed — RMLSA as Distributed by MLS Grid
Property tax history
-1.1%/yrLatest (2024): $1,498 · -0.5% YoY. Source: county tax records.
Cash-flow waterfall
monthlySold comps — $/sqft
last 12 mo · ≤1 miLoading sold comps…