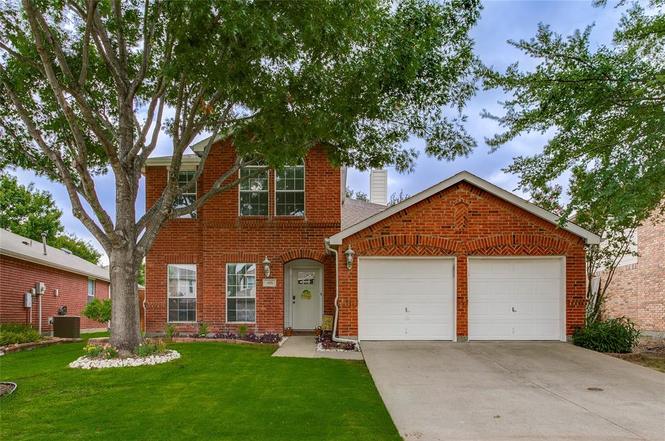
505 Colt Dr · Forney, TX
Flood risk 1/10 · Minimal
- FEMA flood zone
- X (unshaded)
- Chance of flooding over 30 yrs
- 0.0%
- Est. flood insurance / yr
- $507 – $1,088
Fire risk 4/10 · Minor
- Est. fire insurance / yr
- $1,222 – $2,270
Heat risk 8/10 · Major
- Hot days now (above 110°F)
- 7 days/yr
- Hot days in 30 yrs
- 25 days/yr
Wind risk 6/10 · Moderate
- Chance of severe wind over 30 yrs
- 27.0%
Air-quality risk 2/10 · Minimal
- Unhealthy air days now
- 1 days/yr
- Unhealthy air days in 30 yrs
- 1 days/yr
Risk factors via First Street. Map © Google.
Why this score? — see what drove the D+ grade
The composite is a weighted blend of 9 inputs, each scored 0–100. Each bar is that input's sub-score; the figure is the points it added to the 100-point composite (weight × sub-score).
- ARV discount +15.0/15.0
- Cash flow +11.3/30.0
- Schools +4.0/10.0
- Livability +3.8/5.0
- Condition / age +3.8/5.0
- 1% rule +3.4/10.0
- DSCR +3.3/10.0
- Rent growth +2.9/5.0
- Appreciation +0.0/10.0
$299,999
🖨 Deal sheet (PDF) 📄 Offer letter ✓ Due diligence
Listing remarks
From the moment you step inside, you’ll feel right at home in this beautifully updated 4-bedroom, 2.5-bath home in Mustang Creek. Offering over 2,500 square feet of living space, this home has been thoughtfully updated and maintained, making it truly move-in ready. The heart of the home is the stunning remodeled kitchen featuring updated countertops, professionally painted cabinetry, custom backsplash, under-cabinet lighting, a new oven (2026) and a new dishwasher (2025). Whether you’re preparing weeknight dinners or hosting holiday gatherings, this kitchen is designed to bring everyone together. The kitchen flows seamlessly into the spacious family room where a gorgeous stone f
Key facts
- Renovated bathroom
- Remodeled kitchen
- Detached workshop
Tags
Property features AI
Finance
- Other: Located in the Mustang Creek subdivision
- HOA & community: Mandatory association; Semi-annual HOA fee; HOA covers grounds maintenance and management fees; Managed by Texas Star Community Management
Exterior
- Parking: Attached 2-car garage with garage door opener (garage faces front); 2 covered parking spaces; Driveway
- Utilities: City water; City sewer; Natural gas available; Cable available
- Home design: Single-family residence; Two levels; Residential property
- Construction: Built in 2002; Block construction; Composition roof
- Exterior features: Covered porch(es); Wood fencing; Interior lot
Interior
- Kitchen: Granite countertops; Breakfast bar; Dishwasher; Electric range; Microwave; Disposal
- Bedrooms: 4 bedrooms total; Primary bedroom on level 1 with dual sinks, ensuite bath, garden tub, separate shower, and walk-in closet(s); Additional bedrooms on level 2
- Flooring: Carpet; Ceramic tile
- Bathrooms: 2 full bathrooms; 1 half bathroom
- Heating & cooling: Central heating (natural gas); Central air (electric); Ceiling fans
- Interior features: Cable TV available; Eat-in kitchen; Granite counters; Walk-in closets; Window coverings; Two living areas; Two dining areas; Fireplace (brick, gas)
- Laundry & utility: Full-size washer/dryer area; Washer hookup; Electric dryer hookup; Utility room / laundry room
Neighborhood map
What this means for you Summary
Snapshot
- This is a 4-bed/2.5-bath single-family listed at $300k. Condition is rated good.
Deal economics
- At list price, monthly cash flow is $-111 ($-1k/yr) — negative.
- To cash-flow at today's rent, offer at most $284k (5.3% below list).
- To meet the 1% rule (rent ≥ 1% of price), the offer needs to be $251k (16.3% below list).
- Recommended offer: $251k (16.3% below list) — sets the bar for 1% rule.
- Cap rate 5.9% vs local median 4.1% in Forney — top-decile yield for the area; either an underpriced asset or a hidden risk that comps aren't pricing in. Stress-test before assuming the spread holds.
Location & tenants
- Location reads 76/100 on livability (#98 in TX, #3,339 nationally) — a middle-class / working-renter tenant base. Strengths: crime A+, employment A+, cost of living A+; Watch: amenities C-, commute F.
- Forney ISD (rural): math 41% / reading 44% proficiency, ranked #234 of 826 in TX (top 28%) — families likely to look elsewhere, expect single-tenant / working-renter base with shorter leases.
- Zoned schools: Criswell El (math 41% / reading 50%, grade D-, #1,112 of 4,322 statewide, top 26%, 807 students, 50% FRL); Brown Middle (math 29% / reading 39%, grade F, #892 of 1,662 statewide, top 55%, 673 students, 56% FRL); North Forney H S (math 32% / reading 45%, grade F, #866 of 1,632 statewide, top 54%, 2,502 students, 49% FRL) — zoned schools average 52% FRL vs 26% district-wide (25 pts higher); higher-poverty schools than district average — tighter screening recommended.
- Market conditions: Rents rising (+1.4%/yr); 2200 active listings in the ZIP; 35 comparable units currently listed for rent nearby; rentals at typical pace (median 24d on market — plan ~3-4 weeks tenant-placement turnaround); solid renter incomes; 1,747 units permitted in Kaufman County in 2024 (180 in 5+ unit buildings).
Forward outlook
- Local home prices are declining (-3.0%/yr); year-one equity from $2k of loan paydown is wiped out by about $9k of value loss. Plan a longer hold.
- Kaufman County population projected at +43% by 2050 — long-run rental-demand tailwind backs the buy-and-hold thesis.
Negotiation context
- Only 4 days on market — expect competitive offers; lowballing is unlikely to land.
Risks & watch-outs
- Climate carrying-cost: major wind risk, 27% chance of damaging wind over 30y; extreme-heat days projected 7→25/yr by 2055 (HVAC capex compounding) — expect insurance premiums to compound above CPI over the hold.
Questions for the listing agent
- What do current leases actually rent for vs. the listed asking? Can we see a recent rent roll and the last 12 months of T-12 income?
- What does the HOA fee cover, when was the last increase, and are there any pending special assessments or reserve-fund shortfalls?
- Is there a deadline driving the sale (1031 exchange, divorce, estate, relocation)? That informs how much negotiation room exists.
- Schools are B-rated — typically a magnet for longer-tenancy family renters. What's the average tenant stay here, and is there a school-zone premium baked into asking?
- The area grade is low — what's the realistic commute time and amenity access for the typical tenant pool here? Any planned neighborhood developments (good or bad) we should know about?
- What's the average days-on-market for RENTAL listings here right now (not sales)? A rising rental-DOM trend means longer vacancies and softer asking-rent achievability than the comps imply.
- What's the recent tenant-quality profile in this submarket — average credit score on applications, eviction rate, late-payment / NSF rate, and stable-employment percentage? A property-management company in the area should have these aggregated.
- How much new for-sale + rental construction is in the pipeline within 1–3 miles? Heavy new supply typically softens prices + rents 12–24 months out; constrained supply supports both.
Investment metrics
- 1% rule
- 0.84% ✗
- Cap rate
- 5.85%
- Cash-on-cash
- -1.58%
- DSCR
- 0.93
- GRM
- 10.0
CMA / ARV
- ARV (on-the-fly)
- $371,480
- Comps found
- 12
Show comp detail 12 sales within ~0.75 mi
| Address | Dist | Beds/Ba | Sqft | Sold | Price | $/sf | Match |
|---|---|---|---|---|---|---|---|
| 221 Wolf Dr | 0.41mi | 4/2.5 | 2,510 (0%) | 1mo | $320,000 | $127 | 80 |
| 100 Patriot Pkwy | 0.40mi | 4/2.0 | 2,316 (-8%) | 1mo | $350,000 | $151 | 66 |
| 539 San Angelo Dr | 0.65mi | 4/3.0 | 2,484 (-1%) | 3mo | $434,025 | $175 | 64 |
| 506 Fort Davis Dr | 0.69mi | 4/2.5 | 2,543 (+1%) | 2mo | $399,090 | $157 | 64 |
| 112 Garner Ct | 0.56mi | 4/2.5 | 2,350 (-6%) | 0mo | $305,000 | $130 | 63 |
| 512 Pinnacles Ct | 0.70mi | 4/3.5 | 2,505 (-0%) | 2mo | $434,356 | $173 | 61 |
| 212 Painted Trl | 0.74mi | 5/3.0 (+1) | 2,494 (-1%) | 3mo | $369,990 | $148 | 55 |
| 232 Cisco Trl | 0.68mi | 4/2.5 | 2,691 (+7%) | 2mo | $394,990 | $147 | 54 |
| 120 Big Bend Dr | 0.53mi | 4/2.5 | 2,152 (-14%) | 2mo | $295,000 | $137 | 50 |
| 229 Cisco Trl | 0.68mi | 4/3.0 | 2,756 (+10%) | 2mo | $399,900 | $145 | 48 |
| 510 Fort Davis Dr | 0.72mi | 3/2.5 (-1) | 2,322 (-8%) | 2mo | $384,525 | $166 | 47 |
| 216 Freedom Trl | 0.56mi | 3/2.0 (-1) | 2,778 (+11%) | 4mo | $409,990 | $148 | 46 |
Match score weights: distance 35% · size 25% · config 20% · recency 20%. Top-matched comps best support the ARV.
Projected returns pro-forma
-3.0% appreciation · 1.42% rent growth · sell at horizon
- IRR
- -20.7%
- Equity multiple
- 0.29×
- Total profit
- $-59,540
- Equity at exit
- $44,731
- IRR
- -17.9%
- Equity multiple
- 0.09×
- Total profit
- $-76,336
- Equity at exit
- $25,938
Cash invested: $84,000 (down + closing). Projections, not guarantees.
Landlord ↔ Tenant lean methodology
- Overall (STATE)
- 87 Strongly Landlord-Friendly
- State Texas
- 87 Strongly Landlord-Friendly · R+5
- County
- — inherits STATE
- City
- — inherits STATE
ZIP-level market 75126
- Rents YoY
- 1.4%
- Active inventory
- 2200
- Price-to-rent
- 10.0×
Monthly cashflow live
- Estimated rent
- $2,511 high interval (Pro) →
- Mortgage (P&I)
- −$1,573
- Tax est. 1.5%
- −$375 /mo · $4,500/yr
- Insurance
- −$125
- HOA
- −$21
- Vacancy / Maint / Mgmt
- −$527
- Net cashflow
- $-111
Break-even live
Sensitivity live
| Price | -10% $97 | -5% $-7 | +0% $-111 | +5% $-214 | +10% $-318 |
|---|---|---|---|---|---|
| Rent | -10% $-309 | -5% $-210 | +0% $-111 | +5% $-11 | +10% $88 |
| Rate | -1.0pp $40 | -0.5pp $-34 | base $-111 | +0.5pp $-188 | +1.0pp $-267 |
UW: 25.0% down · 7.5% · 30yr · 1.5% tax · 5.0% vac · 8.0% maint · 8.0% mgmt
Financing live
Cash to close
- Down payment
- $75,000
- Closing costs
- $9,000
- Reserves months
- —
- Total cash needed
- —
Loan-product check · same deal, 3 products live
Conventional
25% down · 7.5% · 30yr
- Down + closing
- —
- Monthly P&I
- —
- Monthly cashflow
- —
- DSCR
- —
- Eligible?
- —
Personal DTI + credit; lowest rate.
DSCR
20% down · 8.5% · 30yr
- Down + closing
- —
- Monthly P&I
- —
- Monthly cashflow
- —
- DSCR
- —
- Eligible?
- —
No personal income docs; deal must DSCR.
Hard money
10% down · 12.0% · 12mo
- Down + closing
- —
- Monthly P&I
- —
- Monthly cashflow
- —
- DSCR
- —
- Eligible?
- —
Short-term bridge; refi at stabilization.
Rent comps 35 comps
| Address | Beds | Baths | Sqft | Rent | $/sqft | DOM | Units | Dist |
|---|---|---|---|---|---|---|---|---|
| 110 Meadow Ct Forney, TX | 3.0 | 2.0 | 1840 | $1,783 | $0.97 | 0d | 1 | 0.09mi |
| 501 Branch St Forney, TX | 3.0 | 2.0 | 2130 | $2,270 | $1.07 | 0d | 1 | 0.12mi |
| 315 Forestwood Dr Forney, TX | 4.0 | 2.0 | 2102 | $2,085 | $0.99 | 26d | 1 | 0.20mi |
| 507 Thunder Trl Forney, TX | 3.0 | 2.0 | 1800 | $2,300 | $1.28 | 0d | 1 | 0.20mi |
| 213 Long Prairie Dr Forney, TX | 4.0 | 2.5 | 1964 | $2,025 | $1.03 | 18d | 1 | 0.29mi |
| 236 Archer Way Forney, TX | 3.0 | 2.0 | 2016 | $2,300 | $1.14 | 20d | 1 | 0.41mi |
| 502 Ponderosa Dr Forney, TX | 3.0 | 2.0 | 2131 | $2,145 | $1.01 | 0d | 1 | 0.42mi |
| 108 Antler Trl Forney, TX | 4.0 | 2.0 | 2250 | $2,449 | $1.09 | 26d | 1 | 0.46mi |
| 511 Rosewood Ln Forney, TX | 4.0 | 2.0 | 1900 | $2,070 | $1.09 | 23d | 1 | 0.51mi |
| 120 Garner Ct Forney, TX | 3.0 | 2.0 | 2214 | $2,500 | $1.13 | 45d | 1 | 0.53mi |
| 280 Cisco Trl Forney, TX | 5.0 | 3.0 | 2476 | $3,800 | $1.53 | 26d | 1 | 0.54mi |
| 293 Arbury Dr Forney, TX | 4.0 | 3.5 | 2928 | $2,590 | $0.88 | 9d | 1 | 0.61mi |
| 293 Arbury Dr Forney, TX | 4.0 | 3.5 | 2928 | $2,801 | $0.96 | 26d | 1 | 0.61mi |
| 1124 Longhorn Ln Forney, TX | 4.0 | 2.5 | 2093 | $2,500 | $1.19 | 26d | 1 | 0.68mi |
| 100 Acadia Ln Forney, TX | 5.0 | 4.5 | 3216 | $2,850 | $0.89 | 9d | 1 | 0.71mi |
| 209 Chesapeake Dr Forney, TX | 4.0 | 3.5 | 2950 | $3,400 | $1.15 | 45d | 1 | 0.74mi |
| 2201 Woodberry Dr Forney, TX | 3.0 | 2.0 | 1839 | $2,050 | $1.11 | 45d | 1 | 0.75mi |
| 130 Monument Dr Forney, TX | 4.0 | 3.0 | 2748 | $3,499 | $1.27 | 26d | 1 | 0.77mi |
| 236 Pennridge Dr Forney, TX | 3.0 | 2.0 | 1871 | $2,295 | $1.23 | 26d | 1 | 0.79mi |
| 2105 Cardinal Dr Forney, TX | 4.0 | 2.0 | 1763 | $2,200 | $1.25 | 23d | 1 | 0.84mi |
| 2221 Overton Dr Forney, TX | 4.0 | 2.5 | 3596 | $2,649 | $0.74 | 45d | 1 | 0.90mi |
| 2127 Pecan Ridge Dr Forney, TX | 3.0 | 2.0 | 2113 | $2,100 | $0.99 | 45d | 1 | 0.92mi |
| 106 Painted Trl Forney, TX | 4.0 | 2.5 | 2926 | $2,395 | $0.82 | 45d | 1 | 0.99mi |
| 106 Painted Trl Forney, TX | 4.0 | 2.0 | 2926 | $2,725 | $0.93 | 14d | 1 | 0.99mi |
| 525 Ardsley Ln Forney, TX | 4.0 | 2.0 | 1775 | $2,395 | $1.35 | 0d | 1 | 1.05mi |
| 534 Tuscany Dr Forney, TX | 4.0 | 2.0 | 2069 | $2,500 | $1.21 | 45d | 1 | 1.12mi |
| 1410 Crossford Trl Forney, TX | 3.0 | 2.5 | 2707 | $2,650 | $0.98 | 3d | 1 | 1.13mi |
| 2239 Heaton Forney, TX | 5.0 | 2.5 | 2780 | $3,299 | $1.19 | 19d | 1 | 1.15mi |
| 1408 Grove Pond Rd Forney, TX | 4.0 | 3.5 | 2543 | $3,095 | $1.22 | 45d | 1 | 1.16mi |
| 2225 Heaton Forney, TX | 3.0 | 2.0 | 1909 | $2,150 | $1.13 | 45d | 1 | 1.17mi |
| 114 Cole St Forney, TX | 4.0 | 3.0 | 2603 | $2,529 | $0.97 | 23d | 1 | 1.17mi |
| 2213 Heaton Forney, TX | 3.0 | 2.0 | 2146 | $2,395 | $1.12 | 9d | 1 | 1.19mi |
| 2213 Heaton Forney, TX | 3.0 | 2.0 | 2146 | $2,395 | $1.12 | 18d | 1 | 1.19mi |
| 635 Brockwell Bnd Forney, TX | 4.0 | 3.0 | 2506 | $3,300 | $1.32 | 21d | 1 | 1.43mi |
| 1108 Redcoat Dr , TX | 3.0 | 2.0 | 1800 | $2,250 | $1.25 | 6d | 1 | 1.48mi |
HOA detail
- Monthly dues
- $21 · $252/yr
Listing history 3 events
-
2026-06-21days on market $299,999 Active 4 DOM
-
2026-06-17remarks 687-char remark
-
2026-06-17$299,999 Active 1 DOM
ⓘ Source: listings_history table (triggers on properties + properties_extension) + one-shot
backfill from property_details.listing_events for pre-trigger history.
Climate risk First Street
- Flood 1/10 Low FEMA zone X (unshaded) · 0% chance over 30 yrs
- Wildfire 4/10 Moderate
- Heat 8/10 Severe 7 d/yr ≥110°F today · 25 d/yr by 30 yrs out
- Wind 6/10 Major 27% chance of damaging wind over 30 yrs
- Air quality 2/10 Low 1 unhealthy d/yr today · 1 by 30 yrs out
Nearby sold comps map
Loading sold comps map…
Walkable amenities ~0.75 mi
Loading nearby amenities…
Taxation est. · year 1
- Rental income
- $30,130
- − Mortgage interest
- −$16,805
- − Property taxes
- −$4,500
- − Insurance
- −$1,500
- − Repairs & maintenance
- −$2,410
- − Management
- −$2,410
- − HOA
- −$252
- − Depreciation
- −$8,727
- Taxable loss
- −$6,474
- Est. tax savings @ 24.0%
- +$1,554
- After-tax cash flow
- $226/yr
For passive investors: Depreciation is non-cash, so a rental often shows a tax loss while cash-flowing — sheltering income. Rental losses are passive: they offset passive income freely, and up to $25,000/yr can offset ordinary (W-2) income if you actively participate and your MAGI is under $100k (phasing out to $0 by $150k); unused losses carry forward. On sale, claimed depreciation is recaptured at up to 25%, and gains may owe capital-gains tax (a 1031 exchange can defer both). Figures are a year-1 estimate at your 24.0% rate — not tax advice; consult a CPA.
Condition & rehab AI · 6 photos
This move-in ready home features a beautifully updated kitchen and well-maintained exterior, making it an attractive option for both resale and rental.
Value-add opportunities
- Both Painting exterior and interior walls — Fresh paint enhances curb appeal and interior aesthetics.
- Both Landscaping improvements — Enhances curb appeal and adds value to the property.
- Both Replace light fixtures — Modernizes the home and improves curb appeal.
Renovation cost estimate screening
Value-add ROI direction
- Both Painting exterior and interior walls — Fresh paint enhances curb appeal and interior aesthetics. ↑
- Both Landscaping improvements — Enhances curb appeal and adds value to the property. ↑
- Both Replace light fixtures — Modernizes the home and improves curb appeal. ↑
ⓘ Cost ranges are severity-bucket heuristics (US national rule-of-thumb). Get contractor quotes + a written scope before underwriting a rehab budget.
Schools (NCES district)
- District
- Forney ISD
- NCES district ID
- 4819560
- Math proficiency
- 41% ▼ -20.00%
- Reading proficiency
- 44% ▼ -12.00%
- Median HH income
- $86,679
- Composite
- 40.07/100
- National rank
- #3812
- State rank
- #234 of 826 in TX
Livability — Forney
- Score
- 76/100
- State rank
- #98
- US rank
- #3339
Category grades
Schools grade is shown separately in the Schools card above.
Census & demographics
- Census place
- Forney, TX
- County
- Kaufman County · 122,338 people
- City population
- 84,799
- Metro
- Dallas-Fort Worth-Arlington, TX
- Population (ZIP)
- 84,799
- Household income
- $103,673
- Rent vs Own
- Severe rent burden
- 1306.0
Population outlook (Kaufman County) Hauer SSP2
- Today (2025)
- 138,716 people
- By 2030
- 150,815 · +8.7%
- By 2040
- 174,877 · +26.1%
- By 2050
- 198,020 · +42.8%
- By 2075
- 251,908 · +81.6%
- By 2100
- 285,325 · +105.7%
Race, ethnicity, and origin ACS 2023
- Neighborhood character
- Diverse neighborhood (Simpson 0.68)
- Race & ethnicity
- White 45% Black 25% Hispanic / Latino 23% Two or more races 14% Asian 3%
- Hispanic origin (detail)
- Mexican 18% Puerto Rican 1%
- Common ancestry
- Italian 2% Slovak 1% Portuguese 1%
- Foreign-born
- 12% · Canada, Vietnam
- Languages at home
- 79% English-only · Spanish 14% Arabic 1% Vietnamese 1%
Political lean MEDSL · Kaufman
- 2024 margin
- Strong R (+27.9) · D 35.6% · R 63.5%
- 2008→2024 swing
- +7.9pp toward D · 2008: -35.8pp · 2024: -27.9pp
- All cycles
- 2024: R+27.9 2020: R+33.9 2016: R+47.0 2012: R+44.4 2008: R+35.8
Not yet ingested
- Civics
- —
Market trends
- HPI YoY
- ▼ -102.93%
- Current HPI
- 148.5749
- Rent YoY
- ▲ 1.42%
- Metro
- Dallas-Fort Worth-Arlington, TX
- State GDP YoY
- ▲ 3.95%
- F500 in state
- 110
Industry mix (Fortune 500 HQ in TX)
| Industry | F500 HQs | Revenue |
|---|---|---|
| Energy | 16 | $1,198B |
|
||
| Technology | 5 | $198B |
|
||
| Engineering / Construction | 4 | $72B |
|
||
| Energy Services | 3 | $60B |
|
||
| Utilities | 3 | $41B |
|
||
| Healthcare | 2 | $330B |
|
||
Price history
1 event — show timeline
- 2026-06-16 Listed $299,999 NTREIS
Cash-flow waterfall
monthlySold comps — $/sqft
last 12 mo · ≤1 miLoading sold comps…