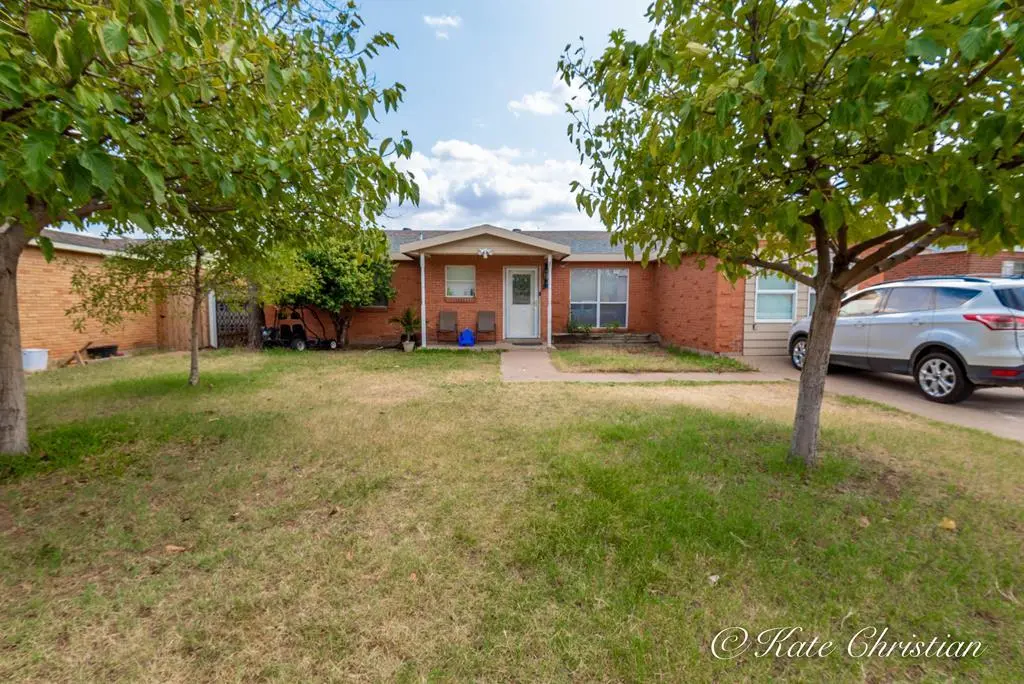
4405 Harlowe Dr · Midland, TX
Flood risk 1/10 · Minimal
- FEMA flood zone
- X
- Chance of flooding over 30 yrs
- 0.0%
- Est. flood insurance / yr
- $507 – $1,088
Fire risk 8/10 · Major
- Est. fire insurance / yr
- $1,222 – $2,270
Heat risk 6/10 · Moderate
- Hot days now (above 102°F)
- 7 days/yr
- Hot days in 30 yrs
- 22 days/yr
Wind risk 2/10 · Minimal
- Chance of severe wind over 30 yrs
- 3.0%
Air-quality risk 1/10 · Minimal
- Unhealthy air days now
- 0 days/yr
- Unhealthy air days in 30 yrs
- 0 days/yr
Risk factors via First Street. Map © Google.
Why this score? — see what drove the D+ grade
The composite is a weighted blend of 9 inputs, each scored 0–100. Each bar is that input's sub-score; the figure is the points it added to the 100-point composite (weight × sub-score).
- Cash flow +15.4/30.0
- ARV discount +12.4/15.0
- 1% rule +4.9/10.0
- DSCR +4.7/10.0
- Livability +4.0/5.0
- Schools +3.2/10.0
- Condition / age +2.5/5.0
- Rent growth +2.4/5.0
- Appreciation +0.0/10.0
$215,000
🖨 Deal sheet (PDF) 📄 Offer letter ✓ Due diligence
Listing remarks MLS
HOME SWEET INVESTMENT! This home in Wilshire Park has all the square footage you could dream of! 4 Bedrooms with 3 FULL baths! The metal fence is surrounding the backyard. Grab your favorite agent or investor and check out this hidden gem! FRESH PAINT INSIDE & OUTSIDE!
Key facts
- 7,971 sq ft lot
- Built 1957
- Listed 24 days
Neighborhood map
What this means for you Summary
Snapshot
- This is a 4-bed/3.0-bath single-family listed at $215k.
Deal economics
- At list price, monthly cash flow is $82 ($985/yr) — positive.
- The deal already cash-flows at list — no discount required.
- To meet the 1% rule (rent ≥ 1% of price), the offer needs to be $213k (0.8% below list).
- Recommended offer: $212k (1.5% below list) — sets the bar for market timing.
- Cap rate 6.8% vs local median 4.7% in Midland — top-decile yield for the area; either an underpriced asset or a hidden risk that comps aren't pricing in. Stress-test before assuming the spread holds.
Location & tenants
- Location reads 79/100 on livability (#57 in TX, #2,192 nationally) — a middle-class / working-renter tenant base. Strengths: employment A+, housing A+, health & safety A+; Watch: crime C-, commute D+, amenities D.
- Midland ISD (urban): math 34% / reading 36% proficiency, ranked #477 of 826 in TX (top 58%) — families likely to look elsewhere, expect single-tenant / working-renter base with shorter leases.
- Zoned schools: Carver Center (math 89% / reading 93%, grade A+, #4 of 4,322 statewide, top 0%, 488 students, 17% FRL, charter); Alamo J H (math 23% / reading 32%, grade F, #1,156 of 1,662 statewide, top 71%, 865 students, 62% FRL); Legacy H S (math 37% / reading 3%, grade F, #1,397 of 1,632 statewide, top 87%, 2,504 students, 41% FRL).
- Market conditions: Rents soft (-0.3%/yr); 65 active listings in the ZIP; 26 comparable units currently listed for rent nearby; rentals at typical pace (median 23d on market — plan ~3-4 weeks tenant-placement turnaround); 46% of comp listings sitting > 30 days — soft ceiling on asking rent; solid renter incomes; 1,504 units permitted in Midland County in 2024 (0 in 5+ unit buildings).
- This rent runs 33% of the median local income ($77k/yr) — at the standard rent-burdened threshold; future hikes will face affordability resistance.
Forward outlook
- Local home prices are declining (-3.0%/yr); year-one equity from $1k of loan paydown is wiped out by about $6k of value loss. Plan a longer hold.
- Midland County population projected at +83% by 2050 — long-run rental-demand tailwind backs the buy-and-hold thesis.
Negotiation context
- It's been on market 24 days — a 2% lower offer ($212k) is reasonable based on typical stale-listing flexibility.
- 3 sale attempts since 6y ago; this cycle's ask is 9049% above the opening price — seller raised mid-cycle; expect resistance to lowballs.
Risks & watch-outs
- Watch-outs: built in 1957 — expect roof / HVAC / electrical / plumbing capex.
- Climate carrying-cost: severe wildfire risk; extreme-heat days projected 7→22/yr by 2055 (HVAC capex compounding) — expect insurance premiums to compound above CPI over the hold.
Questions for the listing agent
- Built in 1957 — when were the roof, HVAC, electrical panel, plumbing, and water heater last replaced?
- Is there a deadline driving the sale (1031 exchange, divorce, estate, relocation)? That informs how much negotiation room exists.
- The area grade is low — what's the realistic commute time and amenity access for the typical tenant pool here? Any planned neighborhood developments (good or bad) we should know about?
- What's the average days-on-market for RENTAL listings here right now (not sales)? A rising rental-DOM trend means longer vacancies and softer asking-rent achievability than the comps imply.
- What's the recent tenant-quality profile in this submarket — average credit score on applications, eviction rate, late-payment / NSF rate, and stable-employment percentage? A property-management company in the area should have these aggregated.
- How much new for-sale + rental construction is in the pipeline within 1–3 miles? Heavy new supply typically softens prices + rents 12–24 months out; constrained supply supports both.
Investment metrics
- 1% rule
- 0.99% ✗
- Cap rate
- 6.75%
- Cash-on-cash
- 1.64%
- DSCR
- 1.07
- GRM
- 8.4
CMA / ARV
- ARV (median comp)
- $241,520
- List price
- $215,000
- Delta
- -10.98%
- Verdict
- UNDERPRICED
- Comps
- 6 within 1.0 mi
Show comp detail 1 sale within ~0.75 mi
| Address | Dist | Beds/Ba | Sqft | Sold | Price | $/sf | Match |
|---|---|---|---|---|---|---|---|
| 4210 Pleasant Dr | 0.59mi | 3/1.0 (-1) | 1,259 (-10%) | 15mo | $160,000 | $127 | 30 |
Match score weights: distance 35% · size 25% · config 20% · recency 20%. Top-matched comps best support the ARV.
Projected returns pro-forma
-3.0% appreciation · 0.0% rent growth · sell at horizon
- IRR
- -17.3%
- Equity multiple
- 0.41×
- Total profit
- $-35,758
- Equity at exit
- $32,057
- IRR
- -16.9%
- Equity multiple
- 0.20×
- Total profit
- $-48,134
- Equity at exit
- $18,589
Cash invested: $60,200 (down + closing). Projections, not guarantees.
Landlord ↔ Tenant lean methodology
- Overall (STATE)
- 87 Strongly Landlord-Friendly
- State Texas
- 87 Strongly Landlord-Friendly · R+5
- County
- — inherits STATE
- City
- — inherits STATE
ZIP-level market 79703
- Rents YoY
- -0.3%
- Active inventory
- 65
- Price-to-rent
- 8.4×
Monthly cashflow live
- Estimated rent
- $2,132 high interval (Pro) →
- Mortgage (P&I)
- −$1,127
- Tax from tax record
- −$385 /mo · $4,623/yr
- Insurance
- −$90
- HOA
- −$0
- Vacancy / Maint / Mgmt
- −$448
- Net cashflow
- $82
Break-even live
Sensitivity live
| Price | -10% $204 | -5% $143 | +0% $82 | +5% $21 | +10% $-40 |
|---|---|---|---|---|---|
| Rent | -10% $-86 | -5% $-2 | +0% $82 | +5% $166 | +10% $250 |
| Rate | -1.0pp $190 | -0.5pp $137 | base $82 | +0.5pp $26 | +1.0pp $-30 |
UW: 25.0% down · 7.5% · 30yr · 1.5% tax · 5.0% vac · 8.0% maint · 8.0% mgmt
Financing live
Cash to close
- Down payment
- $53,750
- Closing costs
- $6,450
- Reserves months
- —
- Total cash needed
- —
Loan-product check · same deal, 3 products live
Conventional
25% down · 7.5% · 30yr
- Down + closing
- —
- Monthly P&I
- —
- Monthly cashflow
- —
- DSCR
- —
- Eligible?
- —
Personal DTI + credit; lowest rate.
DSCR
20% down · 8.5% · 30yr
- Down + closing
- —
- Monthly P&I
- —
- Monthly cashflow
- —
- DSCR
- —
- Eligible?
- —
No personal income docs; deal must DSCR.
Hard money
10% down · 12.0% · 12mo
- Down + closing
- —
- Monthly P&I
- —
- Monthly cashflow
- —
- DSCR
- —
- Eligible?
- —
Short-term bridge; refi at stabilization.
Rent comps 26 comps
| Address | Beds | Baths | Sqft | Rent | $/sqft | DOM | Units | Dist |
|---|---|---|---|---|---|---|---|---|
| 4409 Roosevelt Dr Midland, TX | 3.0 | 2.0 | 1230 | $1,750 | $1.42 | 46d | 1 | 0.11mi |
| 4515 Monty Dr Midland, TX | 4.0 | 2.0 | 1853 | $2,400 | $1.30 | 45d | 1 | 0.15mi |
| 4603 Mercedes Dr Midland, TX | 3.0 | 2.0 | 1665 | $2,199 | $1.32 | 22d | 1 | 0.23mi |
| 3811 Cedar Spring Dr Midland, TX | 4.0 | 2.0 | 1500 | $2,600 | $1.73 | 45d | 1 | 0.47mi |
| 4506 Storey Ave Midland, TX | 3.0 | 1.0 | 1400 | $1,650 | $1.18 | 15d | 1 | 0.50mi |
| 4610 Storey Ave Midland, TX | 3.0 | 2.0 | 1184 | $1,899 | $1.60 | 22d | 1 | 0.51mi |
| 4313 Storey Ave Unit A Midland, TX | 3.0 | 2.0 | 1255 | $2,000 | $1.59 | 45d | 1 | 0.57mi |
| 4403 Crockett Ave Unit A Midland, TX | 3.0 | 2.0 | 1065 | $1,800 | $1.69 | 22d | 1 | 0.57mi |
| 4405 Crockett Ave Unit A Midland, TX | 3.0 | 2.0 | 1100 | $1,800 | $1.64 | 45d | 1 | 0.57mi |
| 3607 W Michigan Ave Midland, TX | 3.0 | 2.0 | 1535 | $2,500 | $1.63 | 22d | 1 | 0.64mi |
| 4719 Bowie Dr Midland, TX | 3.0 | 2.0 | 991 | $4,500 | $4.54 | 22d | 1 | 0.80mi |
| 5109 Graceland Dr Unit A Midland, TX | 3.0 | 2.0 | 1365 | $2,250 | $1.65 | 45d | 1 | 0.86mi |
| 3712 Amelia Dr Midland, TX | 3.0 | 1.0 | 1046 | $2,000 | $1.91 | 22d | 1 | 0.88mi |
| 5205 Blue Haven Dr Midland, TX | 4.0 | 2.0 | 1539 | $6,000 | $3.90 | 45d | 1 | 0.92mi |
| 5202 Ric Dr Midland, TX | 3.0 | 2.0 | 1258 | $1,975 | $1.57 | 22d | 1 | 1.00mi |
| 909 Beal Pkwy Midland, TX | 3.0 | 2.0 | 1670 | $2,200 | $1.32 | 22d | 1 | 1.09mi |
| 3401 Storey Ave Midland, TX | 3.0 | 2.0 | 1531 | $2,200 | $1.44 | 22d | 1 | 1.10mi |
| 3401 Storey Ave Midland, TX | 3.0 | 2.0 | 1531 | $2,200 | $1.44 | 45d | 1 | 1.10mi |
| 4600 Andrews Hwy Midland, TX | 1.0–3.0 | 1.0–2.0 | 1117 | $2,590 | $2.32 | 45d | 5 | 1.15mi |
| 3311 Storey Ave Midland, TX | 3.0 | 1.5 | 1100 | $1,700 | $1.55 | 15d | 1 | 1.18mi |
| 3105 Barkley Ave Midland, TX | 4.0 | 2.0 | 1730 | $2,350 | $1.36 | 15d | 1 | 1.35mi |
| 3100 Thomas Ave Midland, TX | 3.0 | 1.0 | 1300 | $2,400 | $1.85 | 45d | 1 | 1.38mi |
| 3619 Boyd Ave Midland, TX | 3.0 | 2.0 | 1700 | $2,100 | $1.24 | 15d | 1 | 1.38mi |
| 5313 Freedom Ct Midland, TX | 3.0 | 2.0 | 1794 | $2,550 | $1.42 | 22d | 1 | 1.40mi |
| 2812 Mariana Ave Midland, TX | 3.0 | 1.5 | 1443 | $1,750 | $1.21 | 45d | 1 | 1.44mi |
| 1813 McDonald St Midland, TX | 3.0 | 2.0 | 1680 | $2,249 | $1.34 | 45d | 1 | 1.46mi |
Listing history 15 events
-
2026-06-07statusdays on market $215,000 Pending 24 DOM
-
2026-04-28price $215,000
-
2024-10-31historical $1,950
-
2024-10-19price $1,950
-
2024-10-14price $2,050
-
2024-09-27price $2,200
-
2024-09-22$2,350
-
2024-09-16historical $2,350
-
2024-09-13price $2,350
-
2024-08-31$2,500
-
2021-01-04soldstatus 275-char remark
Show marketing remark (275 chars)
HOME SWEET INVESTMENT! This home in Wilshire Park has all the square footage you could dream of! 4 Bedrooms with 3 FULL baths! The metal fence is surrounding the backyard. Grab your favorite agent or investor and check out this hidden gem! FRESH PAINT INSIDE & OUTSIDE!
-
2020-11-10$187,000 275-char remark
Show marketing remark (275 chars)
HOME SWEET INVESTMENT! This home in Wilshire Park has all the square footage you could dream of! 4 Bedrooms with 3 FULL baths! The metal fence is surrounding the backyard. Grab your favorite agent or investor and check out this hidden gem! FRESH PAINT INSIDE & OUTSIDE!
-
2006-05-16soldstatus
-
2005-07-13soldstatus
-
1987-10-14soldstatus
ⓘ Source: listings_history table (triggers on properties + properties_extension) + one-shot
backfill from property_details.listing_events for pre-trigger history.
Tax reassessment forecast TX · Resets to sale price
- Current annual tax
- $4,623 · $385/mo
- Projected year-2 tax
- $4,623 · $385/mo
- Expected delta
- $0/yr ($0/mo · 0.0%)
ⓘ Screening estimate from a state-policy table — verify with the county assessor before closing.
Climate risk First Street
- Flood 1/10 Low FEMA zone X · 0% chance over 30 yrs
- Wildfire 8/10 Severe
- Heat 6/10 Major 7 d/yr ≥102°F today · 22 d/yr by 30 yrs out
- Wind 2/10 Low 3% chance of damaging wind over 30 yrs
- Air quality 1/10 Low 0 unhealthy d/yr today · 0 by 30 yrs out
Nearby sold comps map
Loading sold comps map…
Walkable amenities ~0.75 mi
Loading nearby amenities…
Taxation est. · year 1
- Rental income
- $25,586
- − Mortgage interest
- −$12,043
- − Property taxes
- −$4,623
- − Insurance
- −$1,075
- − Repairs & maintenance
- −$2,047
- − Management
- −$2,047
- − Depreciation
- −$6,255
- Taxable loss
- −$2,504
- Est. tax savings @ 24.0%
- +$601
- After-tax cash flow
- $1,586/yr
For passive investors: Depreciation is non-cash, so a rental often shows a tax loss while cash-flowing — sheltering income. Rental losses are passive: they offset passive income freely, and up to $25,000/yr can offset ordinary (W-2) income if you actively participate and your MAGI is under $100k (phasing out to $0 by $150k); unused losses carry forward. On sale, claimed depreciation is recaptured at up to 25%, and gains may owe capital-gains tax (a 1031 exchange can defer both). Figures are a year-1 estimate at your 24.0% rate — not tax advice; consult a CPA.
Schools (NCES district)
- District
- Midland ISD
- NCES district ID
- 4830570
- Math proficiency
- 34% ▼ -7.00%
- Reading proficiency
- 36% ▬ 0.00%
- Median HH income
- $63,457
- Composite
- 31.63/100
- National rank
- #5938
- State rank
- #477 of 826 in TX
Livability — Midland
- Score
- 79/100
- State rank
- #57
- US rank
- #2192
Category grades
Schools grade is shown separately in the Schools card above.
Census & demographics
- Census place
- Midland, TX
- County
- Midland County · 168,494 people
- City population
- 168,494
- Metro
- Midland, TX
- Population (ZIP)
- 20,419
- Household income
- $77,285
- Rent vs Own
- Severe rent burden
- 417.0
Population outlook (Midland County) Hauer SSP2
- Today (2025)
- 220,895 people
- By 2030
- 253,667 · +14.8%
- By 2040
- 325,498 · +47.4%
- By 2050
- 404,168 · +83.0%
- By 2075
- 609,802 · +176.1%
- By 2100
- 760,172 · +244.1%
Race, ethnicity, and origin ACS 2023
- Neighborhood character
- Diverse neighborhood (Simpson 0.59)
- Race & ethnicity
- Hispanic / Latino 54% White 34% Two or more races 16% Black 8% Asian 2%
- Hispanic origin (detail)
- Mexican 45% Cuban 4%
- Common ancestry
- Slovak 1% Italian 1% Serbian 1%
- Foreign-born
- 20% · Canada, Jamaica, Vietnam
- Languages at home
- 58% English-only · Spanish 38% Arabic 1% Chinese 1%
Political lean MEDSL · Midland
- 2024 margin
- Solid R (+60.5) · D 19.3% · R 79.8%
- 2008→2024 swing
- -3.3pp toward R · 2008: -57.3pp · 2024: -60.5pp
- All cycles
- 2024: R+60.5 2020: R+56.6 2016: R+55.2 2012: R+61.5 2008: R+57.3
Not yet ingested
- Civics
- —
Market trends
- HPI YoY
- ▼ -250.72%
- Current HPI
- 224.6222
- Rent YoY
- ▼ -0.33%
- Metro
- Midland, TX
- State GDP YoY
- ▲ 3.95%
- F500 in state
- 110
Industry mix (Fortune 500 HQ in TX)
| Industry | F500 HQs | Revenue |
|---|---|---|
| Energy | 16 | $1,198B |
|
||
| Technology | 5 | $198B |
|
||
| Engineering / Construction | 4 | $72B |
|
||
| Energy Services | 3 | $60B |
|
||
| Utilities | 3 | $41B |
|
||
| Healthcare | 2 | $330B |
|
||
Price history
+15.0% since first listed14 events — show timeline
- 2026-04-28 Price Changed $215,000 PBBOR
- 2024-10-31 Rental Removed $1,950 PBBOR
- 2024-10-19 Price Changed $1,950 PBBOR
- 2024-10-14 Price Changed $2,050 PBBOR
- 2024-09-27 Price Changed $2,200 PBBOR
- 2024-09-22 Listed for Rent $2,350 PBBOR
- 2024-09-16 Rental Removed $2,350 PBBOR
- 2024-09-13 Price Changed $2,350 PBBOR
- 2024-08-31 Listed for Rent $2,500 PBBOR
- 2021-01-04 Sold (MLS) — ODMLS
- 2020-11-10 Listed $187,000 ODMLS
- 2006-05-16 Sold (Public Records) — Public Records
- 2005-07-13 Sold (Public Records) — Public Records
- 1987-10-14 Sold (Public Records) — Public Records
Property tax history
+8.6%/yrLatest (2025): $4,623 · -6.8% YoY. Source: county tax records.
Cash-flow waterfall
monthlySold comps — $/sqft
last 12 mo · ≤1 miLoading sold comps…