632 Pine St · Lincoln, MI
Flood risk No data
- FEMA flood zone
- —
- Chance of flooding over 30 yrs
- —
- Est. flood insurance / yr
- —
Fire risk No data
- Est. fire insurance / yr
- —
Heat risk No data
- Hot days now (above threshold)
- —
- Hot days in 30 yrs
- —
Wind risk No data
- Chance of severe wind over 30 yrs
- —
Air-quality risk No data
- Unhealthy air days now
- —
- Unhealthy air days in 30 yrs
- —
Risk factors via First Street. Map © Google.
Why this score? — see what drove the C- grade
The composite is a weighted blend of 9 inputs, each scored 0–100. Each bar is that input's sub-score; the figure is the points it added to the 100-point composite (weight × sub-score).
- Cash flow +23.7/30.0
- DSCR +7.6/10.0
- ARV discount +7.5/15.0
- 1% rule +5.2/10.0
- Livability +3.3/5.0
- Rent growth +2.5/5.0
- Condition / age +2.5/5.0
- Schools +2.4/10.0
- Appreciation +0.0/10.0
$75,000
🖨 Deal sheet (PDF) 📄 Offer letter ✓ Due diligence
Listing remarks MLS
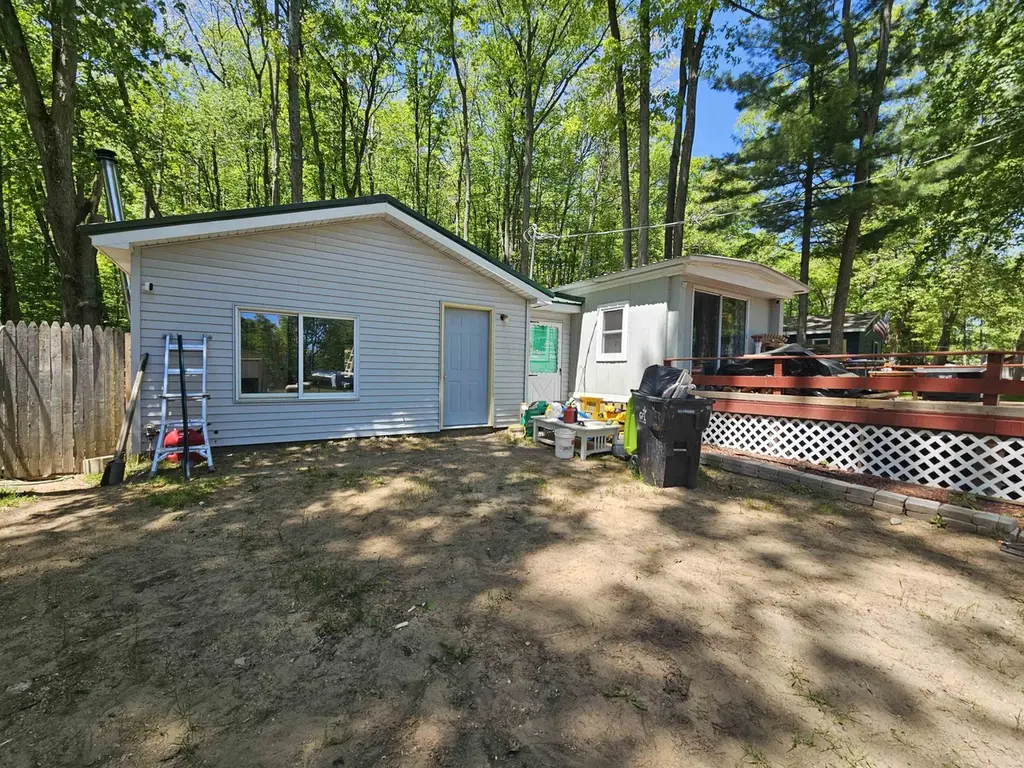
AN OPPORTUNITY TO OWN A VACATION OR YEAR ROUND HOME ON A LAND CONTRACT! THIS WELL MAINTAINED MOBILE HOME HAS A GREAT ADDITION ADDING 340 SQ. FEET OF LIVING AREA WITH A SECOND BATH & LAUNDRY AREA. THE ADDITION IS VERY OPEN WITH CARPET & DRYWALL & COULD CONTINUE TO BE USED AS A FAMILY ROOM OR PARTIONED FOR ADDITIONAL BEDROOMS. MOBILE HOME IS IN VERY GOOD CONDITION AND IS VERY CLEAN! THERE IS A LARGE DECK OFF THE FRONT OF THE MOBILE AND THE PROPERTY INCLUDES 4 LOTS (1.7 ACRES) WITH 3 LOTS BEHIND THE HOME FOR ADDITIONAL PRIVACY. BERTHA LAKE BEACH & BOAT LAUNCH IS JUST DOWN THE STREET! THIS WOULD BE AN IDEAL SNOWBIRDS SUMMER HOME!
Key facts
- 14x16 deck
- Fenced yard
- 1.8 surveyed acres
Tags
Property features AI
Finance
- Other: Property classified as residential; Acreage approximately 1.8 acres; Subdivision: Summer Set Sub
- Financial info: No land contract
- HOA & community: Community park
Exterior
- Parking: No parking details provided
- Security: No security features listed
- Utilities: Private well water; Septic system; Electricity connected (100 Amp service with circuit breakers); Propane fuel (propane tank owned); Electric water heater
- Home design: Manufactured single-wide home; One-story; Built in 1971; Facing west (side of street: W)
- Construction: Aluminum and vinyl siding exterior; Piers and slab foundation
- Exterior features: Deck; Fenced yard; Shed (outbuilding); Beach access with sandy bottom; Road frontage; Deep lot (150+ ft), unpaved; Rolling/hilly and wooded site; Rural view
Interior
- Kitchen: Eat-in kitchen (approx. 10 x 11); Range/oven; Refrigerator
- Bedrooms: Main-level primary bedroom (approx. 8 x 8) with carpet; Main-level second bedroom (approx. 11 x 11) with carpet
- Flooring: Carpet in bedrooms; Laminate in living room; Ceramic floors in some areas; Vinyl in primary bathroom
- Bathrooms: Two full bathrooms; Main-level bathroom with vinyl flooring (approx. 8 x 7); Main-level second bathroom (approx. 6 x 7)
- Heating & cooling: Space heater; Wall/window A/C
- Interior features: Cable/internet available; Ceramic floors; Living room; Eat-in kitchen; Entry
- Laundry & utility: Main-floor laundry; Washer and dryer included
Neighborhood map
What this means for you Summary
Snapshot
- This is a 2-bed/2.0-bath manufactured listed at $75k.
Deal economics
- At list price, monthly cash flow is $142 ($2k/yr) — positive.
- The deal already cash-flows at list — no discount required.
- Meets the 1% rule at list price ($765 rent vs $75k).
- Recommended offer: $74k (1.5% below list) — sets the bar for market timing.
- Cap rate 8.6% vs local median 2.9% in Lincoln — top-decile yield for the area; either an underpriced asset or a hidden risk that comps aren't pricing in. Stress-test before assuming the spread holds.
Location & tenants
- Location reads 66/100 on livability (#428 in MI) — a middle-class / working-renter tenant base. Strengths: cost of living A+, health & safety A+, housing A; Watch: crime F, amenities F, commute F.
- Farwell Area Schools (town): math 24% / reading 34% proficiency, ranked #388 of 540 in MI (top 72%) — low school quality limits family demand, transient renter base, plan for 1-2y turnover; 62% free/reduced lunch — lower-income household profile, screen leases tightly.
- Zoned schools: Farwell Elementary School (math 32% / reading 27%, grade F, #866 of 1,397 statewide, top 65%, 329 students, 77% FRL); Farwell Middle School (math 25% / reading 33%, grade F, #355 of 493 statewide, top 72%, 300 students, 68% FRL).
- Market conditions: 247 active listings in the ZIP; 77 units permitted in Clare County in 2024 (0 in 5+ unit buildings).
Forward outlook
- Local home prices are declining (-3.0%/yr); year-one equity from $519 of loan paydown is wiped out by about $2k of value loss. Plan a longer hold.
- Clare County population projected at -20% by 2050 — secular population decline; favor cash flow + early exit over multi-decade hold.
Negotiation context
- It's been on market 22 days — a 2% lower offer ($74k) is reasonable based on typical stale-listing flexibility.
- 5 sale attempts since 11y ago; this cycle's ask has dropped $10k (12%) from the opening price — seller is motivated, your offer sets the floor, not the list.
- Current owner paid $20k; list at $75k implies a 277% gain — meaningful room to come down on a strong offer.
Questions for the listing agent
- Built in 1971 — when were the roof, HVAC, electrical panel, plumbing, and water heater last replaced?
- Is there a deadline driving the sale (1031 exchange, divorce, estate, relocation)? That informs how much negotiation room exists.
- Schools are F-rated, which usually means shorter tenancies and higher turnover. Who's the typical renter profile here, and what's been the actual vacancy rate?
- Crime grade is F in this area — have there been break-ins, vandalism, or insurance claims at this property in the last 3 years? What carrier currently insures it and at what premium?
- What's the average days-on-market for RENTAL listings here right now (not sales)? A rising rental-DOM trend means longer vacancies and softer asking-rent achievability than the comps imply.
- What's the recent tenant-quality profile in this submarket — average credit score on applications, eviction rate, late-payment / NSF rate, and stable-employment percentage? A property-management company in the area should have these aggregated.
- How much new for-sale + rental construction is in the pipeline within 1–3 miles? Heavy new supply typically softens prices + rents 12–24 months out; constrained supply supports both.
Investment metrics
- 1% rule
- 1.02% ✓
- Cap rate
- 8.57%
- Cash-on-cash
- 8.14%
- DSCR
- 1.36
- GRM
- 8.2
CMA / ARV
No comps found within radius.
Projected returns pro-forma
-3.0% appreciation · 3.0% rent growth · sell at horizon
- IRR
- -3.9%
- Equity multiple
- 0.85×
- Total profit
- $-3,105
- Equity at exit
- $11,183
- IRR
- 5.7%
- Equity multiple
- 1.42×
- Total profit
- $8,882
- Equity at exit
- $6,485
Cash invested: $21,000 (down + closing). Projections, not guarantees.
Landlord ↔ Tenant lean methodology
- Overall (STATE)
- 62 Landlord-Friendly
- State Michigan
- 62 Landlord-Friendly · EVEN
- County
- — inherits STATE
- City
- — inherits STATE
ZIP-level market 48625
- Home prices YoY
- -25.5%
- Active inventory
- 247
- Price-to-rent
- 8.2×
Monthly cashflow live
- Estimated rent
- $765 medium interval (Pro) →
- Mortgage (P&I)
- −$393
- Tax from tax record
- −$37 /mo · $445/yr
- Insurance
- −$31
- HOA
- −$0
- Lot rent leased land?
- −$0
- Vacancy / Maint / Mgmt
- −$161
- Net cashflow
- $142
Break-even live
Sensitivity live
| Price | -10% $185 | -5% $164 | +0% $142 | +5% $121 | +10% $100 |
|---|---|---|---|---|---|
| Rent | -10% $82 | -5% $112 | +0% $142 | +5% $173 | +10% $203 |
| Rate | -1.0pp $180 | -0.5pp $162 | base $142 | +0.5pp $123 | +1.0pp $103 |
UW: 25.0% down · 7.5% · 30yr · 1.5% tax · 5.0% vac · 8.0% maint · 8.0% mgmt
Financing live
Cash to close
- Down payment
- $18,750
- Closing costs
- $2,250
- Reserves months
- —
- Total cash needed
- —
Loan-product check · same deal, 3 products live
Conventional
25% down · 7.5% · 30yr
- Down + closing
- —
- Monthly P&I
- —
- Monthly cashflow
- —
- DSCR
- —
- Eligible?
- —
Personal DTI + credit; lowest rate.
DSCR
20% down · 8.5% · 30yr
- Down + closing
- —
- Monthly P&I
- —
- Monthly cashflow
- —
- DSCR
- —
- Eligible?
- —
No personal income docs; deal must DSCR.
Hard money
10% down · 12.0% · 12mo
- Down + closing
- —
- Monthly P&I
- —
- Monthly cashflow
- —
- DSCR
- —
- Eligible?
- —
Short-term bridge; refi at stabilization.
Listing history 18 events
-
2026-06-22days on market $75,000 Active 22 DOM
-
2026-06-21days on market $75,000 Active 21 DOM
-
2026-06-21days on market $75,000 Active 20 DOM
-
2026-06-18days on market $75,000 Active 18 DOM
-
2026-06-17days on market $75,000 Active 17 DOM
-
2026-06-16days on market $75,000 Active 16 DOM
-
2026-06-15days on market $75,000 Active 15 DOM
-
2026-06-13days on market $75,000 Active 13 DOM
-
2026-06-12remarks 640-char remark
-
2026-06-12pricedays on market $75,000 Active 12 DOM
-
2026-06-09days on market $85,000 Active 9 DOM
-
2026-06-08days on market $85,000 Active 8 DOM
-
2026-06-07days on market $85,000 Active 7 DOM
-
2026-06-07days on market $85,000 Active 6 DOM
-
2026-06-04days on market $85,000 Active 3 DOM
-
2026-06-02days on market $85,000 Active 2 DOM
-
2026-05-31remarks 639-char remark
-
2026-05-31$85,000 Active 1 DOM
ⓘ Source: listings_history table (triggers on properties + properties_extension) + one-shot
backfill from property_details.listing_events for pre-trigger history.
Tax reassessment forecast MI · Partial reset (capped growth)
- Current annual tax
- $445 · $37/mo
- Projected year-2 tax
- $800 · $67/mo
- Expected delta
- +$355/yr (+$30/mo · 79.9%)
ⓘ Screening estimate from a state-policy table — verify with the county assessor before closing.
Nearby sold comps map
Loading sold comps map…
Walkable amenities ~0.75 mi
Loading nearby amenities…
Taxation est. · year 1
- Rental income
- $9,175
- − Mortgage interest
- −$4,201
- − Property taxes
- −$445
- − Insurance
- −$375
- − Repairs & maintenance
- −$734
- − Management
- −$734
- − Depreciation
- −$2,182
- Taxable income
- $505
- Est. tax owed @ 24.0%
- −$121
- After-tax cash flow
- $1,588/yr
For passive investors: Depreciation is non-cash, so a rental often shows a tax loss while cash-flowing — sheltering income. Rental losses are passive: they offset passive income freely, and up to $25,000/yr can offset ordinary (W-2) income if you actively participate and your MAGI is under $100k (phasing out to $0 by $150k); unused losses carry forward. On sale, claimed depreciation is recaptured at up to 25%, and gains may owe capital-gains tax (a 1031 exchange can defer both). Figures are a year-1 estimate at your 24.0% rate — not tax advice; consult a CPA.
Schools (NCES district)
- District
- Farwell Area Schools
- NCES district ID
- 2614100
- Math proficiency
- 24% ▼ -8.00%
- Reading proficiency
- 34% ▼ -8.00%
- Median HH income
- $36,696
- Composite
- 24.07/100
- National rank
- #7760
- State rank
- #388 of 540 in MI
Livability — Lincoln
- Score
- 66/100
- State rank
- #428
- US rank
- #11892
Category grades
Schools grade is shown separately in the Schools card above.
Census & demographics
- Population (ZIP)
- 12,939
Population outlook (Clare County) Hauer SSP2
- Today (2025)
- 29,283 people
- By 2030
- 28,199 · -3.7%
- By 2040
- 25,722 · -12.2%
- By 2050
- 23,372 · -20.2%
- By 2075
- 18,569 · -36.6%
- By 2100
- 14,320 · -51.1%
Race, ethnicity, and origin ACS 2023
- Neighborhood character
- Predominantly White (93%)
- Race & ethnicity
- White 93% Two or more races 4% Hispanic / Latino 3%
- Common ancestry
- Romanian 6% Lithuanian 4% Scotch-Irish 2%
- Foreign-born
- 0%
- Languages at home
- 99% English-only · Spanish 1% German/W. Germanic 1%
Political lean MEDSL · Clare
- 2024 margin
- Solid R (+37.6) · D 30.5% · R 68.1% · Other 1.4%
- 2008→2024 swing
- -42.4pp toward R · 2008: 4.8pp · 2024: -37.6pp
- All cycles
- 2024: R+37.6 2020: R+34.8 2016: R+31.8 2012: R+4.8 2008: D+4.8
Not yet ingested
- Civics
- —
Market trends
- HPI YoY
- ▼ -80.38%
- Current HPI
- 234.9586
- Rent YoY
- —
- Metro
- —
- State GDP YoY
- ▲ 1.37%
- F500 in state
- 28
Industry mix (Fortune 500 HQ in MI)
| Industry | F500 HQs | Revenue |
|---|---|---|
| Automotive Parts | 3 | $48B |
|
||
| Automotive | 2 | $372B |
|
||
| Chemicals | 1 | $45B |
|
||
| Automotive Retail | 1 | $29B |
|
||
| Healthcare / Medical Devices | 1 | $23B |
|
||
| Automotive Technology | 1 | $20B |
|
||
Price history
+327.1% since first listed10 events — show timeline
- 2026-05-31 Listed $85,000 MiRealSource-MiMLS
- 2026-04-07 Listing Removed — MiRealSource-MiMLS
- 2026-02-17 Relisted — MiRealSource-MiMLS
- 2026-02-16 Listing Removed — MiRealSource-MiMLS
- 2025-10-17 Price Changed $68,900 MiRealSource-MiMLS
- 2025-08-15 Listed $74,900 MiRealSource-MiMLS
- 2015-07-23 Sold (MLS) $19,900 MiRealSource-MiMLS
- 2015-07-23 Sold (MLS) $19,900 REALCOMP
- 2015-06-30 Listed $19,900 MiRealSource-MiMLS
- 2015-06-30 Listed $19,900 REALCOMP
Property tax history
-2.5%/yrLatest (2025): $445 · -64.1% YoY. Source: county tax records.
Cash-flow waterfall
monthlySold comps — $/sqft
last 12 mo · ≤1 miLoading sold comps…