None · Pine Hills, FL
Flood risk 1/10 · Minimal
- FEMA flood zone
- X (unshaded)
- Chance of flooding over 30 yrs
- 0.0%
- Est. flood insurance / yr
- $507 – $1,088
Fire risk 1/10 · Minimal
- Est. fire insurance / yr
- $947 – $1,759
Heat risk 9/10 · Severe
- Hot days now (above 108°F)
- 7 days/yr
- Hot days in 30 yrs
- 23 days/yr
Wind risk 9/10 · Severe
- Chance of severe wind over 30 yrs
- 99.0%
Air-quality risk 1/10 · Minimal
- Unhealthy air days now
- 0 days/yr
- Unhealthy air days in 30 yrs
- 0 days/yr
Risk factors via First Street. Map © Google.
Why this score? — see what drove the C grade
The composite is a weighted blend of 9 inputs, each scored 0–100. Each bar is that input's sub-score; the figure is the points it added to the 100-point composite (weight × sub-score).
- Cash flow +22.9/30.0
- 1% rule +8.5/10.0
- ARV discount +7.5/15.0
- DSCR +7.3/10.0
- Schools +4.1/10.0
- Livability +3.7/5.0
- Condition / age +2.5/5.0
- Rent growth +1.8/5.0
- Appreciation +0.0/10.0
$120,000
🖨 Deal sheet (PDF) 📄 Offer letter ✓ Due diligence
Listing remarks
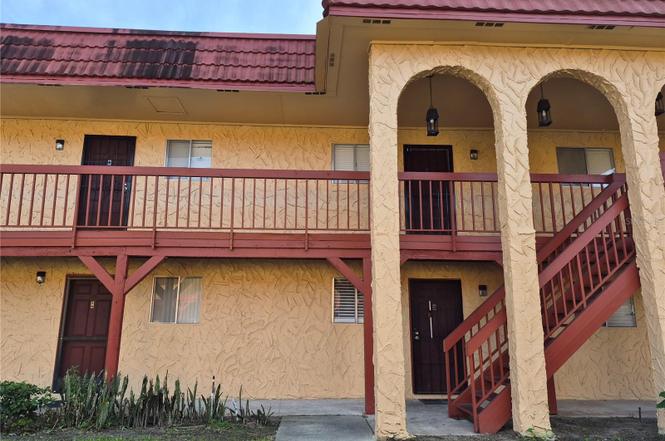
Looking for an affordable ownership in Orlando? Welcome to Oak Shadows. A gated, no rentals community. This home can be purchased with NO MONEY DOWN with Lender approval. Perfect for first time buyers, downsizers and anyone seeking low-maintenance living in a well kept community. Second floor walk-up and laundry room just a few steps from your front door. Updated kitchen and bath. Amenities include; community pool, tennis court, shuffleboard, Clubhouse, BBQ area and pet run. Enjoy the view from your rear, screened balcony with views of the landscaping.
Key facts
- Gated community
- Tennis court
- Community pool
Tags
Property features AI
Finance
- Other: Association name: HMI/Janice Loran
- Financial info: Total monthly fees listed as $322; total annual fees listed as $3,864; Lease restrictions apply
- HOA & community: Monthly association fee of $322; Association amenities include clubhouse, pool, tennis courts, playground, laundry, maintenance, and management; Association fee covers water, sewer, trash, pool, maintenance (structure & grounds), and management; Buyer approval required for community; Pets allowed with breed restrictions; cats and dogs OK
Exterior
- Parking: Assigned parking; Ground-level parking; Guest parking available
- Security: Gated community
- Utilities: Public water; Public sewer; Electricity available; Cable available
- Home design: Condominium (residential); One story; Unit on first floor; North-facing
- Construction: Block construction; Tile roof; Slab foundation; Built/completed condition
- Exterior features: Covered, enclosed rear porch with screening; Balcony; Sliding glass doors; Asphalt paved road access; Fruit trees and mature landscaping
Interior
- Kitchen: Dishwasher
- Bedrooms: 2 bedrooms
- Flooring: Laminate flooring
- Bathrooms: 1 full bathroom
- Heating & cooling: Central heating; Central air conditioning
- Interior features: Open living/dining layout; Walk-in closet(s); Window treatments (blinds, drapes)
- Laundry & utility: Shared laundry room with corridor access
Neighborhood map
What this means for you Summary
Snapshot
- This is a 2-bed/1.0-bath condo listed at $120k.
Deal economics
- At list price, monthly cash flow is $210 ($3k/yr) — positive.
- The deal already cash-flows at list — no discount required.
- Meets the 1% rule at list price ($2k rent vs $120k).
- Recommended offer: $106k (12.0% below list) — sets the bar for market timing.
- Cap rate 8.4% vs local median 4.9% in Pine Hills — top-decile yield for the area; either an underpriced asset or a hidden risk that comps aren't pricing in. Stress-test before assuming the spread holds.
Location & tenants
- Location reads 73/100 on livability (#317 in FL) — a middle-class / working-renter tenant base. Strengths: commute A+, cost of living A+, housing A+; Watch: crime D+, employment D, amenities F.
- Orange (suburban): math 46% / reading 51% proficiency, ranked #43 of 73 in FL (top 59%) — families likely to look elsewhere, expect single-tenant / working-renter base with shorter leases.
- Zoned schools: Ridgewood Park Elementary (math 19% / reading 25%, grade F, #2,080 of 2,144 statewide, top 97%, 460 students, 81% FRL); Meadowbrook Middle (math 24% / reading 24%, grade F, #532 of 571 statewide, top 94%, 957 students, 78% FRL); Maynard Evans High (math 12% / reading 27%, grade F, #562 of 667 statewide, top 85%, 2,417 students, 69% FRL) — zoned schools average 76% FRL vs 56% district-wide (20 pts higher); higher-poverty schools than district average — tighter screening recommended.
- Zoned-school proficiency averages 22% at this address vs 48% district-wide (-27 pts) — the specific schools serving this property underperform the Orange average; the district grade overstates school quality for this exact location.
- Market conditions: Rents soft (-2.7%/yr); 181 active listings in the ZIP; 17 comparable units currently listed for rent nearby; rentals at typical pace (median 26d on market — plan ~3-4 weeks tenant-placement turnaround); 8,053 units permitted in Orange County in 2024 (3,133 in 5+ unit buildings).
- This rent runs 31% of the median local income ($63k/yr) — at the standard rent-burdened threshold; future hikes will face affordability resistance.
Forward outlook
- Local home prices are declining (-3.0%/yr); year-one equity from $830 of loan paydown is wiped out by about $4k of value loss. Plan a longer hold.
- Orange County population projected at +52% by 2050 — long-run rental-demand tailwind backs the buy-and-hold thesis.
Negotiation context
- It's been on market 222 days — a 12% lower offer ($106k) is reasonable based on typical stale-listing flexibility.
- Current owner paid $25k; list at $120k implies a 380% gain — meaningful room to come down on a strong offer.
Risks & watch-outs
- Climate carrying-cost: severe wind risk, 99% chance of damaging wind over 30y; extreme-heat days projected 7→23/yr by 2055 (HVAC capex compounding) — expect insurance premiums to compound above CPI over the hold.
Questions for the listing agent
- It's been on market 222 days. Have you received any prior offers? Is the seller open to a 12% concession, seller financing, or rate buy-down credit?
- Built in 1979 — when were the roof, HVAC, electrical panel, plumbing, and water heater last replaced?
- What does the HOA fee cover, when was the last increase, and are there any pending special assessments or reserve-fund shortfalls?
- Any open or pending special assessments — roof, HVAC, plumbing, elevator, façade? What's the per-unit balance and payoff schedule, and is the seller paying it off at close or rolling it to the buyer?
- Why hasn't it sold? Are there any deal-killer items the seller is aware of (foundation, flood, title, zoning, code violations)?
- Is there a deadline driving the sale (1031 exchange, divorce, estate, relocation)? That informs how much negotiation room exists.
- Schools are B-rated — typically a magnet for longer-tenancy family renters. What's the average tenant stay here, and is there a school-zone premium baked into asking?
- Crime grade is D in this area — have there been break-ins, vandalism, or insurance claims at this property in the last 3 years? What carrier currently insures it and at what premium?
- What's the average days-on-market for RENTAL listings here right now (not sales)? A rising rental-DOM trend means longer vacancies and softer asking-rent achievability than the comps imply.
- What's the recent tenant-quality profile in this submarket — average credit score on applications, eviction rate, late-payment / NSF rate, and stable-employment percentage? A property-management company in the area should have these aggregated.
- How much new apartment / multifamily construction is in the pipeline within 1–3 miles? Heavy new supply (>2% of stock underway) typically softens rents 12–24 months out; light construction supports rent growth.
Investment metrics
- 1% rule
- 1.35% ✓
- Cap rate
- 8.40%
- Cash-on-cash
- 7.52%
- DSCR
- 1.33
- GRM
- 6.2
CMA / ARV
No comps found within radius.
Projected returns pro-forma
-3.0% appreciation · 0.0% rent growth · sell at horizon
- IRR
- -8.9%
- Equity multiple
- 0.68×
- Total profit
- $-10,615
- Equity at exit
- $17,892
- IRR
- -5.3%
- Equity multiple
- 0.71×
- Total profit
- $-9,619
- Equity at exit
- $10,375
Cash invested: $33,600 (down + closing). Projections, not guarantees.
Landlord ↔ Tenant lean methodology
- Overall (STATE)
- 87 Strongly Landlord-Friendly
- State Florida
- 87 Strongly Landlord-Friendly · R+3
- County
- — inherits STATE
- City
- — inherits STATE
ZIP-level market 32818
- Home prices YoY
- -22.5%
- Rents YoY
- -2.7%
- Active inventory
- 181
- Price-to-rent
- 6.2×
Monthly cashflow live
- Estimated rent
- $1,618 high interval (Pro) →
- Mortgage (P&I)
- −$629
- Tax from tax record
- −$67 /mo · $801/yr
- Insurance
- −$50
- HOA
- −$322
- Vacancy / Maint / Mgmt
- −$340
- Net cashflow
- $210
Break-even live
Sensitivity live
| Price | -10% $278 | -5% $244 | +0% $210 | +5% $176 | +10% $142 |
|---|---|---|---|---|---|
| Rent | -10% $83 | -5% $146 | +0% $210 | +5% $274 | +10% $338 |
| Rate | -1.0pp $271 | -0.5pp $241 | base $210 | +0.5pp $179 | +1.0pp $148 |
UW: 25.0% down · 7.5% · 30yr · 1.5% tax · 5.0% vac · 8.0% maint · 8.0% mgmt
Financing live
Cash to close
- Down payment
- $30,000
- Closing costs
- $3,600
- Reserves months
- —
- Total cash needed
- —
Loan-product check · same deal, 3 products live
Conventional
25% down · 7.5% · 30yr
- Down + closing
- —
- Monthly P&I
- —
- Monthly cashflow
- —
- DSCR
- —
- Eligible?
- —
Personal DTI + credit; lowest rate.
DSCR
20% down · 8.5% · 30yr
- Down + closing
- —
- Monthly P&I
- —
- Monthly cashflow
- —
- DSCR
- —
- Eligible?
- —
No personal income docs; deal must DSCR.
Hard money
10% down · 12.0% · 12mo
- Down + closing
- —
- Monthly P&I
- —
- Monthly cashflow
- —
- DSCR
- —
- Eligible?
- —
Short-term bridge; refi at stabilization.
Rent comps 17 comps
| Address | Beds | Baths | Sqft | Rent | $/sqft | DOM | Units | Dist |
|---|---|---|---|---|---|---|---|---|
| 3024 N Powers Dr Orlando, FL | 1.0–2.0 | 1.0–2.0 | 915 | $1,470 | $1.61 | 18d | 80 | 0.21mi |
| 6408 Sunshine St Orlando, FL | 3.0 | 1.5 | 1000 | $1,900 | $1.90 | 6d | 1 | 0.33mi |
| 6872 Alta Westgate Dr Orlando, FL | 2.0–3.0 | 2.0 | 1190 | $1,466 | $1.23 | 9d | 1 | 0.59mi |
| 5600 Silver Star Rd Orlando, FL | 1.0–3.0 | 1.0–2.0 | 850 | $1,310 | $1.54 | 16d | 6 | 0.62mi |
| 6508 Spring Glade Ct Orlando, FL | 3.0 | 2.0 | 1032 | $1,325 | $1.28 | 23d | 1 | 0.68mi |
| 1537 Ridge Pointe Dr Orlando, FL | 3.0 | 2.0 | 1108 | $2,200 | $1.99 | 25d | 1 | 0.79mi |
| 1529 Ridge Pointe Dr Orlando, FL | 3.0 | 2.0 | 1108 | $1,995 | $1.80 | 9d | 1 | 0.80mi |
| 2603 Silkwood Cir Orlando, FL | 2.0–3.0 | 2.0 | 1114 | $1,532 | $1.37 | 0d | 16 | 0.84mi |
| 2203 Silver Pines Pl #601 Orlando, FL | 2.0 | 1.0 | 962 | $1,500 | $1.56 | 25d | 1 | 0.85mi |
| 5249 Champagne Cir Orlando, FL | 2.0 | 2.0 | 980 | $1,795 | $1.83 | 25d | 1 | 1.02mi |
| 5505 Hernandes Dr #113 Orlando, FL | 2.0 | 1.0 | 728 | $1,175 | $1.61 | 25d | 1 | 1.09mi |
| 3285 Split Willow Dr Orlando, FL | 2.0 | 1.0 | 845 | $1,400 | $1.66 | 25d | 1 | 1.37mi |
| 3043 Willow Bend Blvd Orlando, FL | 2.0 | 2.0 | 900 | $1,450 | $1.61 | 25d | 1 | 1.40mi |
| 2920 Eastern Willow Ave Orlando, FL | 2.0 | 2.0 | 868 | $1,500 | $1.73 | 25d | 1 | 1.44mi |
| 3071 Willow Bend Blvd Orlando, FL | 2.0 | 2.0 | 900 | $1,525 | $1.69 | 25d | 1 | 1.44mi |
| 4705 Almond Willow Dr Orlando, FL | 2.0 | 2.0 | 864 | $1,600 | $1.85 | 25d | 1 | 1.45mi |
| 4757 Silver Star Rd Orlando, FL | 1.0 | 1.0 | 728 | $1,189 | $1.63 | 25d | 1 | 1.48mi |
HOA detail condo
- Monthly dues
- $322 · $3,864/yr
- Likely covers
- landscapingpoolsecurity
- Assessments
- None detected in remarks — confirm with the listing agent.
Listing history 18 events
-
2026-06-21days on market $120,000 Active 222 DOM
-
2026-06-18days on market $120,000 Active 219 DOM
-
2026-06-17days on market $120,000 Active 218 DOM
-
2026-06-16days on market $120,000 Active 217 DOM
-
2026-06-15days on market $120,000 Active 216 DOM
-
2026-06-13days on market $120,000 Active 214 DOM
-
2026-06-13days on market $120,000 Active 213 DOM
-
2026-06-09days on market $120,000 Active 210 DOM
-
2026-06-08days on market $120,000 Active 209 DOM
-
2026-06-07days on market $120,000 Active 208 DOM
-
2026-06-04days on market $120,000 Active 205 DOM
-
2026-06-03days on market $120,000 Active 204 DOM
-
2026-06-02days on market $120,000 Active 203 DOM
-
2026-06-02days on market $120,000 Active 202 DOM
-
2026-05-31days on market $120,000 Active 201 DOM
-
2025-11-11$120,000 Active
-
1994-07-05soldstatus $25,000
-
1980-05-01soldstatus $28,350
ⓘ Source: listings_history table (triggers on properties + properties_extension) + one-shot
backfill from property_details.listing_events for pre-trigger history.
Tax reassessment forecast FL · Resets to sale price
- Current annual tax
- $801 · $67/mo
- Projected year-2 tax
- $996 · $83/mo
- Expected delta
- +$195/yr (+$16/mo · 24.3%)
ⓘ Screening estimate from a state-policy table — verify with the county assessor before closing.
Climate risk First Street
- Flood 1/10 Low FEMA zone X (unshaded) · 0% chance over 30 yrs
- Wildfire 1/10 Low
- Heat 9/10 Extreme 7 d/yr ≥108°F today · 23 d/yr by 30 yrs out
- Wind 9/10 Extreme 99% chance of damaging wind over 30 yrs
- Air quality 1/10 Low 0 unhealthy d/yr today · 0 by 30 yrs out
Nearby sold comps map
Loading sold comps map…
Walkable amenities ~0.75 mi
Loading nearby amenities…
Taxation est. · year 1
- Rental income
- $19,420
- − Mortgage interest
- −$6,722
- − Property taxes
- −$801
- − Insurance
- −$600
- − Repairs & maintenance
- −$1,554
- − Management
- −$1,554
- − HOA
- −$3,864
- − Depreciation
- −$3,491
- Taxable income
- $835
- Est. tax owed @ 24.0%
- −$200
- After-tax cash flow
- $2,325/yr
For passive investors: Depreciation is non-cash, so a rental often shows a tax loss while cash-flowing — sheltering income. Rental losses are passive: they offset passive income freely, and up to $25,000/yr can offset ordinary (W-2) income if you actively participate and your MAGI is under $100k (phasing out to $0 by $150k); unused losses carry forward. On sale, claimed depreciation is recaptured at up to 25%, and gains may owe capital-gains tax (a 1031 exchange can defer both). Figures are a year-1 estimate at your 24.0% rate — not tax advice; consult a CPA.
Schools (NCES district)
- District
- Orange
- NCES district ID
- 1201440
- Math proficiency
- 46% ▼ -9.00%
- Reading proficiency
- 51% ▼ -2.00%
- Median HH income
- $49,350
- Composite
- 41.47/100
- National rank
- #3461
- State rank
- #43 of 73 in FL
Livability — Pine Hills
- Score
- 73/100
- State rank
- #317
- US rank
- #5362
Category grades
Schools grade is shown separately in the Schools card above.
Census & demographics
- Census place
- Pine Hills, FL
- County
- Orange County · 1,471,359 people
- City population
- 60,203
- Metro
- Orlando-Kissimmee-Sanford, FL
- Population (ZIP)
- 59,114
- Household income
- $63,061
- Rent vs Own
- Severe rent burden
- 2059.0
Population outlook (Orange County) Hauer SSP2
- Today (2025)
- 1,618,226 people
- By 2030
- 1,787,404 · +10.5%
- By 2040
- 2,125,621 · +31.4%
- By 2050
- 2,454,016 · +51.6%
- By 2075
- 3,173,711 · +96.1%
- By 2100
- 3,607,781 · +122.9%
Race, ethnicity, and origin ACS 2023
- Neighborhood character
- Predominantly Black (69%)
- Race & ethnicity
- Black 69% Hispanic / Latino 14% White 10% Two or more races 6% Asian 3%
- Hispanic origin (detail)
- Mexican 3% Puerto Rican 5% Cuban 1%
- Common ancestry
- Hispanic 21% Estonian 1% Romanian 1%
- Foreign-born
- 40% · Canada, Vietnam, China
- Languages at home
- 59% English-only · French/Haitian/Cajun 25% Spanish 11% Vietnamese 2%
Political lean MEDSL · Orange
- 2024 margin
- D (+13.6) · D 56.1% · R 42.5% · Other 1.3%
- 2008→2024 swing
- -5.0pp toward R · 2008: 18.6pp · 2024: 13.6pp
- All cycles
- 2024: D+13.6 2020: D+23.1 2016: D+24.6 2012: D+18.2 2008: D+18.6
Not yet ingested
- Civics
- —
Market trends
- HPI YoY
- ▼ -93.40%
- Current HPI
- 321.5821
- Rent YoY
- ▼ -2.66%
- Metro
- Orlando-Kissimmee-Sanford, FL
- State GDP YoY
- ▲ 3.28%
- F500 in state
- 36
Industry mix (Fortune 500 HQ in FL)
| Industry | F500 HQs | Revenue |
|---|---|---|
| Industrial Technology | 2 | $29B |
|
||
| Insurance | 2 | $17B |
|
||
| Retail | 1 | $60B |
|
||
| Technology Distribution | 1 | $58B |
|
||
| Homebuilding | 1 | $35B |
|
||
| Technology Manufacturing | 1 | $35B |
|
||
Price history
+323.3% since first listed3 events — show timeline
- 2025-11-11 Listed $120,000 Stellar MLS as Distributed by MLS Grid
- 1994-07-05 Sold (Public Records) $25,000 Public Records
- 1980-05-01 Sold (Public Records) $28,350 Public Records
Property tax history
+7.5%/yrLatest (2025): $801 · +202.6% YoY. Source: county tax records.
Cash-flow waterfall
monthlySold comps — $/sqft
last 12 mo · ≤1 miLoading sold comps…