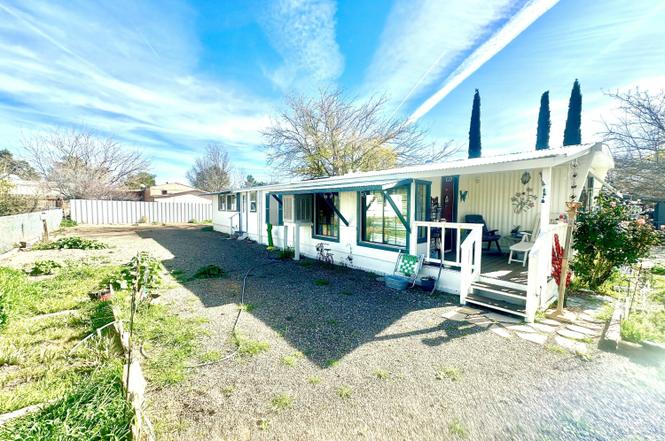
17412 E Trail Ends Rd · Spring Valley, AZ
Flood risk 1/10 · Minimal
- FEMA flood zone
- X (unshaded)
- Chance of flooding over 30 yrs
- 0.0%
- Est. flood insurance / yr
- $507 – $1,088
Fire risk 7/10 · Major
- Est. fire insurance / yr
- $610 – $1,132
Heat risk 6/10 · Moderate
- Hot days now (above 100°F)
- 7 days/yr
- Hot days in 30 yrs
- 17 days/yr
Wind risk 1/10 · Minimal
- Chance of severe wind over 30 yrs
- —
Air-quality risk 1/10 · Minimal
- Unhealthy air days now
- 0 days/yr
- Unhealthy air days in 30 yrs
- 0 days/yr
Risk factors via First Street. Map © Google.
Why this score? — see what drove the B+ grade
The composite is a weighted blend of 9 inputs, each scored 0–100. Each bar is that input's sub-score; the figure is the points it added to the 100-point composite (weight × sub-score).
- Cash flow +27.6/30.0
- ARV discount +15.0/15.0
- Appreciation +10.0/10.0
- DSCR +9.7/10.0
- 1% rule +6.2/10.0
- Livability +3.2/5.0
- Rent growth +2.5/5.0
- Condition / age +2.5/5.0
- Schools +2.0/10.0
$145,000
🖨 Deal sheet (PDF) 📄 Offer letter ✓ Due diligence
Listing remarks MLS
This mobile sits on a wonderful parcel in Spring Valley. The mobile is 2 bedrooms, 1 bath with a bonus room not included in sq. footage and laundry room with storage. Nice Mulberry tree, Rose bushes,and 2 sheds.This is an estate sale and is being sold in the ''As-Is'' condition. The seller will pump and certify septic system. No repairs will be made. It is a cash only sale.
Key facts
- 8,802 sq ft lot
- Parking
- Built 1969
Property features AI
Finance
- HOA & community: No association fees
Exterior
- Parking: 1 covered parking space; 1 carport space
- Utilities: Septic tank; Private water company
- Home design: Manufactured/mobile housing; Fee simple ownership
- Construction: Other construction materials; Metal roof (also listed as other)
- Exterior features: Partial fencing; Dirt front and back yard; Gravel/stone at front
Interior
- Kitchen: Refrigerator included
- Bedrooms: 2 bedrooms
- Bathrooms: 2 full bathrooms
- Heating & cooling: Natural gas heating; Evaporative cooling
- Interior features: Eat-in kitchen; Full bath in primary bedroom
Neighborhood map
What this means for you Summary
Snapshot
- This is a 2-bed/2.0-bath manufactured listed at $145k.
Deal economics
- At list price, monthly cash flow is $434 ($5k/yr) — positive.
- The deal already cash-flows at list — no discount required.
- Meets the 1% rule at list price ($2k rent vs $145k).
- Recommended offer: $128k (12.0% below list) — sets the bar for market timing.
Location & tenants
- Location reads 63/100 on livability (#117 in AZ) — a middle-class / working-renter tenant base. Strengths: cost of living A+, housing A+, crime A; Watch: employment D+, amenities F, commute F.
- Mayer Unified School District (4473) (rural): math 23% / reading 26% proficiency, ranked #165 of 249 in AZ (top 66%) — low school quality limits family demand, transient renter base, plan for 1-2y turnover; 80% free/reduced lunch — lower-income household profile, screen leases tightly.
- Zoned schools: Mayer Elementary School (math 26% / reading 32%, grade F, #570 of 1,109 statewide, top 52%, 373 students, 93% FRL); Mayer High School (math 5% / reading 5%, grade F, #364 of 381 statewide, top 100%, 200 students, 66% FRL) — zoned schools at 79% FRL track the district average.
- Market conditions: 242 active listings in the ZIP; 2,062 units permitted in Yavapai County in 2024 (98 in 5+ unit buildings).
Forward outlook
- In year one you build about $16k of equity ($1k loan paydown + $14k appreciation (10.0% local appreciation)).
- Yavapai County population projected at +10% by 2050 — modest demand growth; plan on rents tracking national, not racing it.
- At projected returns (10.0% appreciation + 3.0% rent growth), your $41k cash investment doubles in ~2 years — after that, you're playing with house money.
- By year 3, paydown + projected appreciation supports a ~$39k cash-out refi (75% LTV) — recoverable capital for the next deal without selling this one.
Negotiation context
- It's been on market 142 days — a 12% lower offer ($128k) is reasonable based on typical stale-listing flexibility.
- Current owner paid $30k; list at $145k implies a 383% gain — meaningful room to come down on a strong offer.
Risks & watch-outs
- Climate carrying-cost: major wildfire risk; extreme-heat days projected 7→17/yr by 2055 (HVAC capex compounding) — expect insurance premiums to compound above CPI over the hold.
Questions for the listing agent
- It's been on market 142 days. Have you received any prior offers? Is the seller open to a 12% concession, seller financing, or rate buy-down credit?
- Built in 1969 — when were the roof, HVAC, electrical panel, plumbing, and water heater last replaced?
- Why hasn't it sold? Are there any deal-killer items the seller is aware of (foundation, flood, title, zoning, code violations)?
- Is there a deadline driving the sale (1031 exchange, divorce, estate, relocation)? That informs how much negotiation room exists.
- Schools are D-rated, which usually means shorter tenancies and higher turnover. Who's the typical renter profile here, and what's been the actual vacancy rate?
- What's the average days-on-market for RENTAL listings here right now (not sales)? A rising rental-DOM trend means longer vacancies and softer asking-rent achievability than the comps imply.
- What's the recent tenant-quality profile in this submarket — average credit score on applications, eviction rate, late-payment / NSF rate, and stable-employment percentage? A property-management company in the area should have these aggregated.
- How much new for-sale + rental construction is in the pipeline within 1–3 miles? Heavy new supply typically softens prices + rents 12–24 months out; constrained supply supports both.
Investment metrics
- 1% rule
- 1.12% ✓
- Cap rate
- 9.89%
- Cash-on-cash
- 12.84%
- DSCR
- 1.57
- GRM
- 7.5
CMA / ARV
- ARV (on-the-fly)
- $182,160
- Comps found
- 4
Show comp detail 4 sales within ~0.75 mi
| Address | Dist | Beds/Ba | Sqft | Sold | Price | $/sf | Match |
|---|---|---|---|---|---|---|---|
| 17243 E Lakeveiw Dr | 0.34mi | 2/1.0 | 728 (+1%) | 11mo | $185,000 | $254 | 69 |
| 17127 Rabbit Rd | 0.45mi | 2/2.0 | 729 (+1%) | 20mo | $145,000 | $199 | 60 |
| 17465 E Meadow Ln | 0.36mi | 2/2.0 | 673 (-6%) | 15mo | $170,000 | $253 | 60 |
| 17414 E Meadow Ln | 0.31mi | 2/1.5 | 672 (-7%) | 16mo | $107,500 | $160 | 59 |
Match score weights: distance 35% · size 25% · config 20% · recency 20%. Top-matched comps best support the ARV.
Projected returns pro-forma
10.0% appreciation · 3.0% rent growth · sell at horizon
- IRR
- 33.7%
- Equity multiple
- 3.62×
- Total profit
- $106,561
- Equity at exit
- $130,627
- IRR
- 29.0%
- Equity multiple
- 8.19×
- Total profit
- $291,908
- Equity at exit
- $281,703
Cash invested: $40,600 (down + closing). Projections, not guarantees.
Landlord ↔ Tenant lean methodology
- Overall (STATE)
- 87 Strongly Landlord-Friendly
- State Arizona
- 87 Strongly Landlord-Friendly · R+3
- County
- — inherits STATE
- City
- — inherits STATE
ZIP-level market 86333
- Home prices YoY
- 17.3%
- Active inventory
- 242
- Price-to-rent
- 7.5×
Monthly cashflow live
- Estimated rent
- $1,620 medium interval (Pro) →
- Mortgage (P&I)
- −$760
- Tax from tax record
- −$24 /mo · $294/yr
- Insurance
- −$60
- HOA
- −$0
- Vacancy / Maint / Mgmt
- −$340
- Net cashflow
- $434
Break-even live
Sensitivity live
| Price | -10% $516 | -5% $475 | +0% $434 | +5% $227 | +10% $177 |
|---|---|---|---|---|---|
| Rent | -10% $306 | -5% $370 | +0% $434 | +5% $498 | +10% $562 |
| Rate | -1.0pp $507 | -0.5pp $471 | base $434 | +0.5pp $397 | +1.0pp $359 |
UW: 25.0% down · 7.5% · 30yr · 1.5% tax · 5.0% vac · 8.0% maint · 8.0% mgmt
Financing live
Cash to close
- Down payment
- $36,250
- Closing costs
- $4,350
- Reserves months
- —
- Total cash needed
- —
Loan-product check · same deal, 3 products live
Conventional
25% down · 7.5% · 30yr
- Down + closing
- —
- Monthly P&I
- —
- Monthly cashflow
- —
- DSCR
- —
- Eligible?
- —
Personal DTI + credit; lowest rate.
DSCR
20% down · 8.5% · 30yr
- Down + closing
- —
- Monthly P&I
- —
- Monthly cashflow
- —
- DSCR
- —
- Eligible?
- —
No personal income docs; deal must DSCR.
Hard money
10% down · 12.0% · 12mo
- Down + closing
- —
- Monthly P&I
- —
- Monthly cashflow
- —
- DSCR
- —
- Eligible?
- —
Short-term bridge; refi at stabilization.
Listing history 19 events
-
2026-06-18days on market $145,000 Active 142 DOM
-
2026-06-17days on market $145,000 Active 141 DOM
-
2026-06-16days on market $145,000 Active 140 DOM
-
2026-06-15days on market $145,000 Active 139 DOM
-
2026-06-14days on market $145,000 Active 137 DOM
-
2026-06-13days on market $145,000 Active 136 DOM
-
2026-06-10days on market $145,000 Active 134 DOM
-
2026-06-09days on market $145,000 Active 133 DOM
-
2026-06-08days on market $145,000 Active 132 DOM
-
2026-06-07days on market $145,000 Active 131 DOM
-
2026-06-03days on market $145,000 Active 127 DOM
-
2026-06-02days on market $145,000 Active 126 DOM
-
2026-06-01days on market $145,000 Active 125 DOM
-
2026-05-31days on market $145,000 Active 124 DOM
-
2026-05-30days on market $145,000 Active 123 DOM
-
2026-03-16price $145,000
-
2026-01-27$150,000 Active
-
2016-03-29soldstatus $30,000 376-char remark
Show marketing remark (376 chars)
This mobile sits on a wonderful parcel in Spring Valley. The mobile is 2 bedrooms, 1 bath with a bonus room not included in sq. footage and laundry room with storage. Nice Mulberry tree, Rose bushes,and 2 sheds.This is an estate sale and is being sold in the ''As-Is'' condition. The seller will pump and certify septic system. No repairs will be made. It is a cash only sale.
-
1991-12-23soldstatus $6,500
ⓘ Source: listings_history table (triggers on properties + properties_extension) + one-shot
backfill from property_details.listing_events for pre-trigger history.
Tax reassessment forecast AZ · Resets to sale price
- Current annual tax
- $294 · $24/mo
- Projected year-2 tax
- $957 · $80/mo
- Expected delta
- +$663/yr (+$55/mo · 226.0%)
ⓘ Screening estimate from a state-policy table — verify with the county assessor before closing.
Climate risk First Street
- Flood 1/10 Low FEMA zone X (unshaded) · 0% chance over 30 yrs
- Wildfire 7/10 Severe
- Heat 6/10 Major 7 d/yr ≥100°F today · 17 d/yr by 30 yrs out
- Wind 1/10 Low
- Air quality 1/10 Low 0 unhealthy d/yr today · 0 by 30 yrs out
Nearby sold comps map
Loading sold comps map…
Walkable amenities ~0.75 mi
Loading nearby amenities…
Taxation est. · year 1
- Rental income
- $19,437
- − Mortgage interest
- −$8,122
- − Property taxes
- −$294
- − Insurance
- −$725
- − Repairs & maintenance
- −$1,555
- − Management
- −$1,555
- − Depreciation
- −$4,218
- Taxable income
- $2,968
- Est. tax owed @ 24.0%
- −$712
- After-tax cash flow
- $4,500/yr
For passive investors: Depreciation is non-cash, so a rental often shows a tax loss while cash-flowing — sheltering income. Rental losses are passive: they offset passive income freely, and up to $25,000/yr can offset ordinary (W-2) income if you actively participate and your MAGI is under $100k (phasing out to $0 by $150k); unused losses carry forward. On sale, claimed depreciation is recaptured at up to 25%, and gains may owe capital-gains tax (a 1031 exchange can defer both). Figures are a year-1 estimate at your 24.0% rate — not tax advice; consult a CPA.
Schools (NCES district)
- District
- Mayer Unified School District (4473)
- NCES district ID
- 0404820
- Math proficiency
- 23% ▼ -11.00%
- Reading proficiency
- 26% ▼ -13.00%
- Median HH income
- $35,108
- Composite
- 20.22/100
- National rank
- #8627
- State rank
- #165 of 249 in AZ
Livability — Spring Valley
- Score
- 63/100
- State rank
- #117
- US rank
- #15515
Category grades
Schools grade is shown separately in the Schools card above.
Census & demographics
- Census place
- Spring Valley, AZ
- Population (ZIP)
- 6,425
Population outlook (Yavapai County) Hauer SSP2
- Today (2025)
- 241,389 people
- By 2030
- 249,523 · +3.4%
- By 2040
- 259,966 · +7.7%
- By 2050
- 264,736 · +9.7%
- By 2075
- 269,334 · +11.6%
- By 2100
- 256,505 · +6.3%
Race, ethnicity, and origin ACS 2023
- Neighborhood character
- Predominantly White (77%)
- Race & ethnicity
- White 77% Two or more races 15% Hispanic / Latino 14%
- Hispanic origin (detail)
- Mexican 11% Puerto Rican 1%
- Common ancestry
- Lithuanian 6% Iranian 3% Romanian 3%
- Foreign-born
- 5% · Canada
- Languages at home
- 93% English-only · Spanish 6% Russian/Polish/Slavic 1%
Political lean MEDSL · Yavapai
- 2024 margin
- Solid R (+33.9) · D 32.6% · R 66.5%
- 2008→2024 swing
- -9.5pp toward R · 2008: -24.4pp · 2024: -33.9pp
- All cycles
- 2024: R+33.9 2020: R+29.3 2016: R+31.4 2012: R+30.7 2008: R+24.4
Not yet ingested
- Civics
- —
Market trends
- HPI YoY
- ▲ 55.51%
- Current HPI
- 376.0374
- Rent YoY
- —
- Metro
- —
- State GDP YoY
- ▲ 4.54%
- F500 in state
- 20
Industry mix (Fortune 500 HQ in AZ)
| Industry | F500 HQs | Revenue |
|---|---|---|
| Technology | 2 | $13B |
|
||
| Mining / Metals | 1 | $23B |
|
||
| Environmental Services | 1 | $16B |
|
||
| Metals / Steel | 1 | $14B |
|
||
| Technology Distribution | 1 | $9B |
|
||
| Homebuilding | 1 | $8B |
|
||
Price history
+2130.8% since first listed4 events — show timeline
- 2026-03-16 Price Changed $145,000 ARMLS
- 2026-01-27 Listed $150,000 ARMLS
- 2016-03-29 Sold (MLS) $30,000 PAARMLS as Distributed by MLS Grid
- 1991-12-23 Sold (Public Records) $6,500 Public Records
Property tax history
+5.7%/yrLatest (2025): $294 · +6.1% YoY. Source: county tax records.
Cash-flow waterfall
monthlySold comps — $/sqft
last 12 mo · ≤1 miLoading sold comps…