2924 Duncan St · Louisville, KY
Flood risk 8/10 · Major
- FEMA flood zone
- X (unshaded)
- Chance of flooding over 30 yrs
- 0.99%
- Est. flood insurance / yr
- $507 – $1,088
Fire risk 1/10 · Minimal
- Est. fire insurance / yr
- $839 – $1,559
Heat risk 5/10 · Moderate
- Hot days now (above 105°F)
- 7 days/yr
- Hot days in 30 yrs
- 20 days/yr
Wind risk 2/10 · Minimal
- Chance of severe wind over 30 yrs
- 1.0%
Air-quality risk 2/10 · Minimal
- Unhealthy air days now
- 1 days/yr
- Unhealthy air days in 30 yrs
- 2 days/yr
Risk factors via First Street. Map © Google.
Why this score? — see what drove the B- grade
The composite is a weighted blend of 9 inputs, each scored 0–100. Each bar is that input's sub-score; the figure is the points it added to the 100-point composite (weight × sub-score).
- Cash flow +29.9/30.0
- DSCR +10.0/10.0
- Appreciation +10.0/10.0
- 1% rule +8.5/10.0
- Livability +3.2/5.0
- Rent growth +2.6/5.0
- Condition / age +2.5/5.0
- Schools +2.3/10.0
- ARV discount +0.0/15.0
$72,900
🖨 Deal sheet (PDF) 📄 Offer letter ✓ Due diligence
Listing remarks
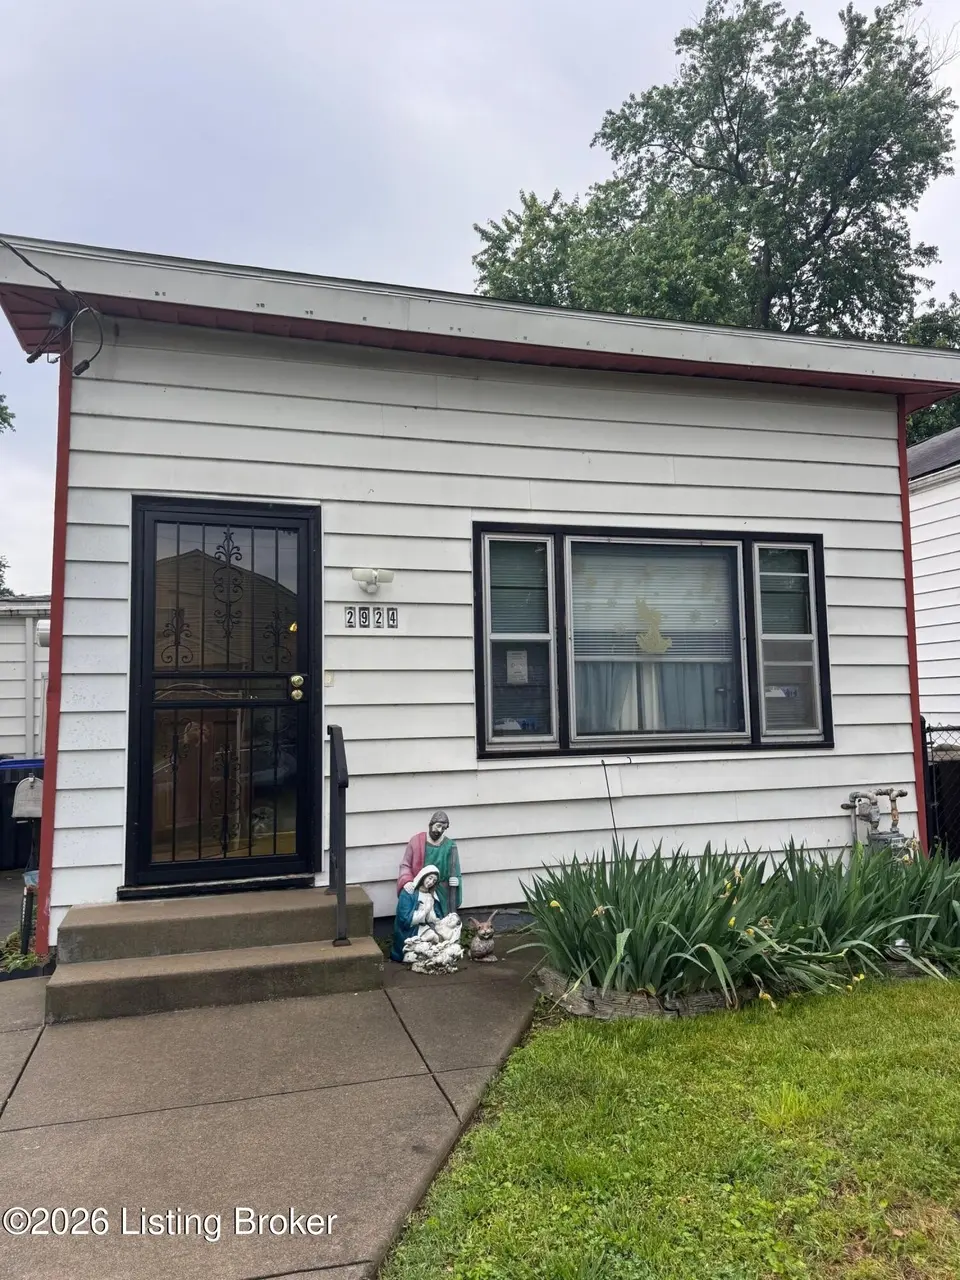
First time this home has been on the market! Proudly owned and occupied by the current owner since 1958, this 2 bedroom, 1 bath home is ready for its next chapter. Offering a 2 car garage, fully fenced backyard, and additional storage shed, this property provides a great opportunity for a buyer looking to add their own personal touches and cosmetic updates to make it truly shine. Recent improvements include a professionally installed handicap accessible shower unit, updated bathroom flooring, and storm doors. Conveniently located just minutes from the interstate, the Norton Sports Complex, local shopping, restaurants, and within walking distance to the elementary school. Great opportunity f
Key facts
- Storm doors
- 5,998 sq ft lot
- 2 garage spots
Tags
Property features AI
Finance
- HOA & community: No association fee
Exterior
- Parking: Detached 1-car garage
- Utilities: Electricity connected; Natural gas available
- Home design: Single-family residence; Shotgun-style architecture; One story
- Construction: Built in 1900; Aluminum siding; Shingle roof; Crawl space foundation
- Exterior features: Sidewalk; Wood and chain-link fencing
Interior
- Kitchen: Kitchen on the first floor; Separate dining room on the first floor
- Bedrooms: 2 bedrooms (both on the first floor; primary bedroom on the first floor)
- Bathrooms: 1 full bathroom on the first floor
- Heating & cooling: Forced air heating (natural gas); Central air conditioning
- Interior features: Six total rooms; No basement
- Laundry & utility: Laundry room on the first floor; First-floor laundry
Neighborhood map
What this means for you Summary
Snapshot
- This is a 2-bed/1.0-bath single-family listed at $73k.
Deal economics
- At list price, monthly cash flow is $204 ($2k/yr) — positive.
- The deal already cash-flows at list — no discount required.
- Meets the 1% rule at list price ($981 rent vs $73k).
- Recommended offer: $71k (3.0% below list) — sets the bar for market timing.
- Cap rate 10.8% vs local median 5.0% in Louisville — top-decile yield for the area; either an underpriced asset or a hidden risk that comps aren't pricing in. Stress-test before assuming the spread holds.
Location & tenants
- Location reads 63/100 on livability (#333 in KY) — a middle-class / working-renter tenant base. Strengths: cost of living A+, housing A+; Watch: employment C-, health & safety D+, crime F.
- Jefferson County (urban): math 19% / reading 35% proficiency, ranked #121 of 165 in KY (top 73%) — low school quality limits family demand, transient renter base, plan for 1-2y turnover.
- Zoned schools: Atkinson Academy (math 8% / reading 12%, grade F, #648 of 676 statewide, top 98%, 327 students, 88% FRL); Westport Middle (math 16% / reading 38%, grade F, #172 of 217 statewide, top 80%, 1,177 students, 55% FRL) — zoned schools average 72% FRL vs 56% district-wide (16 pts higher); higher-poverty schools than district average — tighter screening recommended.
- Market conditions: Rents flat; 141 active listings in the ZIP; 40 comparable units currently listed for rent nearby; rentals at typical pace (median 25d on market — plan ~3-4 weeks tenant-placement turnaround); lower-income renter base — watch delinquency; 2,836 units permitted in Jefferson County in 2024 (1,558 in 5+ unit buildings).
- This rent runs 33% of the median local income ($36k/yr) — at the standard rent-burdened threshold; future hikes will face affordability resistance.
Forward outlook
- In year one you build about $8k of equity ($504 loan paydown + $7k appreciation (10.0% local appreciation)).
- Jefferson County population projected at +13% by 2050 — modest demand growth; plan on rents tracking national, not racing it.
- At projected returns (10.0% appreciation + 0.5% rent growth), your $20k cash investment doubles in ~2 years — after that, you're playing with house money.
- By year 5, paydown + projected appreciation supports a ~$36k cash-out refi (75% LTV) — recoverable capital for the next deal without selling this one.
Negotiation context
- It's been on market 44 days — a 3% lower offer ($71k) is reasonable based on typical stale-listing flexibility.
Risks & watch-outs
- Watch-outs: flood insurance adds $66/mo; built in 1900 — expect roof / HVAC / electrical / plumbing capex.
- Climate carrying-cost: severe flood risk; extreme-heat days projected 7→20/yr by 2055 (HVAC capex compounding) — expect insurance premiums to compound above CPI over the hold.
Questions for the listing agent
- It's been on market 44 days. Have you received any prior offers? Is the seller open to a 3% concession, seller financing, or rate buy-down credit?
- Built in 1900 — when were the roof, HVAC, electrical panel, plumbing, and water heater last replaced?
- What's the actual annual flood-insurance premium (NFIP or private), and is the property in a SFHA with mandatory coverage?
- Is there a deadline driving the sale (1031 exchange, divorce, estate, relocation)? That informs how much negotiation room exists.
- Schools are D-rated, which usually means shorter tenancies and higher turnover. Who's the typical renter profile here, and what's been the actual vacancy rate?
- Crime grade is F in this area — have there been break-ins, vandalism, or insurance claims at this property in the last 3 years? What carrier currently insures it and at what premium?
- What's the average days-on-market for RENTAL listings here right now (not sales)? A rising rental-DOM trend means longer vacancies and softer asking-rent achievability than the comps imply.
- What's the recent tenant-quality profile in this submarket — average credit score on applications, eviction rate, late-payment / NSF rate, and stable-employment percentage? A property-management company in the area should have these aggregated.
- How much new for-sale + rental construction is in the pipeline within 1–3 miles? Heavy new supply typically softens prices + rents 12–24 months out; constrained supply supports both.
Investment metrics
- 1% rule
- 1.35% ✓
- Cap rate
- 10.75%
- Cash-on-cash
- 15.93%
- DSCR
- 1.71
- GRM
- 6.2
CMA / ARV
- ARV (on-the-fly)
- $59,400
- Comps found
- 12
Show comp detail 12 sales within ~0.75 mi
| Address | Dist | Beds/Ba | Sqft | Sold | Price | $/sf | Match |
|---|---|---|---|---|---|---|---|
| 3226 W Jefferson St | 0.43mi | 2/1.0 | 920 (+2%) | 6mo | $48,000 | $52 | 71 |
| 315 N 26th St | 0.37mi | 1/1.0 (-1) | 878 (-2%) | 7mo | $29,000 | $33 | 68 |
| 2722 Slevin St | 0.27mi | 2/1.0 | 984 (+9%) | 5mo | $65,000 | $66 | 67 |
| 2831 W Madison St | 0.63mi | 2/1.0 | 937 (+4%) | 1mo | $108,000 | $115 | 63 |
| 216 N 25th St | 0.48mi | 2/1.0 | 840 (-7%) | 6mo | $85,000 | $101 | 61 |
| 3425 Vermont Ave | 0.73mi | 2/1.0 | 912 (+1%) | 4mo | $36,500 | $40 | 61 |
| 363 N 27th St | 0.47mi | 2/1.0 | 972 (+8%) | 6mo | $36,500 | $38 | 60 |
| 331 N 23rd St | 0.71mi | 2/1.0 | 855 (-5%) | 4mo | $105,000 | $123 | 55 |
| 320 N 36th St | 0.54mi | 3/1.0 (+1) | 830 (-8%) | 3mo | $111,575 | $134 | 54 |
| 503 S 32nd St | 0.60mi | 2/1.0 | 832 (-8%) | 8mo | $35,000 | $42 | 53 |
| 2511 Bank St | 0.69mi | 2/1.0 | 960 (+7%) | 6mo | $10,000 | $10 | 51 |
| 3304 Bank St | 0.59mi | 2/1.0 | 1,020 (+13%) | 2mo | $131,000 | $128 | 49 |
Match score weights: distance 35% · size 25% · config 20% · recency 20%. Top-matched comps best support the ARV.
Projected returns pro-forma
10.0% appreciation · 0.51% rent growth · sell at horizon
- IRR
- 31.9%
- Equity multiple
- 3.47×
- Total profit
- $50,384
- Equity at exit
- $65,674
- IRR
- 26.7%
- Equity multiple
- 7.56×
- Total profit
- $133,855
- Equity at exit
- $141,629
Cash invested: $20,412 (down + closing). Projections, not guarantees.
Landlord ↔ Tenant lean methodology
- Overall (STATE)
- 83 Strongly Landlord-Friendly
- State Kentucky
- 83 Strongly Landlord-Friendly · R+16
- County
- — inherits STATE
- City
- — inherits STATE
ZIP-level market 40212
- Home prices YoY
- 11.0%
- Rents YoY
- 0.5%
- Active inventory
- 141
- Price-to-rent
- 6.2×
Monthly cashflow live
- Estimated rent
- $981 high interval (Pro) →
- Mortgage (P&I)
- −$382
- Tax est. 1.5%
- −$91 /mo · $1,094/yr
- Insurance
- −$30
- Flood insurance flood zone
- −$66 /mo · $798/yr
- HOA
- −$0
- Vacancy / Maint / Mgmt
- −$206
- Net cashflow
- $204
Break-even live
Sensitivity live
| Price | -10% $255 | -5% $230 | +0% $204 | +5% $179 | +10% $154 |
|---|---|---|---|---|---|
| Rent | -10% $127 | -5% $166 | +0% $204 | +5% $243 | +10% $282 |
| Rate | -1.0pp $241 | -0.5pp $223 | base $204 | +0.5pp $186 | +1.0pp $166 |
UW: 25.0% down · 7.5% · 30yr · 1.5% tax · 5.0% vac · 8.0% maint · 8.0% mgmt
Financing live
Cash to close
- Down payment
- $18,225
- Closing costs
- $2,187
- Reserves months
- —
- Total cash needed
- —
Loan-product check · same deal, 3 products live
Conventional
25% down · 7.5% · 30yr
- Down + closing
- —
- Monthly P&I
- —
- Monthly cashflow
- —
- DSCR
- —
- Eligible?
- —
Personal DTI + credit; lowest rate.
DSCR
20% down · 8.5% · 30yr
- Down + closing
- —
- Monthly P&I
- —
- Monthly cashflow
- —
- DSCR
- —
- Eligible?
- —
No personal income docs; deal must DSCR.
Hard money
10% down · 12.0% · 12mo
- Down + closing
- —
- Monthly P&I
- —
- Monthly cashflow
- —
- DSCR
- —
- Eligible?
- —
Short-term bridge; refi at stabilization.
Rent comps 40 comps
| Address | Beds | Baths | Sqft | Rent | $/sqft | DOM | Units | Dist |
|---|---|---|---|---|---|---|---|---|
| 2927 Rowan St Louisville, KY | 3.0 | 1.0 | 1008 | $1,205 | $1.20 | 13d | 1 | 0.06mi |
| 2925 Slevin St Louisville, KY | 2.0 | 1.0 | 896 | $775 | $0.86 | 5d | 1 | 0.20mi |
| 2717 Slevin St Louisville, KY | 1.0 | 1.0 | 620 | $725 | $1.17 | 17d | 1 | 0.31mi |
| 3416 W Main St Louisville, KY | 1.0 | 1.0 | 667 | $825 | $1.24 | 25d | 1 | 0.45mi |
| 353 N 27th St Louisville, KY | 2.0 | 1.0 | 1100 | $1,100 | $1.00 | 25d | 1 | 0.45mi |
| 2718 W Jefferson St Unit 2718-3 Louisville, KY | 1.0 | 1.0 | 633 | $699 | $1.10 | 25d | 1 | 0.47mi |
| 2718 W Jefferson St Louisville, KY | 1.0 | 1.0 | 633 | $699 | $1.10 | 23d | 1 | 0.47mi |
| 212 N 25th St Louisville, KY | 3.0 | 1.0 | 1104 | $895 | $0.81 | 25d | 1 | 0.50mi |
| 2614 W Jefferson St Louisville, KY | 1.0 | 1.0 | 633 | $695 | $1.10 | 21d | 1 | 0.51mi |
| 2614 W Jefferson St Unit 2614-4 Louisville, KY | 2.0 | 1.0 | 740 | $795 | $1.07 | 25d | 1 | 0.51mi |
| 320 N 36th St Louisville, KY | 3.0 | 1.0 | 830 | $1,225 | $1.48 | 17d | 1 | 0.53mi |
| 2433 Slevin St Unit 2433-2 Louisville, KY | 3.0 | 1.0 | 800 | $875 | $1.09 | 5d | 1 | 0.55mi |
| 2623 Cedar St Louisville, KY | 3.0 | 1.0 | 1000 | $1,000 | $1.00 | 25d | 1 | 0.56mi |
| 219 N 37th St Louisville, KY | 2.0 | 1.0 | 700 | $1,150 | $1.64 | 25d | 1 | 0.57mi |
| 3120 Bank St Unit B Louisville, KY | 2.0 | 1.0 | 750 | $795 | $1.06 | 25d | 1 | 0.57mi |
| 214 N 24th St Louisville, KY | 3.0 | 1.5 | 1012 | $915 | $0.90 | 25d | 1 | 0.58mi |
| 509 N 31st St Louisville, KY | 2.0 | 1.0 | 800 | $795 | $0.99 | 25d | 1 | 0.59mi |
| 509 N 31st St Louisville, KY | 2.0 | 1.0 | 800 | $725 | $0.91 | 17d | 1 | 0.59mi |
| 322 N 24th St Louisville, KY | 2.0 | 1.0 | 950 | $1,100 | $1.16 | 17d | 1 | 0.59mi |
| 522 N 29th St Louisville, KY | 3.0 | 1.0 | 1031 | $1,300 | $1.26 | 5d | 1 | 0.61mi |
| 103 N 38th St Apt 4 Louisville, KY | 1.0 | 1.0 | 625 | $950 | $1.52 | 18d | 1 | 0.62mi |
| 521 N 33rd St Louisville, KY | 1.0 | 1.0 | 650 | $795 | $1.22 | 25d | 1 | 0.65mi |
| 3124 Vermont Ave Unit 3124-1 Louisville, KY | 1.0 | 1.0 | 650 | $695 | $1.07 | 25d | 1 | 0.66mi |
| 3124 Vermont Ave Louisville, KY | 1.0 | 1.0 | 650 | $699 | $1.08 | 25d | 1 | 0.66mi |
| 2539 Bank St Unit 1 Louisville, KY | 1.0 | 1.0 | 900 | $750 | $0.83 | 25d | 1 | 0.66mi |
| 451 N 25th St Unit Mk Louisville, KY | 2.0 | 1.0 | 988 | $875 | $0.89 | 5d | 1 | 0.66mi |
| 111 Hansbrough Pl Unit 101 Louisville, KY | 1.0 | 1.0 | 686 | $890 | $1.30 | 25d | 1 | 0.69mi |
| 2631 W Madison St Unit 2 Louisville, KY | 2.0 | 1.0 | 928 | $850 | $0.92 | 18d | 1 | 0.70mi |
| 2631 W Madison St Unit 1 Louisville, KY | 3.0 | 1.0 | 928 | $950 | $1.02 | 25d | 1 | 0.70mi |
| 2631 W Madison St Unit 2 Louisville, KY | 2.0 | 1.0 | 928 | $850 | $0.92 | 25d | 1 | 0.70mi |
| 331 N 23rd St Louisville, KY | 2.0 | 1.0 | 855 | $1,150 | $1.35 | 18d | 1 | 0.71mi |
| 110 Hansbrough Pl Unit 101 Louisville, KY | 2.0 | 1.0 | 924 | $1,080 | $1.17 | 25d | 1 | 0.71mi |
| 2510 Portland Ave Unit 206 Louisville, KY | 2.0 | 1.0 | 615 | $950 | $1.54 | 25d | 1 | 0.73mi |
| 2510 Portland Ave Unit 203 Louisville, KY | 2.0 | 1.0 | 625 | $995 | $1.59 | 5d | 1 | 0.74mi |
| 3901 Jewell Ave Louisville, KY | 3.0 | 1.0 | 1069 | $1,140 | $1.07 | 21d | 1 | 0.76mi |
| 3421 River Park Dr Louisville, KY | 3.0 | 1.0 | 994 | $1,250 | $1.26 | 25d | 1 | 0.79mi |
| 2132 Rowan St Louisville, KY | 1.0–2.0 | 1.0–2.0 | 875 | $928 | $1.06 | 5d | 4 | 0.79mi |
| 2506 Montgomery St Louisville, KY | 3.0 | 2.0 | 1081 | $1,295 | $1.20 | 5d | 4 | 0.79mi |
| 3910 Garfield Ave Louisville, KY | 2.0 | 1.0 | 872 | $1,035 | $1.19 | 5d | 1 | 0.81mi |
| 220 Doctor W. J. Hodge St Unit 1 Louisville, KY | 1.0 | 1.0 | 570 | $700 | $1.23 | 18d | 1 | 0.92mi |
Listing history 15 events
-
2026-06-21days on market $72,900 Active 44 DOM
-
2026-06-18days on market $72,900 Active 41 DOM
-
2026-06-17days on market $72,900 Active 40 DOM
-
2026-06-16days on market $72,900 Active 39 DOM
-
2026-06-15days on market $72,900 Active 38 DOM
-
2026-06-13pricedays on market $72,900 Active 36 DOM
-
2026-06-10days on market $74,900 Active 33 DOM
-
2026-06-09days on market $74,900 Active 32 DOM
-
2026-06-08days on market $74,900 Active 31 DOM
-
2026-06-07days on market $74,900 Active 30 DOM
-
2026-06-03days on market $74,900 Active 26 DOM
-
2026-06-02days on market $74,900 Active 25 DOM
-
2026-06-01days on market $74,900 Active 24 DOM
-
2026-05-31days on market $74,900 Active 23 DOM
-
2026-05-07$74,900 Active
ⓘ Source: listings_history table (triggers on properties + properties_extension) + one-shot
backfill from property_details.listing_events for pre-trigger history.
Climate risk First Street
- Flood 8/10 Severe FEMA zone X (unshaded) · 99% chance over 30 yrs
- Wildfire 1/10 Low
- Heat 5/10 Major 7 d/yr ≥105°F today · 20 d/yr by 30 yrs out
- Wind 2/10 Low 100% chance of damaging wind over 30 yrs
- Air quality 2/10 Low 1 unhealthy d/yr today · 2 by 30 yrs out
Nearby sold comps map
Loading sold comps map…
Walkable amenities ~0.75 mi
Loading nearby amenities…
Taxation est. · year 1
- Rental income
- $11,768
- − Mortgage interest
- −$4,084
- − Property taxes
- −$1,094
- − Insurance
- −$1,162
- − Repairs & maintenance
- −$941
- − Management
- −$941
- − Depreciation
- −$2,121
- Taxable income
- $1,425
- Est. tax owed @ 24.0%
- −$342
- After-tax cash flow
- $2,111/yr
For passive investors: Depreciation is non-cash, so a rental often shows a tax loss while cash-flowing — sheltering income. Rental losses are passive: they offset passive income freely, and up to $25,000/yr can offset ordinary (W-2) income if you actively participate and your MAGI is under $100k (phasing out to $0 by $150k); unused losses carry forward. On sale, claimed depreciation is recaptured at up to 25%, and gains may owe capital-gains tax (a 1031 exchange can defer both). Figures are a year-1 estimate at your 24.0% rate — not tax advice; consult a CPA.
Schools (NCES district)
- District
- Jefferson County
- NCES district ID
- 2102990
- Math proficiency
- 19% ▼ -17.00%
- Reading proficiency
- 35% ▼ -11.00%
- Median HH income
- $47,885
- Composite
- 23.45/100
- National rank
- #7884
- State rank
- #121 of 165 in KY
Livability — Louisville
- Score
- 63/100
- State rank
- #333
- US rank
- #15887
Category grades
Schools grade is shown separately in the Schools card above.
Census & demographics
- Census place
- Louisville, KY
- County
- Jefferson County · 790,184 people
- City population
- 769,292
- Metro
- Louisville/Jefferson County, KY-IN
- Population (ZIP)
- 14,661
- Household income
- $35,753
- Rent vs Own
- Severe rent burden
- 1148.0
Population outlook (Jefferson County) Hauer SSP2
- Today (2025)
- 823,112 people
- By 2030
- 849,343 · +3.2%
- By 2040
- 895,696 · +8.8%
- By 2050
- 933,630 · +13.4%
- By 2075
- 1,028,262 · +24.9%
- By 2100
- 1,072,675 · +30.3%
Race, ethnicity, and origin ACS 2023
- Neighborhood character
- Majority Black (60%)
- Race & ethnicity
- Black 60% White 37% Two or more races 2% Hispanic / Latino 1%
- Common ancestry
- Slovak 1% Lithuanian 1% Iranian 1%
- Foreign-born
- 1% · Canada
- Languages at home
- 98% English-only · Spanish 1%
Political lean MEDSL · Jefferson
- 2024 margin
- D (+16.6) · D 57.4% · R 40.9% · Other 1.7%
- 2008→2024 swing
- +4.5pp toward D · 2008: 12.0pp · 2024: 16.6pp
- All cycles
- 2024: D+16.6 2020: D+20.1 2016: D+13.3 2012: D+11.1 2008: D+12.0
Not yet ingested
- Civics
- —
Market trends
- HPI YoY
- ▲ 29.02%
- Current HPI
- 293.2624
- Rent YoY
- ▲ 0.51%
- Metro
- Louisville/Jefferson County, KY-IN
- State GDP YoY
- ▲ 1.81%
- F500 in state
- 4
Industry mix (Fortune 500 HQ in KY)
| Industry | F500 HQs | Revenue |
|---|---|---|
| Healthcare | 1 | $118B |
|
||
| Food / Beverage | 1 | $7B |
|
||
Price history
1 event — show timeline
- 2026-05-07 Listed $74,900 Metro Search MLS
Property tax history
-4.3%/yrLatest (2024): $13 · -4.3% YoY. Source: county tax records.
Cash-flow waterfall
monthlySold comps — $/sqft
last 12 mo · ≤1 miLoading sold comps…