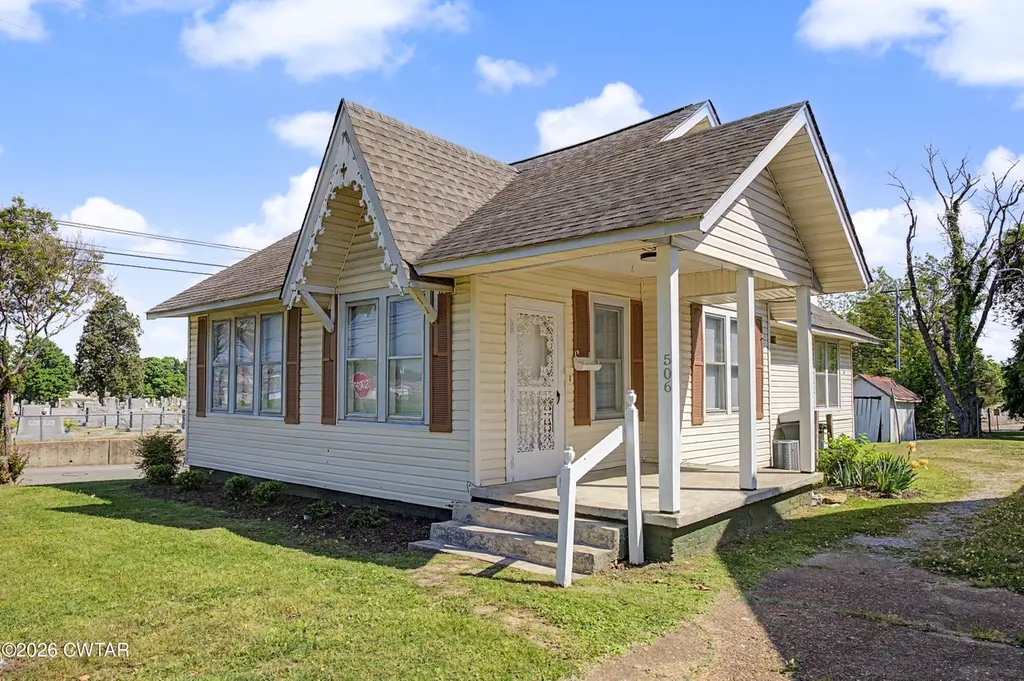
506 Margin St · Brownsville, TN
Flood risk 1/10 · Minimal
- FEMA flood zone
- X (unshaded)
- Chance of flooding over 30 yrs
- 0.0%
- Est. flood insurance / yr
- $507 – $1,088
Fire risk 1/10 · Minimal
- Est. fire insurance / yr
- $949 – $1,763
Heat risk 6/10 · Moderate
- Hot days now (above 108°F)
- 7 days/yr
- Hot days in 30 yrs
- 21 days/yr
Wind risk 4/10 · Minor
- Chance of severe wind over 30 yrs
- 13.0%
Air-quality risk 1/10 · Minimal
- Unhealthy air days now
- 0 days/yr
- Unhealthy air days in 30 yrs
- 0 days/yr
Risk factors via First Street. Map © Google.
Why this score? — see what drove the D grade
The composite is a weighted blend of 9 inputs, each scored 0–100. Each bar is that input's sub-score; the figure is the points it added to the 100-point composite (weight × sub-score).
- Cash flow +22.8/30.0
- DSCR +7.3/10.0
- 1% rule +4.9/10.0
- Livability +2.7/5.0
- Rent growth +2.5/5.0
- Condition / age +2.5/5.0
- Schools +0.6/10.0
- ARV discount +0.0/15.0
- Appreciation +0.0/10.0
$115,990
🖨 Deal sheet (PDF) 📄 Offer letter ✓ Due diligence
Listing remarks MLS
Step into this beautifully updated cottage that blends timeless charm with fresh modern touches! Just minutes from downtown Brownsville, this 2-bedroom, 1-bath home is move-in ready and full of character. Recent updates include fresh interior paint, new appliances, stylish new fixtures, and beautifully refinished hardwood floors. Large windows flood the space with natural light, while the classic architectural details—like the decorative front gable—add curb appeal that's hard to miss. Enjoy a spacious yard, a cozy covered front porch, and a layout perfect for first-time buyers, downsizers, or investors.
Key facts
- Stylish new fixtures
- Large windows
- Updated cottage
Tags
Neighborhood map
What this means for you Summary
Snapshot
- This is a 2-bed/1.0-bath single-family listed at $116k.
Deal economics
- At list price, monthly cash flow is $201 ($2k/yr) — positive.
- The deal already cash-flows at list — no discount required.
- To meet the 1% rule (rent ≥ 1% of price), the offer needs to be $115k (1.0% below list).
- Recommended offer: $102k (12.0% below list) — sets the bar for market timing.
- Cap rate 8.4% vs local median 3.8% in Brownsville — top-decile yield for the area; either an underpriced asset or a hidden risk that comps aren't pricing in. Stress-test before assuming the spread holds.
Location & tenants
- Location reads 54/100 on livability (#374 in TN) — a working-class tenant base; expect higher turnover. Strengths: cost of living A+, health & safety A+, housing A-; Watch: crime F, amenities F, commute F.
- Haywood County (town): math 4% / reading 10% proficiency, ranked #137 of 139 in TN (top 99%) — low school quality limits family demand, transient renter base, plan for 1-2y turnover; 68% free/reduced lunch — lower-income household profile, screen leases tightly.
- Zoned schools: Anderson Early Childhood (384 students, 0% FRL); Haywood Middle School (math 6% / reading 7%, grade F, #284 of 333 statewide, top 86%, 365 students, 0% FRL); Haywood High School (math 2% / reading 14%, grade F, #288 of 332 statewide, top 87%, 820 students, 0% FRL) — zoned schools average 0% FRL vs 68% district-wide (68 pts lower); this property's tenant base skews higher-income than the district average.
- Market conditions: 102 active listings in the ZIP; 16 comparable units currently listed for rent nearby; rentals lingering (median 46d on market — plan ~5-8 weeks vacancy on turnover, expect pricing pressure); 100% of comp listings sitting > 30 days — soft ceiling on asking rent; 22 units permitted in Haywood County in 2024 (0 in 5+ unit buildings).
Forward outlook
- Local home prices are declining (-3.0%/yr); year-one equity from $802 of loan paydown is wiped out by about $3k of value loss. Plan a longer hold.
- Haywood County population projected at -29% by 2050 — secular population decline; favor cash flow + early exit over multi-decade hold.
Negotiation context
- It's been on market 366 days — a 12% lower offer ($102k) is reasonable based on typical stale-listing flexibility.
- 2 sale attempts since 5y ago; this cycle's ask has dropped $13k (10%) from the opening price — seller is motivated, your offer sets the floor, not the list.
- Current owner paid $65k; list at $116k implies a 78% gain — meaningful room to come down on a strong offer.
Risks & watch-outs
- Watch-outs: built in 1942 — expect roof / HVAC / electrical / plumbing capex.
- Climate carrying-cost: extreme-heat days projected 7→21/yr by 2055 (HVAC capex compounding) — expect insurance premiums to compound above CPI over the hold.
Questions for the listing agent
- It's been on market 366 days. Have you received any prior offers? Is the seller open to a 12% concession, seller financing, or rate buy-down credit?
- Built in 1942 — when were the roof, HVAC, electrical panel, plumbing, and water heater last replaced?
- Why hasn't it sold? Are there any deal-killer items the seller is aware of (foundation, flood, title, zoning, code violations)?
- Is there a deadline driving the sale (1031 exchange, divorce, estate, relocation)? That informs how much negotiation room exists.
- Schools are F-rated, which usually means shorter tenancies and higher turnover. Who's the typical renter profile here, and what's been the actual vacancy rate?
- Crime grade is F in this area — have there been break-ins, vandalism, or insurance claims at this property in the last 3 years? What carrier currently insures it and at what premium?
- The area grade is low — what's the realistic commute time and amenity access for the typical tenant pool here? Any planned neighborhood developments (good or bad) we should know about?
- What's the average days-on-market for RENTAL listings here right now (not sales)? A rising rental-DOM trend means longer vacancies and softer asking-rent achievability than the comps imply.
- What's the recent tenant-quality profile in this submarket — average credit score on applications, eviction rate, late-payment / NSF rate, and stable-employment percentage? A property-management company in the area should have these aggregated.
- How much new for-sale + rental construction is in the pipeline within 1–3 miles? Heavy new supply typically softens prices + rents 12–24 months out; constrained supply supports both.
Investment metrics
- 1% rule
- 0.99% ✗
- Cap rate
- 8.37%
- Cash-on-cash
- 7.43%
- DSCR
- 1.33
- GRM
- 8.4
CMA / ARV
- ARV (median comp)
- $84,383
- List price
- $115,990
- Delta
- 37.46%
- Verdict
- OVERPRICED
- Comps
- 20 within 1.0 mi
Show comp detail 7 sales within ~0.75 mi
| Address | Dist | Beds/Ba | Sqft | Sold | Price | $/sf | Match |
|---|---|---|---|---|---|---|---|
| 407 S Washington Ave | 0.42mi | 3/2.0 (+1) | 1,065 (-1%) | 7mo | $84,000 | $79 | 63 |
| 318 E Jefferson St | 0.61mi | 3/1.0 (+1) | 1,032 (-4%) | 16mo | $15,000 | $15 | 46 |
| 108 W Sunset Cir | 0.56mi | 3/1.0 (+1) | 1,134 (+5%) | 17mo | $150,000 | $132 | 46 |
| 13 W Cooper St | 0.64mi | 2/1.0 | 1,006 (-7%) | 23mo | $98,000 | $97 | 40 |
| 833 Hatchie St | 0.73mi | 3/1.0 (+1) | 1,212 (+12%) | 2mo | $179,000 | $148 | 39 |
| 730 Key Corner St | 0.48mi | 3/1.0 (+1) | 1,215 (+12%) | 22mo | $201,000 | $165 | 34 |
| 309 Bellanti Cir | 0.73mi | 3/1.5 (+1) | 1,220 (+13%) | 7mo | $84,000 | $69 | 32 |
Match score weights: distance 35% · size 25% · config 20% · recency 20%. Top-matched comps best support the ARV.
Projected returns pro-forma
-3.0% appreciation · 3.0% rent growth · sell at horizon
- IRR
- -5.0%
- Equity multiple
- 0.81×
- Total profit
- $-6,030
- Equity at exit
- $17,294
- IRR
- 4.7%
- Equity multiple
- 1.34×
- Total profit
- $11,073
- Equity at exit
- $10,029
Cash invested: $32,477 (down + closing). Projections, not guarantees.
Landlord ↔ Tenant lean methodology
- Overall (STATE)
- 87 Strongly Landlord-Friendly
- State Tennessee
- 87 Strongly Landlord-Friendly · R+13
- County
- — inherits STATE
- City
- — inherits STATE
ZIP-level market 38012
- Home prices YoY
- -17.6%
- Active inventory
- 102
- Price-to-rent
- 8.4×
Monthly cashflow live
- Estimated rent
- $1,148 high interval (Pro) →
- Mortgage (P&I)
- −$608
- Tax from tax record
- −$50 /mo · $596/yr
- Insurance
- −$48
- HOA
- −$0
- Lot rent
- −$0
- Vacancy / Maint / Mgmt
- −$241
- Net cashflow
- $201
Break-even live
Sensitivity live
| Price | -10% $267 | -5% $234 | +0% $201 | +5% $168 | +10% $135 |
|---|---|---|---|---|---|
| Rent | -10% $110 | -5% $156 | +0% $201 | +5% $246 | +10% $292 |
| Rate | -1.0pp $259 | -0.5pp $231 | base $201 | +0.5pp $171 | +1.0pp $140 |
UW: 25.0% down · 7.5% · 30yr · 1.5% tax · 5.0% vac · 8.0% maint · 8.0% mgmt
Financing live
Cash to close
- Down payment
- $28,998
- Closing costs
- $3,480
- Reserves months
- —
- Total cash needed
- —
Loan-product check · same deal, 3 products live
Conventional
25% down · 7.5% · 30yr
- Down + closing
- —
- Monthly P&I
- —
- Monthly cashflow
- —
- DSCR
- —
- Eligible?
- —
Personal DTI + credit; lowest rate.
DSCR
20% down · 8.5% · 30yr
- Down + closing
- —
- Monthly P&I
- —
- Monthly cashflow
- —
- DSCR
- —
- Eligible?
- —
No personal income docs; deal must DSCR.
Hard money
10% down · 12.0% · 12mo
- Down + closing
- —
- Monthly P&I
- —
- Monthly cashflow
- —
- DSCR
- —
- Eligible?
- —
Short-term bridge; refi at stabilization.
Rent comps 16 comps
| Address | Beds | Baths | Sqft | Rent | $/sqft | DOM | Units | Dist |
|---|---|---|---|---|---|---|---|---|
| 105 S McLemore Ave Unit 1 Brownsville, TN | 1.0 | 1.0 | 1000 | $2,300 | $2.30 | 46d | 1 | 0.05mi |
| 105 S McLemore Ave Unit 2 Brownsville, TN | 2.0 | 1.0 | 1000 | $1,275 | $1.27 | 46d | 1 | 0.06mi |
| 216 N Russell Ave Brownsville, TN | 2.0 | 1.0 | 1350 | $1,250 | $0.93 | 46d | 1 | 0.38mi |
| 32 N Lafayette Ave Brownsville, TN | 2.0 | 2.0 | 1444 | $1,500 | $1.04 | 46d | 1 | 0.39mi |
| 212 N Washington Ave Unit 6 Brownsville, TN | 2.0 | 1.0 | 763 | $950 | $1.25 | 46d | 1 | 0.50mi |
| 229 N Church Ave Apt 2 Brownsville, TN | 2.0 | 2.0 | 1250 | $1,100 | $0.88 | 46d | 1 | 0.60mi |
| 114 Holly Cv Brownsville, TN | 3.0 | 1.0 | 948 | $900 | $0.95 | 46d | 1 | 0.61mi |
| 812 N McLemore Ave Unit C812 Brownsville, TN | 2.0 | 1.0 | 858 | $750 | $0.87 | 46d | 1 | 0.68mi |
| 1154 S Washington Ave Brownsville, TN | 2.0 | 1.0 | 855 | $950 | $1.11 | 46d | 1 | 0.85mi |
| 1021 N Lafayette Ave Brownsville, TN | 2.0 | 1.0 | 957 | $900 | $0.94 | 46d | 1 | 0.93mi |
| 610 Cottonwood Dr Brownsville, TN | 2.0 | 1.0 | 1100 | $1,200 | $1.09 | 46d | 1 | 1.02mi |
| 1142 Ferrell St Unit 1 Brownsville, TN | 2.0 | 1.0 | 728 | $675 | $0.93 | 46d | 1 | 1.09mi |
| 1317 Hatchie St Brownsville, TN | 2.0 | 1.0 | 860 | $1,150 | $1.34 | 46d | 1 | 1.11mi |
| 279 Easy Street Cv Unit 1 Brownsville, TN | 2.0 | 1.5 | 955 | $950 | $0.99 | 46d | 1 | 1.12mi |
| 504 Lark St Brownsville, TN | 3.0 | 1.0 | 1156 | $1,000 | $0.87 | 46d | 1 | 1.28mi |
| 489 Penny Ln Brownsville, TN | 2.0 | 1.0 | 1267 | $1,200 | $0.95 | 46d | 1 | 1.35mi |
Listing history 18 events
-
2026-06-15days on market $115,990 Active 366 DOM
-
2026-06-14days on market $115,990 Active 364 DOM
-
2026-06-13days on market $115,990 Active 363 DOM
-
2026-06-10days on market $115,990 Active 361 DOM
-
2026-06-09days on market $115,990 Active 360 DOM
-
2026-06-08days on market $115,990 Active 359 DOM
-
2026-06-07days on market $115,990 Active 358 DOM
-
2026-06-03days on market $115,990 Active 354 DOM
-
2026-06-02days on market $115,990 Active 353 DOM
-
2026-06-01days on market $115,990 Active 352 DOM
-
2026-05-31days on market $115,990 Active 351 DOM
-
2026-05-30days on market $115,990 Active 350 DOM
-
2026-05-05price $115,990 623-char remark
Show marketing remark (623 chars)
Step into this beautifully updated cottage that blends timeless charm with fresh modern touches! Just minutes from downtown Brownsville, this 2-bedroom, 1-bath home is move-in ready and full of character. Recent updates include fresh interior paint, new appliances, stylish new fixtures, and beautifully refinished hardwood floors. Large windows flood the space with natural light, while the classic architectural details—like the decorative front gable—add curb appeal that's hard to miss. Enjoy a spacious yard, a cozy covered front porch, and a layout perfect for first-time buyers, downsizers, or investors.
-
2025-08-11price $124,000 623-char remark
Show marketing remark (623 chars)
Step into this beautifully updated cottage that blends timeless charm with fresh modern touches! Just minutes from downtown Brownsville, this 2-bedroom, 1-bath home is move-in ready and full of character. Recent updates include fresh interior paint, new appliances, stylish new fixtures, and beautifully refinished hardwood floors. Large windows flood the space with natural light, while the classic architectural details—like the decorative front gable—add curb appeal that's hard to miss. Enjoy a spacious yard, a cozy covered front porch, and a layout perfect for first-time buyers, downsizers, or investors.
-
2025-06-13$129,000 Active 623-char remark
Show marketing remark (623 chars)
Step into this beautifully updated cottage that blends timeless charm with fresh modern touches! Just minutes from downtown Brownsville, this 2-bedroom, 1-bath home is move-in ready and full of character. Recent updates include fresh interior paint, new appliances, stylish new fixtures, and beautifully refinished hardwood floors. Large windows flood the space with natural light, while the classic architectural details—like the decorative front gable—add curb appeal that's hard to miss. Enjoy a spacious yard, a cozy covered front porch, and a layout perfect for first-time buyers, downsizers, or investors.
-
2021-11-05soldstatus $65,000 263-char remark
Show marketing remark (263 chars)
Charming 2 bedroom/1 bath home on large corner lot. Vintage built in china cabinet in dining room. Mostly original hardwood flooring and laminate vinyl tile. Generous sized bedrooms. The home has been very well maintained. Newer roof and HVAC have been installed.
-
2021-11-05soldstatus $65,000
Show marketing remark (263 chars)
Charming 2 bedroom/1 bath home on large corner lot. Vintage built in china cabinet in dining room. Mostly original hardwood flooring and laminate vinyl tile. Generous sized bedrooms. The home has been very well maintained. Newer roof and HVAC have been installed.
-
2021-09-13$75,000 263-char remark
Show marketing remark (263 chars)
Charming 2 bedroom/1 bath home on large corner lot. Vintage built in china cabinet in dining room. Mostly original hardwood flooring and laminate vinyl tile. Generous sized bedrooms. The home has been very well maintained. Newer roof and HVAC have been installed.
ⓘ Source: listings_history table (triggers on properties + properties_extension) + one-shot
backfill from property_details.listing_events for pre-trigger history.
Tax reassessment forecast TN · Resets to sale price
- Current annual tax
- $596 · $50/mo
- Projected year-2 tax
- $824 · $69/mo
- Expected delta
- +$228/yr (+$19/mo · 38.3%)
ⓘ Screening estimate from a state-policy table — verify with the county assessor before closing.
Climate risk First Street
- Flood 1/10 Low FEMA zone X (unshaded) · 0% chance over 30 yrs
- Wildfire 1/10 Low
- Heat 6/10 Major 7 d/yr ≥108°F today · 21 d/yr by 30 yrs out
- Wind 4/10 Moderate 13% chance of damaging wind over 30 yrs
- Air quality 1/10 Low 0 unhealthy d/yr today · 0 by 30 yrs out
Nearby sold comps map
Loading sold comps map…
Walkable amenities ~0.75 mi
Loading nearby amenities…
Taxation est. · year 1
- Rental income
- $13,782
- − Mortgage interest
- −$6,497
- − Property taxes
- −$596
- − Insurance
- −$580
- − Repairs & maintenance
- −$1,103
- − Management
- −$1,103
- − Depreciation
- −$3,374
- Taxable income
- $530
- Est. tax owed @ 24.0%
- −$127
- After-tax cash flow
- $2,286/yr
For passive investors: Depreciation is non-cash, so a rental often shows a tax loss while cash-flowing — sheltering income. Rental losses are passive: they offset passive income freely, and up to $25,000/yr can offset ordinary (W-2) income if you actively participate and your MAGI is under $100k (phasing out to $0 by $150k); unused losses carry forward. On sale, claimed depreciation is recaptured at up to 25%, and gains may owe capital-gains tax (a 1031 exchange can defer both). Figures are a year-1 estimate at your 24.0% rate — not tax advice; consult a CPA.
Schools (NCES district)
- District
- Haywood County
- NCES district ID
- 4701770
- Math proficiency
- 4% ▼ -16.00%
- Reading proficiency
- 10% ▼ -10.00%
- Median HH income
- $34,095
- Composite
- 5.6/100
- National rank
- #10024
- State rank
- #137 of 139 in TN
Livability — Brownsville
- Score
- 54/100
- State rank
- #374
- US rank
- #23967
Category grades
Schools grade is shown separately in the Schools card above.
Census & demographics
- Census place
- Brownsville, TN
- City population
- 13,079
- Population (ZIP)
- 13,079
Population outlook (Haywood County) Hauer SSP2
- Today (2025)
- 16,649 people
- By 2030
- 15,733 · -5.5%
- By 2040
- 13,718 · -17.6%
- By 2050
- 11,876 · -28.7%
- By 2075
- 8,673 · -47.9%
- By 2100
- 7,001 · -57.9%
Race, ethnicity, and origin ACS 2023
- Neighborhood character
- Majority Black (59%)
- Race & ethnicity
- Black 59% White 35% Hispanic / Latino 4% Two or more races 2%
- Common ancestry
- Lithuanian 1% Italian 1% Slovak 1%
- Foreign-born
- 2% · Canada
- Languages at home
- 97% English-only · Spanish 2% Arabic 1%
Political lean MEDSL · Haywood
- 2024 margin
- Toss-up / Even · D 49.8% · R 49.4%
- 2008→2024 swing
- -20.9pp toward R · 2008: 21.3pp · 2024: 0.4pp
- All cycles
- 2024: D+0.4 2020: D+9.0 2016: D+10.2 2012: D+21.2 2008: D+21.3
Not yet ingested
- Civics
- —
Market trends
- HPI YoY
- ▼ -47.81%
- Current HPI
- 224.2645
- Rent YoY
- —
- Metro
- —
- State GDP YoY
- ▲ 2.78%
- F500 in state
- 22
Industry mix (Fortune 500 HQ in TN)
| Industry | F500 HQs | Revenue |
|---|---|---|
| Healthcare | 3 | $91B |
|
||
| Retail | 3 | $72B |
|
||
| Transportation / Logistics | 1 | $88B |
|
||
| Paper / Packaging | 1 | $19B |
|
||
| Insurance | 1 | $13B |
|
||
| Energy | 1 | $12B |
|
||
Price history
+54.7% since first listed6 events — show timeline
- 2026-05-05 Price Changed $115,990 CWTAR
- 2025-08-11 Price Changed $124,000 CWTAR
- 2025-06-13 Listed $129,000 CWTAR
- 2021-11-05 Sold (Public Records) $65,000 Public Records
- 2021-11-05 Sold (MLS) $65,000 CWTAR
- 2021-09-13 Listed $75,000 CWTAR
Property tax history
+5.6%/yrLatest (2025): $596 · +0.0% YoY. Source: county tax records.
Cash-flow waterfall
monthlySold comps — $/sqft
last 12 mo · ≤1 miLoading sold comps…