121 Valley Rd · Economy, PA
Flood risk 1/10 · Minimal
- FEMA flood zone
- X (unshaded)
- Chance of flooding over 30 yrs
- 0.0%
- Est. flood insurance / yr
- $473 – $860
Fire risk 1/10 · Minimal
- Est. fire insurance / yr
- $511 – $949
Heat risk 3/10 · Minor
- Hot days now (above 97°F)
- 7 days/yr
- Hot days in 30 yrs
- 17 days/yr
Wind risk 2/10 · Minimal
- Chance of severe wind over 30 yrs
- 0.0%
Air-quality risk 3/10 · Minor
- Unhealthy air days now
- 2 days/yr
- Unhealthy air days in 30 yrs
- 3 days/yr
Risk factors via First Street. Map © Google.
Why this score? — see what drove the D- grade
The composite is a weighted blend of 9 inputs, each scored 0–100. Each bar is that input's sub-score; the figure is the points it added to the 100-point composite (weight × sub-score).
- Cash flow +12.9/30.0
- ARV discount +7.5/15.0
- DSCR +3.9/10.0
- Livability +3.5/5.0
- 1% rule +3.2/10.0
- Schools +3.1/10.0
- Rent growth +2.5/5.0
- Condition / age +2.5/5.0
- Appreciation +0.0/10.0
$188,500
🖨 Deal sheet (PDF) 📄 Offer letter ✓ Due diligence
Listing remarks MLS
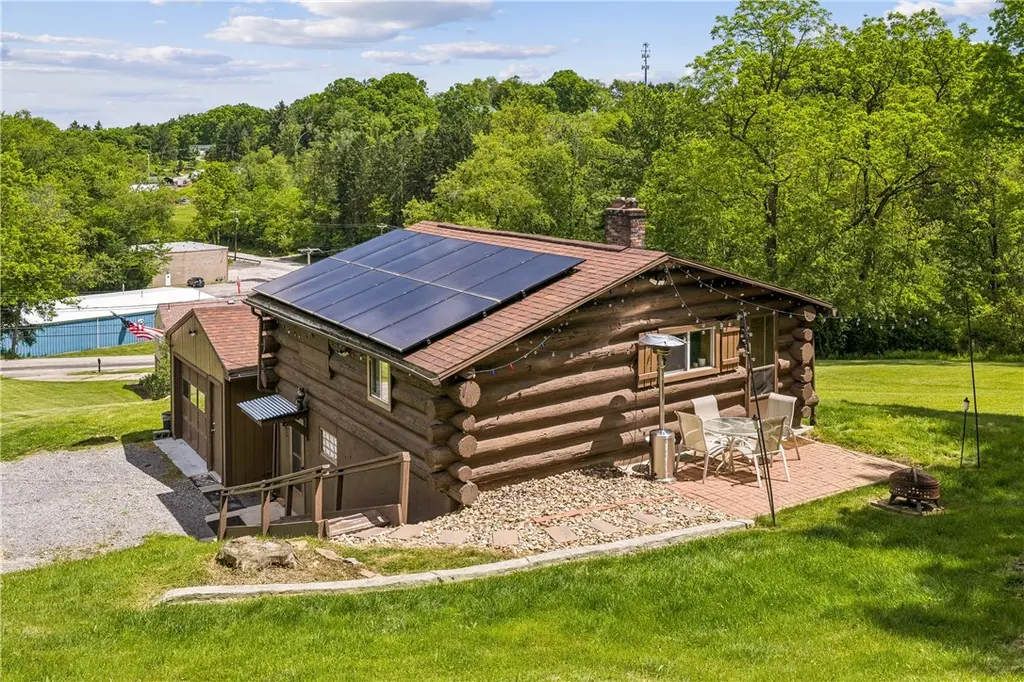
15 Minutes to Cranberry/Wexford or Interstate 79, 18 minutes to Sewickley or Route 65, comes your private log cabin nestled on an acre of land in Economy Boro. This house comes with a plethora of updates and a 1.5 stall detached garage. New bathroom, carpet/flooring, electrical, insulation, roof, 5 windows, and an exterior french drain ALL IN 2018. This place is move-in ready! Hot Water and Furnace just 7 years old. Live here and Get Paid - property has income from oil rights between $500-$1,000 per year! (EX: $855 in 2019).
Key facts
- Tree stand
- Wooded backyard
- Trail camera
Tags
Property features AI
Exterior
- Parking: Detached garage with garage door opener
- Utilities: Public water; Public sewer
- Home design: 2 stories; Resale property
- Construction: Asphalt roof
- Exterior features: Lot dimensions approximately 385 x 102 x 362 x 100
Interior
- Kitchen: Microwave; Refrigerator; Stove
- Flooring: Laminate; Carpet
- Bathrooms: 1 full bathroom
- Heating & cooling: Propane heating; Wall/window air conditioning units
- Interior features: Window treatments; Electric fireplace
- Laundry & utility: Washer; Dryer
Neighborhood map
What this means for you Summary
Snapshot
- This is a 2-bed/1.0-bath single-family listed at $188k.
Deal economics
- At list price, monthly cash flow is $-15 ($-177/yr) — negative.
- To cash-flow at today's rent, offer at most $186k (1.4% below list).
- To meet the 1% rule (rent ≥ 1% of price), the offer needs to be $155k (17.8% below list).
- Recommended offer: $155k (17.8% below list) — sets the bar for 1% rule.
- Cap rate 6.2% vs local median 2.8% in Economy — top-decile yield for the area; either an underpriced asset or a hidden risk that comps aren't pricing in. Stress-test before assuming the spread holds.
Location & tenants
- Location reads 69/100 on livability (#855 in PA) — a middle-class / working-renter tenant base. Strengths: crime A+, employment A+, cost of living A+; Watch: amenities F, commute F, health & safety F.
- Ambridge Area SD (suburban): math 23% / reading 48% proficiency, ranked #408 of 539 in PA (top 76%) — families likely to look elsewhere, expect single-tenant / working-renter base with shorter leases.
- Zoned schools: Economy El Sch (math 47% / reading 77%, grade B, #313 of 1,518 statewide, top 24%, 447 students, 100% FRL); Ambridge Area Ms (math 13% / reading 45%, grade F, #391 of 512 statewide, top 77%, 467 students, 99% FRL); Ambridge Area Hs (math 42% / reading 24%, grade F, #325 of 437 statewide, top 75%, 733 students, 92% FRL) — zoned schools average 97% FRL vs 43% district-wide (54 pts higher); higher-poverty schools than district average — tighter screening recommended.
- Market conditions: 138 active listings in the ZIP; high-income renter base; 272 units permitted in Beaver County in 2024 (80 in 5+ unit buildings).
- This rent is only 14% of the median local income ($133k/yr) — well below the 30% rent-burden line; pricing power to push rent on renewal without tenant pushback.
Forward outlook
- Local home prices are declining (-3.0%/yr); year-one equity from $1k of loan paydown is wiped out by about $6k of value loss. Plan a longer hold.
- Beaver County population projected at -14% by 2050 — secular population decline; favor cash flow + early exit over multi-decade hold.
Negotiation context
- Only 11 days on market — expect competitive offers; lowballing is unlikely to land.
- 2 sale attempts since 4y ago with the ask held roughly flat each time — persistent listings suggest the price (not the market) is what's stuck; bring a comps-based counter.
- Current owner paid $124k; list at $188k implies a 52% gain — meaningful room to come down on a strong offer.
Risks & watch-outs
- Watch-outs: built in 1940 — expect roof / HVAC / electrical / plumbing capex.
Questions for the listing agent
- What do current leases actually rent for vs. the listed asking? Can we see a recent rent roll and the last 12 months of T-12 income?
- Built in 1940 — when were the roof, HVAC, electrical panel, plumbing, and water heater last replaced?
- Is there a deadline driving the sale (1031 exchange, divorce, estate, relocation)? That informs how much negotiation room exists.
- Schools are D-rated, which usually means shorter tenancies and higher turnover. Who's the typical renter profile here, and what's been the actual vacancy rate?
- The area grade is low — what's the realistic commute time and amenity access for the typical tenant pool here? Any planned neighborhood developments (good or bad) we should know about?
- What's the average days-on-market for RENTAL listings here right now (not sales)? A rising rental-DOM trend means longer vacancies and softer asking-rent achievability than the comps imply.
- What's the recent tenant-quality profile in this submarket — average credit score on applications, eviction rate, late-payment / NSF rate, and stable-employment percentage? A property-management company in the area should have these aggregated.
- How much new for-sale + rental construction is in the pipeline within 1–3 miles? Heavy new supply typically softens prices + rents 12–24 months out; constrained supply supports both.
Investment metrics
- 1% rule
- 0.82% ✗
- Cap rate
- 6.20%
- Cash-on-cash
- -0.34%
- DSCR
- 0.99
- GRM
- 10.1
CMA / ARV
No comps found within radius.
Projected returns pro-forma
-3.0% appreciation · 3.0% rent growth · sell at horizon
- IRR
- -16.9%
- Equity multiple
- 0.40×
- Total profit
- $-31,501
- Equity at exit
- $28,106
- IRR
- -8.7%
- Equity multiple
- 0.46×
- Total profit
- $-28,706
- Equity at exit
- $16,298
Cash invested: $52,780 (down + closing). Projections, not guarantees.
Landlord ↔ Tenant lean methodology
- Overall (STATE)
- 62 Landlord-Friendly
- State Pennsylvania
- 62 Landlord-Friendly · EVEN
- County
- — inherits STATE
- City
- — inherits STATE
ZIP-level market 15143
- Active inventory
- 138
- Price-to-rent
- 10.1×
Monthly cashflow live
- Estimated rent
- $1,549 medium interval (Pro) →
- Mortgage (P&I)
- −$989
- Tax from tax record
- −$171 /mo · $2,058/yr
- Insurance
- −$79
- HOA
- −$0
- Lot rent
- −$0
- Vacancy / Maint / Mgmt
- −$325
- Net cashflow
- $-15
Break-even live
Sensitivity live
| Price | -10% $92 | -5% $39 | +0% $-15 | +5% $-68 | +10% $-121 |
|---|---|---|---|---|---|
| Rent | -10% $-137 | -5% $-76 | +0% $-15 | +5% $46 | +10% $108 |
| Rate | -1.0pp $80 | -0.5pp $33 | base $-15 | +0.5pp $-64 | +1.0pp $-113 |
UW: 25.0% down · 7.5% · 30yr · 1.5% tax · 5.0% vac · 8.0% maint · 8.0% mgmt
Financing live
Cash to close
- Down payment
- $47,125
- Closing costs
- $5,655
- Reserves months
- —
- Total cash needed
- —
Loan-product check · same deal, 3 products live
Conventional
25% down · 7.5% · 30yr
- Down + closing
- —
- Monthly P&I
- —
- Monthly cashflow
- —
- DSCR
- —
- Eligible?
- —
Personal DTI + credit; lowest rate.
DSCR
20% down · 8.5% · 30yr
- Down + closing
- —
- Monthly P&I
- —
- Monthly cashflow
- —
- DSCR
- —
- Eligible?
- —
No personal income docs; deal must DSCR.
Hard money
10% down · 12.0% · 12mo
- Down + closing
- —
- Monthly P&I
- —
- Monthly cashflow
- —
- DSCR
- —
- Eligible?
- —
Short-term bridge; refi at stabilization.
Listing history 9 events
-
2026-06-16status $188,500 Pending 11 DOM
-
2026-06-15days on market $188,500 Contingent 11 DOM
-
2026-06-13days on market $188,500 Contingent 9 DOM
-
2026-06-13days on market $188,500 Contingent 8 DOM
-
2026-06-09days on market $188,500 Contingent 5 DOM
-
2026-06-08days on market $188,500 Contingent 4 DOM
-
2026-06-08status $188,500 Contingent 3 DOM
-
2026-06-07remarks 699-char remark
-
2026-06-07$188,500 Active 3 DOM
ⓘ Source: listings_history table (triggers on properties + properties_extension) + one-shot
backfill from property_details.listing_events for pre-trigger history.
Tax reassessment forecast PA · Partial reset (capped growth)
- Current annual tax
- $2,058 · $171/mo
- Projected year-2 tax
- $2,518 · $210/mo
- Expected delta
- +$460/yr (+$38/mo · 22.4%)
ⓘ Screening estimate from a state-policy table — verify with the county assessor before closing.
Climate risk First Street
- Flood 1/10 Low FEMA zone X (unshaded) · 0% chance over 30 yrs
- Wildfire 1/10 Low
- Heat 3/10 Moderate 7 d/yr ≥97°F today · 17 d/yr by 30 yrs out
- Wind 2/10 Low 0% chance of damaging wind over 30 yrs
- Air quality 3/10 Moderate 2 unhealthy d/yr today · 3 by 30 yrs out
Nearby sold comps map
Loading sold comps map…
Walkable amenities ~0.75 mi
Loading nearby amenities…
Taxation est. · year 1
- Rental income
- $18,589
- − Mortgage interest
- −$10,559
- − Property taxes
- −$2,058
- − Insurance
- −$942
- − Repairs & maintenance
- −$1,487
- − Management
- −$1,487
- − Depreciation
- −$5,484
- Taxable loss
- −$3,428
- Est. tax savings @ 24.0%
- +$823
- After-tax cash flow
- $646/yr
For passive investors: Depreciation is non-cash, so a rental often shows a tax loss while cash-flowing — sheltering income. Rental losses are passive: they offset passive income freely, and up to $25,000/yr can offset ordinary (W-2) income if you actively participate and your MAGI is under $100k (phasing out to $0 by $150k); unused losses carry forward. On sale, claimed depreciation is recaptured at up to 25%, and gains may owe capital-gains tax (a 1031 exchange can defer both). Figures are a year-1 estimate at your 24.0% rate — not tax advice; consult a CPA.
Schools (NCES district)
- District
- Ambridge Area SD
- NCES district ID
- 4202440
- Math proficiency
- 23% ▼ -12.00%
- Reading proficiency
- 48% ▼ -10.00%
- Median HH income
- $49,514
- Composite
- 30.62/100
- National rank
- #6190
- State rank
- #408 of 539 in PA
Livability — Economy
- Score
- 69/100
- State rank
- #855
- US rank
- #8973
Category grades
Schools grade is shown separately in the Schools card above.
Census & demographics
- Census place
- Economy, PA
- County
- Allegheny County · 1,022,028 people
- City population
- 9,574
- Metro
- Pittsburgh, PA
- Population (ZIP)
- 21,851
- Household income
- $132,674
- Rent vs Own
- Severe rent burden
- 408.0
Population outlook (Beaver County) Hauer SSP2
- Today (2025)
- 164,976 people
- By 2030
- 161,449 · -2.1%
- By 2040
- 151,752 · -8.0%
- By 2050
- 141,155 · -14.4%
- By 2075
- 118,142 · -28.4%
- By 2100
- 91,740 · -44.4%
Race, ethnicity, and origin ACS 2023
- Neighborhood character
- Predominantly White (83%)
- Race & ethnicity
- White 83% Asian 8% Two or more races 4% Black 3% Hispanic / Latino 1%
- Common ancestry
- Romanian 6% Slovak 2% Italian 2%
- Foreign-born
- 8% · China, Canada
- Languages at home
- 90% English-only · Other Asian/Pacific 3% Other Indo-European 3% Chinese 1%
Political lean MEDSL · Beaver
- 2024 margin
- Strong R (+20.7) · D 39.2% · R 59.9%
- 2008→2024 swing
- -17.9pp toward R · 2008: -2.8pp · 2024: -20.7pp
- All cycles
- 2024: R+20.7 2020: R+17.7 2016: R+20.1 2012: R+6.6 2008: R+2.8
Not yet ingested
- Civics
- —
Market trends
- HPI YoY
- ▼ -209.16%
- Current HPI
- 262.7986
- Rent YoY
- —
- Metro
- Pittsburgh, PA
- State GDP YoY
- ▲ 1.68%
- F500 in state
- 34
Industry mix (Fortune 500 HQ in PA)
| Industry | F500 HQs | Revenue |
|---|---|---|
| Healthcare | 2 | $309B |
|
||
| Insurance | 2 | $27B |
|
||
| Telecommunications / Media | 1 | $124B |
|
||
| Industrial Distribution | 1 | $22B |
|
||
| Financial Services | 1 | $20B |
|
||
| Chemicals / Materials | 1 | $18B |
|
||
Price history
+3178.3% since first listed7 events — show timeline
- 2026-06-04 Listed $188,500 West Penn MLS
- 2022-07-01 Pending — West Penn MLS
- 2022-07-01 Sold (Public Records) $124,000 Public Records
- 2022-07-01 Sold (MLS) $124,000 West Penn MLS
- 2022-05-18 Contingent — West Penn MLS
- 2022-04-21 Listed $130,000 West Penn MLS
- 1955-07-01 Sold (Public Records) $5,750 Public Records
Property tax history
+4.9%/yrLatest (2026): $2,058 · +1.4% YoY. Source: county tax records.
Cash-flow waterfall
monthlySold comps — $/sqft
last 12 mo · ≤1 miLoading sold comps…