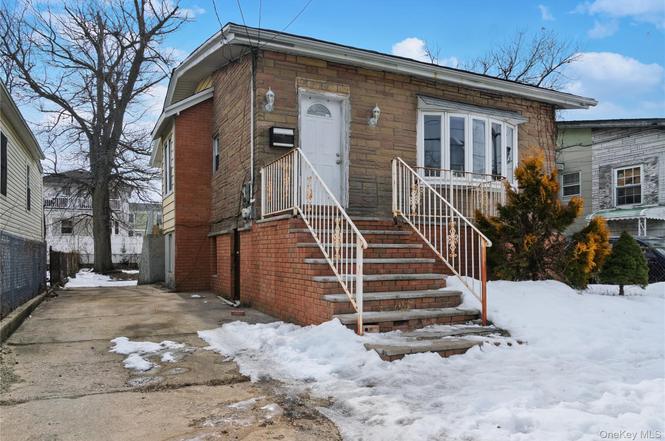
6529 Bayfield Ave · New York, NY
Flood risk 9/10 · Severe
- FEMA flood zone
- X (shaded)
- Chance of flooding over 30 yrs
- 0.99%
- Est. flood insurance / yr
- $507 – $1,088
Fire risk 1/10 · Minimal
- Est. fire insurance / yr
- $691 – $1,283
Heat risk 6/10 · Moderate
- Hot days now (above 96°F)
- 7 days/yr
- Hot days in 30 yrs
- 16 days/yr
Wind risk 6/10 · Moderate
- Chance of severe wind over 30 yrs
- 77.0%
Air-quality risk 3/10 · Minor
- Unhealthy air days now
- 4 days/yr
- Unhealthy air days in 30 yrs
- 4 days/yr
Risk factors via First Street. Map © Google.
Why this score? — see what drove the B+ grade
The composite is a weighted blend of 9 inputs, each scored 0–100. Each bar is that input's sub-score; the figure is the points it added to the 100-point composite (weight × sub-score).
- Cash flow +27.6/30.0
- Appreciation +10.0/10.0
- DSCR +9.7/10.0
- ARV discount +7.5/15.0
- 1% rule +7.2/10.0
- Schools +5.0/10.0
- Livability +3.8/5.0
- Rent growth +2.5/5.0
- Condition / age +2.5/5.0
$299,000
🖨 Deal sheet (PDF) 📄 Offer letter ✓ Due diligence
Listing remarks
Opportunity knocks at 6529 Bayfield Avenue. Set on a 40 × 100 lot, this 1,471 sq ft single-family home built in 1925 offers incredible potential for investors or end users looking to renovate and create their dream home. The property features a spacious footprint with a flexible layout, allowing the next owner to reimagine the interior to suit modern living. Whether you're an investor seeking your next value-add project or a homeowner ready to customize a space from the ground up, this home provides the perfect canvas. With solid bones, a generous lot size, and room to add your personal vision, the possibilities here are endless. A great opportunity to renovate, add value, and make th
Key facts
- Solid bones
- Generous lot size
- 4,000 sq ft lot
Tags
Property features AI
Exterior
- Parking: Driveway; On-street parking
- Utilities: Public sewer; Electricity connected; Natural gas connected; Sewer connected
- Home design: Single family residence
- Construction: Brick construction
- Exterior features: Brick construction; Not waterfront
Interior
- Kitchen: Range; Refrigerator
- Bathrooms: Two full bathrooms
- Heating & cooling: Forced air heating (natural gas); No central cooling listed
- Interior features: Finished full basement with storage space and walk-out access; Crawl attic; Five total rooms
Neighborhood map
What this means for you Summary
Snapshot
- This is a 3-bed/2.0-bath single-family listed at $299k.
Deal economics
- At list price, monthly cash flow is $825 ($10k/yr) — positive.
- The deal already cash-flows at list — no discount required.
- Meets the 1% rule at list price ($4k rent vs $299k).
- Recommended offer: $290k (3.0% below list) — sets the bar for market timing.
- Cap rate 9.9% vs local median 2.6% in New York — top-decile yield for the area; either an underpriced asset or a hidden risk that comps aren't pricing in. Stress-test before assuming the spread holds.
Location & tenants
- Location reads 75/100 on livability (#268 in NY, #4,188 nationally) — a middle-class / working-renter tenant base. Strengths: amenities A+, commute A+, health & safety A; Watch: crime F, cost of living F.
- Zoned schools: Elm Tree Elementary School (math 27% / reading 52%, grade F, #1,444 of 2,108 statewide, top 71%, 806 students, 94% FRL); Is 227 Louis Armstrong (math 52% / reading 69%, grade B+, #153 of 729 statewide, top 21%, 1,528 students, 68% FRL); Midwood High School (math 94% / reading 96%, grade A+, #83 of 1,100 statewide, top 8%, 4,062 students, 73% FRL).
- Market conditions: 80 active listings in the ZIP; 4 comparable units currently listed for rent nearby; rentals at typical pace (median 27d on market — plan ~3-4 weeks tenant-placement turnaround); 5,302 units permitted in Queens County in 2024 (4,918 in 5+ unit buildings).
- At $3,634/mo this rent would consume 88% of the median local household income ($50k/yr) (locally 1734% of renters already pay >50% of income on rent) — very limited rent-growth headroom before tenants either downsize or default.
Forward outlook
- In year one you build about $32k of equity ($2k loan paydown + $30k appreciation (10.0% local appreciation)).
- Queens County population projected at +16% by 2050 — long-run rental-demand tailwind backs the buy-and-hold thesis.
- At projected returns (10.0% appreciation + 3.0% rent growth), your $84k cash investment doubles in ~2 years — after that, you're playing with house money.
- By year 2, paydown + projected appreciation supports a ~$51k cash-out refi (75% LTV) — recoverable capital for the next deal without selling this one.
Negotiation context
- It's been on market 59 days — a 3% lower offer ($290k) is reasonable based on typical stale-listing flexibility.
- 4 sale attempts since 13y ago; this cycle's ask has dropped $100k (25%) from the opening price — seller is motivated, your offer sets the floor, not the list.
Risks & watch-outs
- Watch-outs: flood insurance adds $66/mo; built in 1925 — expect roof / HVAC / electrical / plumbing capex.
- Climate carrying-cost: severe flood risk; major wind risk, 77% chance of damaging wind over 30y; extreme-heat days projected 7→16/yr by 2055 (HVAC capex compounding) — expect insurance premiums to compound above CPI over the hold.
Questions for the listing agent
- It's been on market 59 days. Have you received any prior offers? Is the seller open to a 3% concession, seller financing, or rate buy-down credit?
- Built in 1925 — when were the roof, HVAC, electrical panel, plumbing, and water heater last replaced?
- What's the actual annual flood-insurance premium (NFIP or private), and is the property in a SFHA with mandatory coverage?
- Is there a deadline driving the sale (1031 exchange, divorce, estate, relocation)? That informs how much negotiation room exists.
- Schools are B-rated — typically a magnet for longer-tenancy family renters. What's the average tenant stay here, and is there a school-zone premium baked into asking?
- Crime grade is F in this area — have there been break-ins, vandalism, or insurance claims at this property in the last 3 years? What carrier currently insures it and at what premium?
- What's the average days-on-market for RENTAL listings here right now (not sales)? A rising rental-DOM trend means longer vacancies and softer asking-rent achievability than the comps imply.
- What's the recent tenant-quality profile in this submarket — average credit score on applications, eviction rate, late-payment / NSF rate, and stable-employment percentage? A property-management company in the area should have these aggregated.
- How much new for-sale + rental construction is in the pipeline within 1–3 miles? Heavy new supply typically softens prices + rents 12–24 months out; constrained supply supports both.
Investment metrics
- 1% rule
- 1.22% ✓
- Cap rate
- 9.87%
- Cash-on-cash
- 12.77%
- DSCR
- 1.57
- GRM
- 6.9
CMA / ARV
- ARV (on-the-fly)
- $629,588
- Comps found
- 4
Show comp detail 4 sales within ~0.75 mi
| Address | Dist | Beds/Ba | Sqft | Sold | Price | $/sf | Match |
|---|---|---|---|---|---|---|---|
| 627 Beach 65th St | 0.09mi | 3/2.0 | 1,530 (+4%) | 1mo | $577,000 | $377 | 88 |
| 439 Beach 69th St | 0.37mi | 3/2.5 | 1,530 (+4%) | 6mo | $600,000 | $392 | 68 |
| 64-07 Thursby Ave | 0.30mi | 3/2.0 | 1,402 (-5%) | 16mo | $600,000 | $428 | 65 |
| 516 Beach 72nd St | 0.35mi | 4/2.0 (+1) | 1,400 (-5%) | 10mo | $625,000 | $446 | 62 |
Match score weights: distance 35% · size 25% · config 20% · recency 20%. Top-matched comps best support the ARV.
Projected returns pro-forma
10.0% appreciation · 3.0% rent growth · sell at horizon
- IRR
- 33.0%
- Equity multiple
- 3.57×
- Total profit
- $215,413
- Equity at exit
- $269,363
- IRR
- 28.4%
- Equity multiple
- 8.08×
- Total profit
- $593,132
- Equity at exit
- $580,891
Cash invested: $83,720 (down + closing). Projections, not guarantees.
Landlord ↔ Tenant lean methodology
- Overall (CITY)
- 0 Strongly Tenant-Friendly
- State New York
- 15 Strongly Tenant-Friendly · D+10
- County
- — inherits STATE
- City New York
- 0 Strongly Tenant-Friendly · D+34
ZIP-level market 11692
- Home prices YoY
- 14.4%
- Active inventory
- 80
- Price-to-rent
- 6.9×
Monthly cashflow live
- Estimated rent
- $3,634 medium interval (Pro) →
- Mortgage (P&I)
- −$1,568
- Tax from tax record
- −$287 /mo · $3,444/yr
- Insurance
- −$125
- Flood insurance flood zone
- −$66 /mo · $798/yr
- HOA
- −$0
- Vacancy / Maint / Mgmt
- −$763
- Net cashflow
- $825
Break-even live
Sensitivity live
| Price | -10% $994 | -5% $909 | +0% $825 | +5% $740 | +10% $655 |
|---|---|---|---|---|---|
| Rent | -10% $538 | -5% $681 | +0% $825 | +5% $968 | +10% $1,112 |
| Rate | -1.0pp $975 | -0.5pp $901 | base $825 | +0.5pp $747 | +1.0pp $668 |
UW: 25.0% down · 7.5% · 30yr · 1.5% tax · 5.0% vac · 8.0% maint · 8.0% mgmt
Financing live
Cash to close
- Down payment
- $74,750
- Closing costs
- $8,970
- Reserves months
- —
- Total cash needed
- —
Loan-product check · same deal, 3 products live
Conventional
25% down · 7.5% · 30yr
- Down + closing
- —
- Monthly P&I
- —
- Monthly cashflow
- —
- DSCR
- —
- Eligible?
- —
Personal DTI + credit; lowest rate.
DSCR
20% down · 8.5% · 30yr
- Down + closing
- —
- Monthly P&I
- —
- Monthly cashflow
- —
- DSCR
- —
- Eligible?
- —
No personal income docs; deal must DSCR.
Hard money
10% down · 12.0% · 12mo
- Down + closing
- —
- Monthly P&I
- —
- Monthly cashflow
- —
- DSCR
- —
- Eligible?
- —
Short-term bridge; refi at stabilization.
Rent comps 4 comps
| Address | Beds | Baths | Sqft | Rent | $/sqft | DOM | Units | Dist |
|---|---|---|---|---|---|---|---|---|
| 6261 De Costa Ave Arverne, NY | 3.0 | 1.0 | 1117 | $3,250 | $2.91 | 6d | 1 | 0.18mi |
| 72-18 Elizabeth Ave Unit 2 Far Rockaway, NY | 3.0 | 2.0 | 1125 | $3,650 | $3.24 | 26d | 1 | 0.38mi |
| 6935 Hessler Ave Arverne, NY | 3.0 | 1.5 | 1596 | $3,300 | $2.07 | 26d | 1 | 0.40mi |
| 221 Beach 80th St Unit 1G Rockaway Beach, NY | 2.0 | 1.0 | 900 | $2,500 | $2.78 | 9d | 1 | 0.92mi |
Listing history 13 events
-
2026-05-07status Pending
-
2026-03-27price $299,000
-
2026-03-09$399,000 Active
-
2015-03-13soldstatus $325,000
-
2015-01-15historical
-
2014-09-02$349,000
-
2014-05-15soldstatus $115,000
-
2014-04-24soldstatus $115,000
-
2014-03-08$118,750
-
2014-03-04historical
-
2013-12-04$118,750
-
2006-03-17soldstatus $425,000
-
2005-10-07soldstatus $315,000
ⓘ Source: listings_history table (triggers on properties + properties_extension) + one-shot
backfill from property_details.listing_events for pre-trigger history.
Tax reassessment forecast NY · Partial reset (capped growth)
- Current annual tax
- $3,444 · $287/mo
- Projected year-2 tax
- $4,249 · $354/mo
- Expected delta
- +$804/yr (+$67/mo · 23.4%)
ⓘ Screening estimate from a state-policy table — verify with the county assessor before closing.
Climate risk First Street
- Flood 9/10 Extreme FEMA zone X (shaded) · 99% chance over 30 yrs
- Wildfire 1/10 Low
- Heat 6/10 Major 7 d/yr ≥96°F today · 16 d/yr by 30 yrs out
- Wind 6/10 Major 77% chance of damaging wind over 30 yrs
- Air quality 3/10 Moderate 4 unhealthy d/yr today · 4 by 30 yrs out
Nearby sold comps map
Loading sold comps map…
Walkable amenities ~0.75 mi
Loading nearby amenities…
Taxation est. · year 1
- Rental income
- $43,607
- − Mortgage interest
- −$16,749
- − Property taxes
- −$3,444
- − Insurance
- −$2,292
- − Repairs & maintenance
- −$3,489
- − Management
- −$3,489
- − Depreciation
- −$8,698
- Taxable income
- $5,446
- Est. tax owed @ 24.0%
- −$1,307
- After-tax cash flow
- $8,590/yr
For passive investors: Depreciation is non-cash, so a rental often shows a tax loss while cash-flowing — sheltering income. Rental losses are passive: they offset passive income freely, and up to $25,000/yr can offset ordinary (W-2) income if you actively participate and your MAGI is under $100k (phasing out to $0 by $150k); unused losses carry forward. On sale, claimed depreciation is recaptured at up to 25%, and gains may owe capital-gains tax (a 1031 exchange can defer both). Figures are a year-1 estimate at your 24.0% rate — not tax advice; consult a CPA.
Schools (NCES district)
No district data.
Livability — New York
- Score
- 75/100
- State rank
- #268
- US rank
- #4188
Category grades
Schools grade is shown separately in the Schools card above.
Census & demographics
- Census place
- New York, NY
- County
- Queens County · 1,914,869 people
- City population
- 7,731,280
- Metro
- New York-Newark-Jersey City, NY-NJ-PA
- Population (ZIP)
- 22,734
- Household income
- $49,720
- Rent vs Own
- Severe rent burden
- 1734.0
Population outlook (Queens County) Hauer SSP2
- Today (2025)
- 2,546,320 people
- By 2030
- 2,643,059 · +3.8%
- By 2040
- 2,815,563 · +10.6%
- By 2050
- 2,944,423 · +15.6%
- By 2075
- 3,123,338 · +22.7%
- By 2100
- 3,098,688 · +21.7%
Race, ethnicity, and origin ACS 2023
- Neighborhood character
- Diverse neighborhood (Simpson 0.64)
- Race & ethnicity
- Black 53% Hispanic / Latino 24% Two or more races 15% White 13% Asian 6%
- Hispanic origin (detail)
- Puerto Rican 10% Dominican 5%
- Common ancestry
- Romanian 1%
- Foreign-born
- 31% · Canada, China, Jamaica
- Languages at home
- 67% English-only · Spanish 18% Other Indo-European 3% Russian/Polish/Slavic 3%
Political lean MEDSL · Queens
- 2024 margin
- Strong D (+24.6) · D 62.3% · R 37.7%
- 2008→2024 swing
- -26.2pp toward R · 2008: 50.8pp · 2024: 24.6pp
- All cycles
- 2024: D+24.6 2020: D+45.2 2016: D+53.4 2012: D+58.5 2008: D+50.8
Not yet ingested
- Civics
- —
Market trends
- HPI YoY
- ▲ 44.49%
- Current HPI
- 354.2007
- Rent YoY
- —
- Metro
- New York-Newark-Jersey City, NY-NJ-PA
- State GDP YoY
- ▲ 2.60%
- F500 in state
- 92
Industry mix (Fortune 500 HQ in NY)
| Industry | F500 HQs | Revenue |
|---|---|---|
| Financial Services | 10 | $950B |
|
||
| Consumer Goods | 9 | $162B |
|
||
| Insurance | 4 | $225B |
|
||
| Telecommunications | 2 | $144B |
|
||
| Pharmaceuticals | 2 | $112B |
|
||
| Media / Entertainment | 2 | $69B |
|
||
Price history
-5.1% since first listed13 events — show timeline
- 2026-05-07 Pending — OneKey® MLS as Distributed by MLS Grid
- 2026-03-27 Price Changed $299,000 OneKey® MLS as Distributed by MLS Grid
- 2026-03-09 Listed $399,000 OneKey® MLS as Distributed by MLS Grid
- 2015-03-13 Sold (Public Records) $325,000 Public Records
- 2015-01-15 Listing Removed — OneKey® MLS as Distributed by MLS Grid
- 2014-09-02 Listed $349,000 OneKey® MLS as Distributed by MLS Grid
- 2014-05-15 Sold (Public Records) $115,000 Public Records
- 2014-04-24 Sold (MLS) $115,000 OneKey® MLS as Distributed by MLS Grid
- 2014-03-08 Listed $118,750 OneKey® MLS as Distributed by MLS Grid
- 2014-03-04 Listing Removed — OneKey® MLS as Distributed by MLS Grid
- 2013-12-04 Listed $118,750 OneKey® MLS as Distributed by MLS Grid
- 2006-03-17 Sold (Public Records) $425,000 Public Records
- 2005-10-07 Sold (Public Records) $315,000 Public Records
Property tax history
+4.9%/yrLatest (2025): $3,444 · +3.7% YoY. Source: county tax records.
Cash-flow waterfall
monthlySold comps — $/sqft
last 12 mo · ≤1 miLoading sold comps…