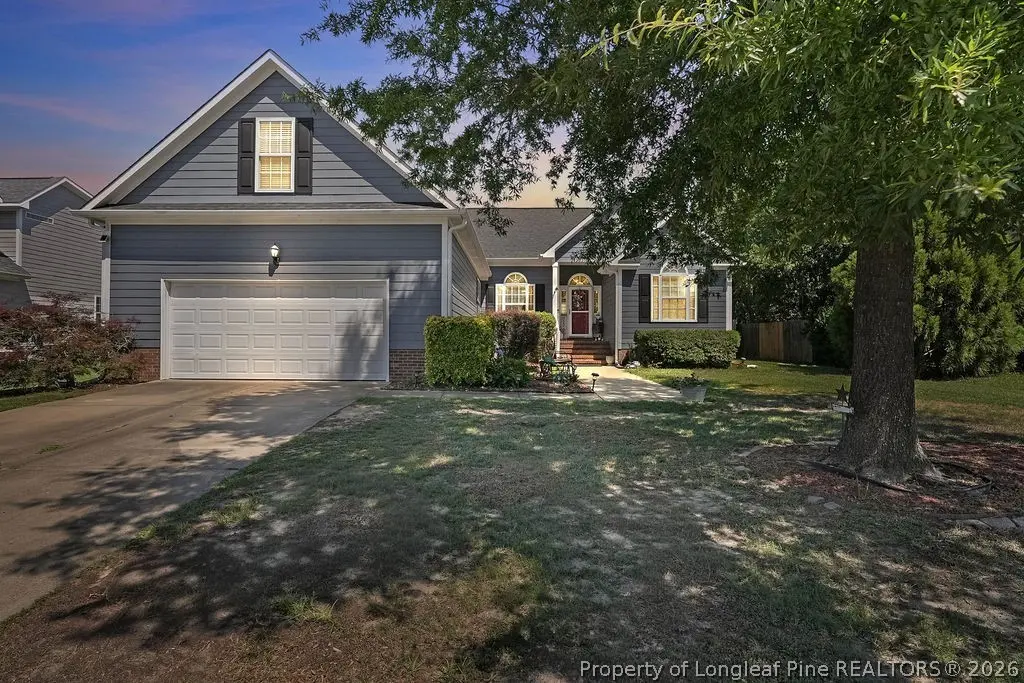
5952 Blue Sky Ln · Hope Mills, NC
Flood risk 1/10 · Minimal
- FEMA flood zone
- X (unshaded)
- Chance of flooding over 30 yrs
- 0.0%
- Est. flood insurance / yr
- $507 – $1,088
Fire risk 6/10 · Moderate
- Est. fire insurance / yr
- $906 – $1,684
Heat risk 8/10 · Major
- Hot days now (above 106°F)
- 7 days/yr
- Hot days in 30 yrs
- 17 days/yr
Wind risk 8/10 · Major
- Chance of severe wind over 30 yrs
- 80.0%
Air-quality risk 1/10 · Minimal
- Unhealthy air days now
- 0 days/yr
- Unhealthy air days in 30 yrs
- 0 days/yr
Risk factors via First Street. Map © Google.
Why this score? — see what drove the D- grade
The composite is a weighted blend of 9 inputs, each scored 0–100. Each bar is that input's sub-score; the figure is the points it added to the 100-point composite (weight × sub-score).
- Cash flow +11.6/30.0
- ARV discount +6.4/15.0
- Rent growth +3.6/5.0
- DSCR +3.4/10.0
- Livability +3.4/5.0
- Schools +3.1/10.0
- Condition / age +2.5/5.0
- 1% rule +2.4/10.0
- Appreciation +0.0/10.0
$314,900
🖨 Deal sheet 📄 Offer letter ✓ Due diligence
Listing remarks
This well-maintained 4-bedroom, 2-bath home offers 2032 square feet of comfortable living space and numerous recent upgrades. Enjoy professionally installed high-end LVP flooring (2025), a vinyl privacy fence (2025), Bluetooth-enabled bathroom exhaust fans, and a pre-wired storage building. The spacious floor plan features a cozy fireplace, generous bedrooms, and an owner's suite with large his-and-hers closets. Step outside to a private, fenced backyard complete with a gazebo and patio—perfect for relaxing or entertaining. Additional updates include roof shingles replaced in 2016, professionally painted downstairs interior and exterior (2020), and Stainmaster Pet Protect carpet in th
Key facts
- Gazebo
- Storage shed
- Patio
Tags
Property features AI
Finance
- Other: Located in the Bridlewood subdivision
Exterior
- Parking: Attached 2-car garage (2 covered spaces)
- Utilities: Public water; Public sewer; Propane service available
- Home design: Single family residence; Residential zoning (R10 - Residential District)
- Construction: Brick, fiber cement and vinyl siding exterior
- Exterior features: Therapeutic whirlpool (accessibility feature)
Interior
- Kitchen: Refrigerator; Dishwasher; Electric cooktop; Electric oven; Microwave; Stainless steel appliances
- Bedrooms: Total 6 rooms (bedroom count not specified)
- Flooring: Tile; Carpet; Vinyl
- Bathrooms: 2 full bathrooms
- Heating & cooling: Heat pump heating; Central air conditioning; Ceiling fans for added cooling
- Interior features: Tray ceilings; Ceiling fans; Built-in sound system (wired for sound); Gas/Propane fireplace in dining room
- Laundry & utility: Laundry on main level
Neighborhood map
What this means for you Summary
Snapshot
- This is a 4-bed/2.0-bath single-family listed at $315k.
Deal economics
- At list price, monthly cash flow is $-98 ($-1k/yr) — negative.
- To cash-flow at today's rent, offer at most $298k (5.5% below list).
- To meet the 1% rule (rent ≥ 1% of price), the offer needs to be $232k (26.3% below list).
- Recommended offer: $232k (26.3% below list) — sets the bar for 1% rule.
- Cap rate 5.9% vs local median 4.8% in Hope Mills — meaningfully above typical; check what's discounted (condition, days-on-market, listing class) to confirm the premium yield is real.
Location & tenants
- Location reads 67/100 on livability (#234 in NC) — a middle-class / working-renter tenant base. Strengths: cost of living A+, housing A+, health & safety B+; Watch: crime D-, amenities F, commute F.
- Cumberland County Schools (urban): math 32% / reading 41% proficiency, ranked #126 of 178 in NC (top 71%) — families likely to look elsewhere, expect single-tenant / working-renter base with shorter leases.
- Zoned schools: Gray'S Creek Middle (math 33% / reading 48%, grade F, #215 of 475 statewide, top 46%, 1,126 students, 50% FRL); Gray'S Creek High (math 61% / reading 58%, grade C+, #216 of 535 statewide, top 43%, 1,395 students, 44% FRL).
- Zoned-school proficiency averages 50% at this address vs 36% district-wide (+14 pts) — the actual schools serving this property are materially stronger than the Cumberland County Schools average implies; a family-tenant draw the district grade alone would hide.
- Market conditions: Rents rising fast (+4.3%/yr); 317 active listings in the ZIP; 2 comparable units currently listed for rent nearby; 1,125 units permitted in Cumberland County in 2024 (104 in 5+ unit buildings).
- This rent runs 42% of the median local income ($66k/yr) — at the standard rent-burdened threshold; future hikes will face affordability resistance.
Forward outlook
- Local home prices are declining (-3.0%/yr); year-one equity from $2k of loan paydown is wiped out by about $9k of value loss. Plan a longer hold.
Negotiation context
- Only 12 days on market — expect competitive offers; lowballing is unlikely to land.
- Current owner paid $115k; list at $315k implies a 174% gain — meaningful room to come down on a strong offer.
Risks & watch-outs
- Climate carrying-cost: severe wind risk, 80% chance of damaging wind over 30y; major wildfire risk; extreme-heat days projected 7→17/yr by 2055 (HVAC capex compounding) — expect insurance premiums to compound above CPI over the hold.
Questions for the listing agent
- What do current leases actually rent for vs. the listed asking? Can we see a recent rent roll and the last 12 months of T-12 income?
- Is there a deadline driving the sale (1031 exchange, divorce, estate, relocation)? That informs how much negotiation room exists.
- Schools are D-rated, which usually means shorter tenancies and higher turnover. Who's the typical renter profile here, and what's been the actual vacancy rate?
- Crime grade is D in this area — have there been break-ins, vandalism, or insurance claims at this property in the last 3 years? What carrier currently insures it and at what premium?
- The area grade is low — what's the realistic commute time and amenity access for the typical tenant pool here? Any planned neighborhood developments (good or bad) we should know about?
- What's the average days-on-market for RENTAL listings here right now (not sales)? A rising rental-DOM trend means longer vacancies and softer asking-rent achievability than the comps imply.
- What's the recent tenant-quality profile in this submarket — average credit score on applications, eviction rate, late-payment / NSF rate, and stable-employment percentage? A property-management company in the area should have these aggregated.
- How much new for-sale + rental construction is in the pipeline within 1–3 miles? Heavy new supply typically softens prices + rents 12–24 months out; constrained supply supports both.
Investment metrics
- 1% rule
- 0.74% ✗
- Cap rate
- 5.92%
- Cash-on-cash
- -1.33%
- DSCR
- 0.94
- GRM
- 11.3
CMA / ARV
- ARV (on-the-fly)
- $307,134
- Comps found
- 12
Show comp detail 12 sales within ~0.75 mi
| Address | Dist | Beds/Ba | Sqft | Sold | Price | $/sf | Match |
|---|---|---|---|---|---|---|---|
| 5713 Lady Way | 0.16mi | 3/2.5 (-1) | 2,013 (-1%) | 5mo | $280,000 | $139 | 79 |
| 5925 Blue Sky Ln | 0.11mi | 4/3.0 | 2,167 (+6%) | 2mo | $220,000 | $102 | 78 |
| 5904 Blue Sky Ln | 0.19mi | 4/2.5 | 2,136 (+5%) | 5mo | $300,000 | $140 | 77 |
| 1212 Thistle Gold Dr | 0.40mi | 4/2.5 | 2,061 (+1%) | 3mo | $320,000 | $155 | 75 |
| 1111 Thistle Gold Dr | 0.53mi | 4/2.0 | 2,003 (-2%) | 3mo | $279,000 | $139 | 70 |
| 1024 Greenhouse Dr | 0.43mi | 3/2.0 (-1) | 2,059 (+1%) | 5mo | $317,000 | $154 | 68 |
| 5845 Blue Sky Ln | 0.26mi | 3/2.5 (-1) | 2,121 (+4%) | 6mo | $320,000 | $151 | 68 |
| 5908 Gentleman Dr | 0.24mi | 3/2.0 (-1) | 2,201 (+8%) | 8mo | $310,000 | $141 | 64 |
| 5704 Gentleman Dr | 0.28mi | 3/3.0 (-1) | 2,232 (+10%) | 2mo | $353,000 | $158 | 60 |
| 5630 Prestonfield Ln | 0.51mi | 3/2.0 (-1) | 1,766 (-13%) | 7mo | $270,000 | $153 | 43 |
| 5609 Prestonfield Ln | 0.55mi | 3/2.5 (-1) | 1,778 (-13%) | 4mo | $295,000 | $166 | 43 |
| 1010 Kenan Dr | 0.45mi | 4/3.0 | 2,336 (+15%) | 11mo | $285,000 | $122 | 41 |
Match score weights: distance 35% · size 25% · config 20% · recency 20%. Top-matched comps best support the ARV.
Projected returns pro-forma
-3.0% appreciation · 4.28% rent growth · sell at horizon
- IRR
- -17.3%
- Equity multiple
- 0.38×
- Total profit
- $-54,360
- Equity at exit
- $46,953
- IRR
- -7.4%
- Equity multiple
- 0.51×
- Total profit
- $-43,099
- Equity at exit
- $27,227
Cash invested: $88,172 (down + closing). Projections, not guarantees.
Landlord ↔ Tenant lean methodology
- Overall (STATE)
- 85 Strongly Landlord-Friendly
- State North Carolina
- 85 Strongly Landlord-Friendly · R+3
- County
- — inherits STATE
- City
- — inherits STATE
ZIP-level market 28348
- Home prices YoY
- -14.0%
- Rents YoY
- 4.3%
- Active inventory
- 317
- Price-to-rent
- 11.3×
Monthly cashflow live
- Estimated rent
- $2,320 medium interval (Pro) →
- Mortgage (P&I)
- −$1,651
- Tax from tax record
- −$148 /mo · $1,779/yr
- Insurance
- −$131
- HOA
- −$0
- Vacancy / Maint / Mgmt
- −$487
- Net cashflow
- $-98
Break-even live
UW: 25.0% down · 7.5% · 30yr · 1.5% tax · 5.0% vac · 8.0% maint · 8.0% mgmt
Financing live
Cash to close
- Down payment
- $78,725
- Closing costs
- $9,447
- Reserves months
- —
- Total cash needed
- —
Loan-product check · same deal, 3 products live
Conventional
25% down · 7.5% · 30yr
- Down + closing
- —
- Monthly P&I
- —
- Monthly cashflow
- —
- DSCR
- —
- Eligible?
- —
Personal DTI + credit; lowest rate.
DSCR
20% down · 8.5% · 30yr
- Down + closing
- —
- Monthly P&I
- —
- Monthly cashflow
- —
- DSCR
- —
- Eligible?
- —
No personal income docs; deal must DSCR.
Hard money
10% down · 12.0% · 12mo
- Down + closing
- —
- Monthly P&I
- —
- Monthly cashflow
- —
- DSCR
- —
- Eligible?
- —
Short-term bridge; refi at stabilization.
Rent comps 2 comps
| Address | Beds | Baths | Sqft | Rent | $/sqft | DOM | Units | Dist |
|---|---|---|---|---|---|---|---|---|
| 5619 Walking Trail Way Hope Mills, NC | 4.0 | 3.0 | 2003 | $2,000 | $1.00 | 13d | 1 | 0.34mi |
| 1233 Screech Owl Dr Hope Mills, NC | 4.0 | 3.0 | 2260 | $2,150 | $0.95 | 23d | 1 | 1.44mi |
Listing history 13 events
-
2026-06-19status $314,900 Pending 12 DOM
-
2026-06-18days on market $314,900 Active 12 DOM
-
2026-06-17days on market $314,900 Active 11 DOM
-
2026-06-16days on market $314,900 Active 10 DOM
-
2026-06-15days on market $314,900 Active 9 DOM
-
2026-06-14days on market $314,900 Active 7 DOM
-
2026-06-13days on market $314,900 Active 6 DOM
-
2026-06-10days on market $314,900 Active 4 DOM
-
2026-06-09days on market $314,900 Active 3 DOM
-
2026-06-08remarks 693-char remark
-
2026-06-08days on market $314,900 Active 2 DOM
-
2026-06-07remarks 405-char remark
-
2026-06-07$314,900 Active 1 DOM
ⓘ Source: listings_history table (triggers on properties + properties_extension) + one-shot
backfill from property_details.listing_events for pre-trigger history.
Tax reassessment forecast NC · Resets to sale price
- Current annual tax
- $1,779 · $148/mo
- Projected year-2 tax
- $2,582 · $215/mo
- Expected delta
- +$803/yr (+$67/mo · 45.2%)
ⓘ Screening estimate from a state-policy table — verify with the county assessor before closing.
Climate risk First Street
- Flood 1/10 Low FEMA zone X (unshaded) · 0% chance over 30 yrs
- Wildfire 6/10 Major
- Heat 8/10 Severe 7 d/yr ≥106°F today · 17 d/yr by 30 yrs out
- Wind 8/10 Severe 80% chance of damaging wind over 30 yrs
- Air quality 1/10 Low 0 unhealthy d/yr today · 0 by 30 yrs out
Nearby sold comps map
Loading sold comps map…
Walkable amenities ~0.75 mi
Loading nearby amenities…
Taxation est. · year 1
- Rental income
- $27,840
- − Mortgage interest
- −$17,639
- − Property taxes
- −$1,779
- − Insurance
- −$1,574
- − Repairs & maintenance
- −$2,227
- − Management
- −$2,227
- − Depreciation
- −$9,161
- Taxable loss
- −$6,768
- Est. tax savings @ 24.0%
- +$1,624
- After-tax cash flow
- $448/yr
For passive investors: Depreciation is non-cash, so a rental often shows a tax loss while cash-flowing — sheltering income. Rental losses are passive: they offset passive income freely, and up to $25,000/yr can offset ordinary (W-2) income if you actively participate and your MAGI is under $100k (phasing out to $0 by $150k); unused losses carry forward. On sale, claimed depreciation is recaptured at up to 25%, and gains may owe capital-gains tax (a 1031 exchange can defer both). Figures are a year-1 estimate at your 24.0% rate — not tax advice; consult a CPA.
Schools (NCES district)
- District
- Cumberland County Schools
- NCES district ID
- 3700011
- Math proficiency
- 32% ▼ -2.00%
- Reading proficiency
- 41% ▼ -1.00%
- Median HH income
- $44,168
- Composite
- 31.0/100
- National rank
- #6096
- State rank
- #126 of 178 in NC
Livability — Hope Mills
- Score
- 67/100
- State rank
- #234
- US rank
- #10761
Category grades
Schools grade is shown separately in the Schools card above.
Census & demographics
- County
- Cumberland County · 265,314 people
- City population
- 39,196
- Metro
- Fayetteville, NC
- Population (ZIP)
- 39,196
- Household income
- $66,129
- Rent vs Own
- Severe rent burden
- 746.0
Population outlook (Cumberland County) Hauer SSP2
- Today (2025)
- 330,855 people
- By 2030
- 333,523 · +0.8%
- By 2040
- 335,583 · +1.4%
- By 2050
- 335,325 · +1.4%
- By 2075
- 342,853 · +3.6%
- By 2100
- 340,698 · +3.0%
Race, ethnicity, and origin ACS 2023
- Neighborhood character
- Diverse neighborhood (Simpson 0.67)
- Race & ethnicity
- White 49% Black 27% Hispanic / Latino 13% Two or more races 11% Asian 2% Native American 2%
- Hispanic origin (detail)
- Mexican 4% Puerto Rican 5%
- Common ancestry
- Romanian 2% Lithuanian 1% Serbian 1%
- Foreign-born
- 5% · Canada, South Korea, Vietnam
- Languages at home
- 90% English-only · Spanish 8% Other Indo-European 1%
Political lean MEDSL · Cumberland
- 2024 margin
- D (+13.4) · D 56.1% · R 42.7% · Other 1.2%
- 2008→2024 swing
- -4.3pp toward R · 2008: 17.7pp · 2024: 13.4pp
- All cycles
- 2024: D+13.4 2020: D+16.6 2016: D+16.0 2012: D+19.7 2008: D+17.7
Not yet ingested
- Civics
- —
Market trends
- HPI YoY
- ▼ -37.14%
- Current HPI
- 228.3122
- Rent YoY
- ▲ 4.28%
- Metro
- Fayetteville, NC
- State GDP YoY
- ▲ 3.28%
- F500 in state
- 26
Industry mix (Fortune 500 HQ in NC)
| Industry | F500 HQs | Revenue |
|---|---|---|
| Financial Services | 2 | $213B |
|
||
| Retail | 2 | $95B |
|
||
| Industrial Conglomerate | 1 | $38B |
|
||
| Metals / Steel | 1 | $35B |
|
||
| Utilities | 1 | $30B |
|
||
| Industrial Machinery | 1 | $19B |
|
||
Price history
+173.8% since first listed2 events — show timeline
- 2026-06-05 Listed $314,900 LPRMLS
- 2006-12-04 Sold (Public Records) $115,000 Public Records
Property tax history
+0.4%/yrLatest (2025): $1,779 · +0.7% YoY. Source: county tax records.
Cash-flow waterfall
monthlySold comps — $/sqft
last 12 mo · ≤1 miLoading sold comps…