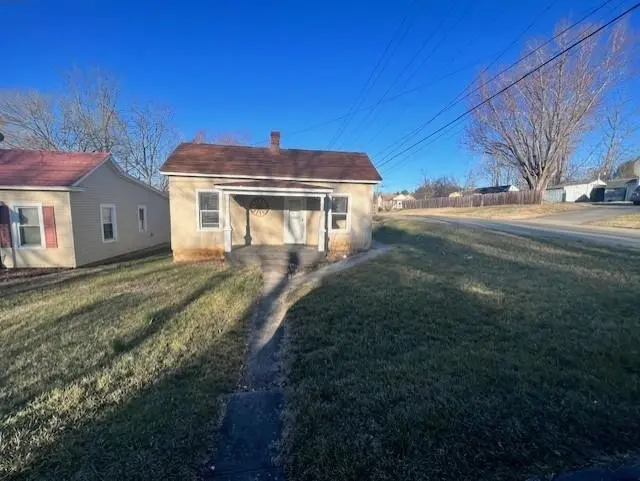
1501 3rd St · Radford, VA
Flood risk 1/10 · Minimal
- FEMA flood zone
- X (unshaded)
- Chance of flooding over 30 yrs
- 0.0%
- Est. flood insurance / yr
- $507 – $1,088
Fire risk 2/10 · Minimal
- Est. fire insurance / yr
- $666 – $1,236
Heat risk 4/10 · Minor
- Hot days now (above 96°F)
- 7 days/yr
- Hot days in 30 yrs
- 22 days/yr
Wind risk 2/10 · Minimal
- Chance of severe wind over 30 yrs
- 0.0%
Air-quality risk 1/10 · Minimal
- Unhealthy air days now
- 0 days/yr
- Unhealthy air days in 30 yrs
- 0 days/yr
Risk factors via First Street. Map © Google.
Why this score? — see what drove the C+ grade
The composite is a weighted blend of 9 inputs, each scored 0–100. Each bar is that input's sub-score; the figure is the points it added to the 100-point composite (weight × sub-score).
- Cash flow +19.8/30.0
- ARV discount +15.0/15.0
- DSCR +6.3/10.0
- Schools +5.9/10.0
- 1% rule +4.2/10.0
- Rent growth +4.2/5.0
- Livability +3.4/5.0
- Condition / age +2.5/5.0
- Appreciation +0.0/10.0
$169,000
🖨 Deal sheet 📄 Offer letter ✓ Due diligence
Listing remarks MLS
Charming 4-bedroom, 1-bath home in the heart of Radford featuring central air with efficient gas heat and washer/dryer hookups for added convenience. This home offers a functional layout with spacious bedrooms and great natural light throughout. Several appliances are newer, making the property move-in ready with room to add your own personal touches. The level lot provides easy maintenance and outdoor potential for gardening, pets, or play. Located close to Radford University, shopping, restaurants, and local schools, this home is ideal for homeowners or investors looking for reliable rental demand. An affordable opportunity in a convenient Radford location—don’t miss it! Some photos may include virtual staging for illustrative purposes.
Key facts
- Efficient gas heat
- Great natural light
- Newer appliances
Tags
Neighborhood map
What this means for you Summary
Snapshot
- This is a 4-bed/1.0-bath single-family listed at $169k.
Deal economics
- At list price, monthly cash flow is $201 ($2k/yr) — positive.
- The deal already cash-flows at list — no discount required.
- To meet the 1% rule (rent ≥ 1% of price), the offer needs to be $156k (7.7% below list).
- Recommended offer: $149k (12.0% below list) — sets the bar for market timing.
- Cap rate 7.7% vs local median 3.6% in Radford — top-decile yield for the area; either an underpriced asset or a hidden risk that comps aren't pricing in. Stress-test before assuming the spread holds.
Location & tenants
- Location reads 68/100 on livability (#269 in VA) — a middle-class / working-renter tenant base. Strengths: cost of living A+, schools A-, crime A-; Watch: amenities F, commute F, employment F.
- Radford City Public School District (urban): math 66% / reading 78% proficiency, ranked #26 of 131 in VA (top 20%) — strong family-tenant draw, lease renewals of 3-5y typical.
- Market conditions: Rents rising fast (+6.6%/yr); 150 active listings in the ZIP; 1 comparable units currently listed for rent nearby; 28 units permitted in Radford city in 2024 (0 in 5+ unit buildings).
Forward outlook
- Local home prices are declining (-3.0%/yr); year-one equity from $1k of loan paydown is wiped out by about $5k of value loss. Plan a longer hold.
- Radford County population projected at +32% by 2050 — long-run rental-demand tailwind backs the buy-and-hold thesis.
Negotiation context
- It's been on market 166 days — a 12% lower offer ($149k) is reasonable based on typical stale-listing flexibility.
Risks & watch-outs
- Watch-outs: built in 1920 — expect roof / HVAC / electrical / plumbing capex.
Questions for the listing agent
- It's been on market 166 days. Have you received any prior offers? Is the seller open to a 12% concession, seller financing, or rate buy-down credit?
- Built in 1920 — when were the roof, HVAC, electrical panel, plumbing, and water heater last replaced?
- Why hasn't it sold? Are there any deal-killer items the seller is aware of (foundation, flood, title, zoning, code violations)?
- Is there a deadline driving the sale (1031 exchange, divorce, estate, relocation)? That informs how much negotiation room exists.
- Schools are A-rated — typically a magnet for longer-tenancy family renters. What's the average tenant stay here, and is there a school-zone premium baked into asking?
- What's the average days-on-market for RENTAL listings here right now (not sales)? A rising rental-DOM trend means longer vacancies and softer asking-rent achievability than the comps imply.
- What's the recent tenant-quality profile in this submarket — average credit score on applications, eviction rate, late-payment / NSF rate, and stable-employment percentage? A property-management company in the area should have these aggregated.
- How much new for-sale + rental construction is in the pipeline within 1–3 miles? Heavy new supply typically softens prices + rents 12–24 months out; constrained supply supports both.
Investment metrics
- 1% rule
- 0.92% ✗
- Cap rate
- 7.72%
- Cash-on-cash
- 5.10%
- DSCR
- 1.23
- GRM
- 9.0
CMA / ARV
- ARV (median comp)
- $258,356
- List price
- $169,000
- Delta
- -34.59%
- Verdict
- UNDERPRICED
- Comps
- 20 within 1.0 mi
Show comp detail 12 sales within ~0.75 mi
| Address | Dist | Beds/Ba | Sqft | Sold | Price | $/sf | Match |
|---|---|---|---|---|---|---|---|
| 1515 Second St | 0.08mi | 3/1.0 (-1) | 1,303 (+4%) | 7mo | $175,000 | $134 | 78 |
| 1204 Fifth St | 0.23mi | 3/2.0 (-1) | 1,230 (-1%) | 5mo | $300,000 | $244 | 74 |
| 1408 3rd St | 0.04mi | 4/1.0 | 1,130 (-9%) | 12mo | $175,500 | $155 | 73 |
| 208 Ingles St | 0.38mi | 3/2.0 (-1) | 1,276 (+2%) | 1mo | $267,000 | $209 | 69 |
| 1004 Dundee Dr | 0.57mi | 3/1.5 (-1) | 1,248 (+0%) | 5mo | $249,000 | $200 | 63 |
| 1230 Second St | 0.14mi | 3/1.0 (-1) | 1,061 (-15%) | 8mo | $196,600 | $185 | 57 |
| 2001 7th St | 0.52mi | 3/1.0 (-1) | 1,174 (-6%) | 6mo | $157,500 | $134 | 56 |
| 804 Tenth St | 0.68mi | 3/1.0 (-1) | 1,291 (+4%) | 3mo | $175,000 | $136 | 55 |
| 702 Preston St | 0.41mi | 3/1.0 (-1) | 1,376 (+10%) | 6mo | $233,800 | $170 | 53 |
| 1712 Third St | 0.25mi | 3/2.0 (-1) | 1,416 (+14%) | 9mo | $260,000 | $184 | 50 |
| 1048 Preston St | 0.70mi | 3/1.5 (-1) | 1,200 (-4%) | 10mo | $265,000 | $221 | 46 |
| 2110 Fourth St | 0.56mi | 3/2.0 (-1) | 1,408 (+13%) | 12mo | $275,000 | $195 | 34 |
Match score weights: distance 35% · size 25% · config 20% · recency 20%. Top-matched comps best support the ARV.
Projected returns pro-forma
-3.0% appreciation · 6.63% rent growth · sell at horizon
- IRR
- -4.8%
- Equity multiple
- 0.82×
- Total profit
- $-8,725
- Equity at exit
- $25,198
- IRR
- 8.4%
- Equity multiple
- 1.73×
- Total profit
- $34,767
- Equity at exit
- $14,612
Cash invested: $47,320 (down + closing). Projections, not guarantees.
Landlord ↔ Tenant lean methodology
- Overall (STATE)
- 55 Moderately Landlord-Leaning
- State Virginia
- 55 Moderately Landlord-Leaning · D+2
- County
- — inherits STATE
- City
- — inherits STATE
ZIP-level market 24141
- Home prices YoY
- -26.2%
- Rents YoY
- 6.6%
- Active inventory
- 150
- Price-to-rent
- 9.0×
Monthly cashflow live
- Estimated rent
- $1,560 medium interval (Pro) →
- Mortgage (P&I)
- −$886
- Tax from tax record
- −$74 /mo · $890/yr
- Insurance
- −$70
- HOA
- −$0
- Vacancy / Maint / Mgmt
- −$328
- Net cashflow
- $201
Break-even live
UW: 25.0% down · 7.5% · 30yr · 1.5% tax · 5.0% vac · 8.0% maint · 8.0% mgmt
Financing live
Cash to close
- Down payment
- $42,250
- Closing costs
- $5,070
- Reserves months
- —
- Total cash needed
- —
Loan-product check · same deal, 3 products live
Conventional
25% down · 7.5% · 30yr
- Down + closing
- —
- Monthly P&I
- —
- Monthly cashflow
- —
- DSCR
- —
- Eligible?
- —
Personal DTI + credit; lowest rate.
DSCR
20% down · 8.5% · 30yr
- Down + closing
- —
- Monthly P&I
- —
- Monthly cashflow
- —
- DSCR
- —
- Eligible?
- —
No personal income docs; deal must DSCR.
Hard money
10% down · 12.0% · 12mo
- Down + closing
- —
- Monthly P&I
- —
- Monthly cashflow
- —
- DSCR
- —
- Eligible?
- —
Short-term bridge; refi at stabilization.
Rent comps 1 comps
| Address | Beds | Baths | Sqft | Rent | $/sqft | DOM | Units | Dist |
|---|---|---|---|---|---|---|---|---|
| 222 Allen Ave Radford, VA | 1.0–3.0 | 1.0–1.5 | 875 | $1,050 | $1.20 | 43d | 5 | 1.41mi |
Listing history 3 events
-
2026-04-20price $169,000 760-char remark
Show marketing remark (760 chars)
Charming 4-bedroom, 1-bath home in the heart of Radford featuring central air with efficient gas heat and washer/dryer hookups for added convenience. This home offers a functional layout with spacious bedrooms and great natural light throughout. Several appliances are newer, making the property move-in ready with room to add your own personal touches. The level lot provides easy maintenance and outdoor potential for gardening, pets, or play. Located close to Radford University, shopping, restaurants, and local schools, this home is ideal for homeowners or investors looking for reliable rental demand. An affordable opportunity in a convenient Radford location—don’t miss it! Some photos may include virtual staging for illustrative purposes.
-
2026-03-30price $179,000 760-char remark
Show marketing remark (760 chars)
Charming 4-bedroom, 1-bath home in the heart of Radford featuring central air with efficient gas heat and washer/dryer hookups for added convenience. This home offers a functional layout with spacious bedrooms and great natural light throughout. Several appliances are newer, making the property move-in ready with room to add your own personal touches. The level lot provides easy maintenance and outdoor potential for gardening, pets, or play. Located close to Radford University, shopping, restaurants, and local schools, this home is ideal for homeowners or investors looking for reliable rental demand. An affordable opportunity in a convenient Radford location—don’t miss it! Some photos may include virtual staging for illustrative purposes.
-
2025-12-11$199,990 Active 760-char remark
Show marketing remark (760 chars)
Charming 4-bedroom, 1-bath home in the heart of Radford featuring central air with efficient gas heat and washer/dryer hookups for added convenience. This home offers a functional layout with spacious bedrooms and great natural light throughout. Several appliances are newer, making the property move-in ready with room to add your own personal touches. The level lot provides easy maintenance and outdoor potential for gardening, pets, or play. Located close to Radford University, shopping, restaurants, and local schools, this home is ideal for homeowners or investors looking for reliable rental demand. An affordable opportunity in a convenient Radford location—don’t miss it! Some photos may include virtual staging for illustrative purposes.
ⓘ Source: listings_history table (triggers on properties + properties_extension) + one-shot
backfill from property_details.listing_events for pre-trigger history.
Tax reassessment forecast VA · Resets to sale price
- Current annual tax
- $890 · $74/mo
- Projected year-2 tax
- $1,386 · $115/mo
- Expected delta
- +$496/yr (+$41/mo · 55.8%)
ⓘ Screening estimate from a state-policy table — verify with the county assessor before closing.
Climate risk First Street
- Flood 1/10 Low FEMA zone X (unshaded) · 0% chance over 30 yrs
- Wildfire 2/10 Low
- Heat 4/10 Moderate 7 d/yr ≥96°F today · 22 d/yr by 30 yrs out
- Wind 2/10 Low 0% chance of damaging wind over 30 yrs
- Air quality 1/10 Low 0 unhealthy d/yr today · 0 by 30 yrs out
Nearby sold comps map
Loading sold comps map…
Walkable amenities ~0.75 mi
Loading nearby amenities…
Taxation est. · year 1
- Rental income
- $18,715
- − Mortgage interest
- −$9,467
- − Property taxes
- −$890
- − Insurance
- −$845
- − Repairs & maintenance
- −$1,497
- − Management
- −$1,497
- − Depreciation
- −$4,916
- Taxable loss
- −$397
- Est. tax savings @ 24.0%
- +$95
- After-tax cash flow
- $2,510/yr
For passive investors: Depreciation is non-cash, so a rental often shows a tax loss while cash-flowing — sheltering income. Rental losses are passive: they offset passive income freely, and up to $25,000/yr can offset ordinary (W-2) income if you actively participate and your MAGI is under $100k (phasing out to $0 by $150k); unused losses carry forward. On sale, claimed depreciation is recaptured at up to 25%, and gains may owe capital-gains tax (a 1031 exchange can defer both). Figures are a year-1 estimate at your 24.0% rate — not tax advice; consult a CPA.
Schools (NCES district)
- District
- Radford City Public School District
- NCES district ID
- 5103180
- Math proficiency
- 66% ▼ -22.00%
- Reading proficiency
- 78% ▼ -5.00%
- Median HH income
- $32,239
- Composite
- 59.29/100
- National rank
- #935
- State rank
- #26 of 131 in VA
Livability — Radford
- Score
- 68/100
- State rank
- #269
- US rank
- #9496
Category grades
Schools grade is shown separately in the Schools card above.
Census & demographics
- Census place
- Radford, VA
- County
- Radford City · 21,484 people
- City population
- 21,484
- Metro
- Blacksburg-Christiansburg, VA
- Population (ZIP)
- 21,484
- Household income
- $62,969
- Rent vs Own
- Severe rent burden
- 1211.0
Population outlook (Radford County) Hauer SSP2
- Today (2025)
- 21,530 people
- By 2030
- 23,199 · +7.8%
- By 2040
- 25,758 · +19.6%
- By 2050
- 28,422 · +32.0%
- By 2075
- 35,350 · +64.2%
- By 2100
- 42,449 · +97.2%
Race, ethnicity, and origin ACS 2023
- Neighborhood character
- Predominantly White (85%)
- Race & ethnicity
- White 85% Black 7% Hispanic / Latino 4% Two or more races 3% Asian 2%
- Common ancestry
- Slovak 3% Serbian 2% Romanian 1%
- Foreign-born
- 3% · Canada, Vietnam, China
- Languages at home
- 95% English-only · Spanish 2% Other Indo-European 1%
Political lean MEDSL · Radford
- 2024 margin
- Toss-up / Even · D 49.3% · R 48.8% · Other 1.9%
- 2008→2024 swing
- -8.9pp toward R · 2008: 9.4pp · 2024: 0.5pp
- All cycles
- 2024: D+0.5 2020: D+9.1 2016: D+4.7 2012: D+3.9 2008: D+9.4
Not yet ingested
- Civics
- —
Market trends
- HPI YoY
- ▼ -85.42%
- Current HPI
- 240.7418
- Rent YoY
- ▲ 6.63%
- Metro
- Blacksburg-Christiansburg, VA
- State GDP YoY
- ▲ 2.40%
- F500 in state
- 50
Industry mix (Fortune 500 HQ in VA)
| Industry | F500 HQs | Revenue |
|---|---|---|
| Aerospace / Defense | 4 | $236B |
|
||
| Technology / Defense | 3 | $32B |
|
||
| Financial Services | 2 | $176B |
|
||
| Utilities | 2 | $27B |
|
||
| Insurance | 2 | $25B |
|
||
| Technology | 2 | $15B |
|
||
Price history
-15.5% since first listed3 events — show timeline
- 2026-04-20 Price Changed $169,000 NRVMLS
- 2026-03-30 Price Changed $179,000 NRVMLS
- 2025-12-11 Listed $199,990 NRVMLS
Property tax history
+4.8%/yrLatest (2025): $890 · +18.8% YoY. Source: county tax records.
Cash-flow waterfall
monthlySold comps — $/sqft
last 12 mo · ≤1 miLoading sold comps…