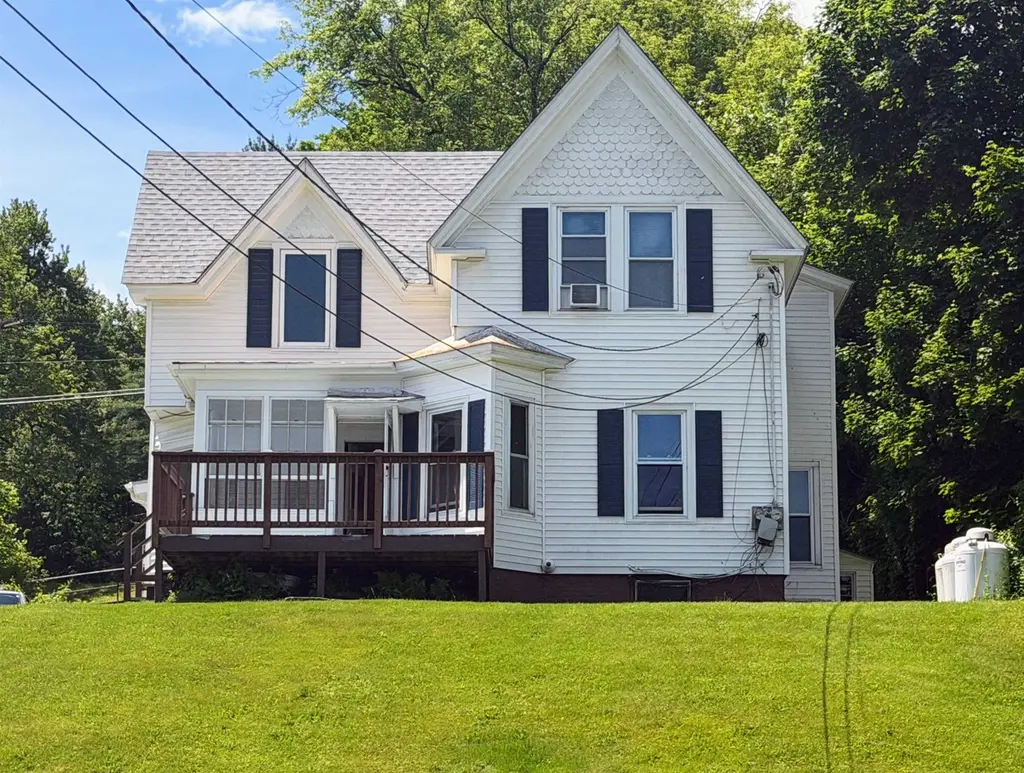
95 Clinton St · Springfield, VT
Flood risk 1/10 · Minimal
- FEMA flood zone
- X (unshaded)
- Chance of flooding over 30 yrs
- 0.0%
- Est. flood insurance / yr
- $473 – $860
Fire risk 3/10 · Minor
- Est. fire insurance / yr
- $480 – $892
Heat risk 3/10 · Minor
- Hot days now (above 92°F)
- 8 days/yr
- Hot days in 30 yrs
- 18 days/yr
Wind risk 3/10 · Minor
- Chance of severe wind over 30 yrs
- 6.0%
Air-quality risk 1/10 · Minimal
- Unhealthy air days now
- 0 days/yr
- Unhealthy air days in 30 yrs
- 0 days/yr
Risk factors via First Street. Map © Google.
Why this score? — see what drove the D grade
The composite is a weighted blend of 9 inputs, each scored 0–100. Each bar is that input's sub-score; the figure is the points it added to the 100-point composite (weight × sub-score).
- Cash flow +13.4/30.0
- ARV discount +9.7/15.0
- Schools +5.0/10.0
- DSCR +4.0/10.0
- Livability +3.7/5.0
- 1% rule +3.0/10.0
- Rent growth +2.5/5.0
- Condition / age +2.5/5.0
- Appreciation +0.0/10.0
$249,900
🖨 Deal sheet 📄 Offer letter ✓ Due diligence
Listing remarks MLS
Back on the market with an impressive list of recent improvements! Major updates include a new roof, new sewer line, upgraded electrical wiring, and a new hot water heater. The first floor has been extensively remodeled with fresh paint, high-end click-lock flooring, new kitchen cabinets, a dishwasher, bathroom vanity, toilet, and more. In addition to the oversized 1-car garage, the home features two enclosed porches as well as a deck overlooking the Black River. Formerly a single-family home, the property is currently configured as a duplex, featuring a 2-bedroom apartment on the first floor and a 1-bedroom apartment on the second floor. If you're looking for a home with with rental income potential or a property to accommodate multi-generational living, this versatile home offers plenty of possibilities. Currently the 2nd floor unit is rented and the 1st floor is vacant. Come see if it's the right fit for you! This home is also being sold as a single-family residence, please see MLS#: 5092654
Key facts
- New hot water heater
- New kitchen cabinets
- New roof
Tags
Property features AI
Exterior
- Parking: 1-car garage
- Utilities: Public water; Public sewer; Circuit breaker electrical panel; Fiber optic internet available; Cable available; Telephone available
- Home design: Duplex; Existing structure; Shingle (asphalt) roof
- Construction: Built in 1880; Wood frame construction with vinyl siding
- Exterior features: City lot, hilly and sloping terrain; In-town location; Common/shared paved driveway; White exterior color
Interior
- Kitchen: Eat-in kitchen; Kitchen with dishwasher, electric range, refrigerator
- Bedrooms: Bedrooms on main and second levels
- Flooring: Laminate; Manufactured; Vinyl; Wood
- Bathrooms: One full bathroom; One 3/4 bathroom
- Heating & cooling: Propane heating; Baseboard heating; Hot water system
- Interior features: 8 total rooms; Unfinished basement with concrete floor and interior stairs; Porch; Sunroom
- Laundry & utility: Main-level laundry room; Separate water heater
Neighborhood map
What this means for you Summary
Snapshot
- This is a 3-bed/2.5-bath single-family listed at $250k.
Deal economics
- At list price, monthly cash flow is $6 ($75/yr) — positive.
- The deal already cash-flows at list — no discount required.
- To meet the 1% rule (rent ≥ 1% of price), the offer needs to be $199k (20.3% below list).
- Recommended offer: $199k (20.3% below list) — sets the bar for 1% rule.
- Cap rate 6.3% vs local median 5.1% in Springfield — meaningfully above typical; check what's discounted (condition, days-on-market, listing class) to confirm the premium yield is real.
Location & tenants
- Location reads 73/100 on livability (#21 in VT) — a middle-class / working-renter tenant base. Strengths: cost of living A+, health & safety A+, crime A; Watch: amenities F, commute F, employment F.
- Zoned schools: Union Street School (math 18% / reading 31%, grade F, #164 of 192 statewide, top 91%, 250 students, 54% FRL).
- Market conditions: 50 active listings in the ZIP; 2 comparable units currently listed for rent nearby; 339 units permitted in Windsor County in 2024 (240 in 5+ unit buildings).
Forward outlook
- Local home prices are declining (-3.0%/yr); year-one equity from $2k of loan paydown is wiped out by about $7k of value loss. Plan a longer hold.
- Windsor County population projected at -21% by 2050 — secular population decline; favor cash flow + early exit over multi-decade hold.
Negotiation context
- It's been on market 16 days — a 2% lower offer ($246k) is reasonable based on typical stale-listing flexibility.
- 2 sale attempts; this cycle's ask has dropped $20k (7%) from the opening price — seller is motivated, your offer sets the floor, not the list.
- Current owner paid $67k; list at $250k implies a 273% gain — meaningful room to come down on a strong offer.
Risks & watch-outs
- Watch-outs: built in 1880 — expect roof / HVAC / electrical / plumbing capex.
Questions for the listing agent
- Built in 1880 — when were the roof, HVAC, electrical panel, plumbing, and water heater last replaced?
- Is there a deadline driving the sale (1031 exchange, divorce, estate, relocation)? That informs how much negotiation room exists.
- Schools are B-rated — typically a magnet for longer-tenancy family renters. What's the average tenant stay here, and is there a school-zone premium baked into asking?
- The area grade is low — what's the realistic commute time and amenity access for the typical tenant pool here? Any planned neighborhood developments (good or bad) we should know about?
- What's the average days-on-market for RENTAL listings here right now (not sales)? A rising rental-DOM trend means longer vacancies and softer asking-rent achievability than the comps imply.
- What's the recent tenant-quality profile in this submarket — average credit score on applications, eviction rate, late-payment / NSF rate, and stable-employment percentage? A property-management company in the area should have these aggregated.
- How much new for-sale + rental construction is in the pipeline within 1–3 miles? Heavy new supply typically softens prices + rents 12–24 months out; constrained supply supports both.
Investment metrics
- 1% rule
- 0.80% ✗
- Cap rate
- 6.32%
- Cash-on-cash
- 0.11%
- DSCR
- 1.00
- GRM
- 10.5
CMA / ARV
- ARV (on-the-fly)
- $262,740
- Comps found
- 12
Show comp detail 12 sales within ~0.75 mi
| Address | Dist | Beds/Ba | Sqft | Sold | Price | $/sf | Match |
|---|---|---|---|---|---|---|---|
| 9 Fairview St | 0.21mi | 4/1.5 (+1) | 1,482 (-2%) | 4mo | $180,000 | $121 | 75 |
| 157 Commonwealth Ave | 0.37mi | 3/1.5 | 1,474 (-2%) | 1mo | $256,000 | $174 | 74 |
| 30 Commonwealth Ave | 0.34mi | 3/1.0 | 1,500 (-1%) | 10mo | $240,000 | $160 | 69 |
| 56 Furnace St | 0.17mi | 3/1.0 | 1,368 (-9%) | 4mo | $100,000 | $73 | 68 |
| 29 Summer Hl | 0.51mi | 3/2.0 | 1,451 (-4%) | 1mo | $289,000 | $199 | 67 |
| 84 Hunter St | 0.41mi | 4/1.5 (+1) | 1,534 (+2%) | 10mo | $311,000 | $203 | 61 |
| 8 Center St | 0.53mi | 3/1.5 | 1,538 (+2%) | 10mo | $210,000 | $137 | 60 |
| 10 Derby Ct | 0.28mi | 4/1.5 (+1) | 1,616 (+7%) | 9mo | $265,000 | $164 | 58 |
| 15 Grove St | 0.32mi | 2/1.0 (-1) | 1,356 (-10%) | 0mo | $241,000 | $178 | 57 |
| 23 Southridge St | 0.32mi | 3/1.0 | 1,302 (-14%) | 9mo | $227,000 | $174 | 49 |
| 213 Commonwealth Ave | 0.47mi | 3/1.5 | 1,344 (-11%) | 11mo | $295,000 | $219 | 47 |
| 234 Harvard St | 0.75mi | 3/1.0 | 1,556 (+3%) | 10mo | $215,000 | $138 | 46 |
Match score weights: distance 35% · size 25% · config 20% · recency 20%. Top-matched comps best support the ARV.
Projected returns pro-forma
-3.0% appreciation · 3.0% rent growth · sell at horizon
- IRR
- -16.2%
- Equity multiple
- 0.43×
- Total profit
- $-40,164
- Equity at exit
- $37,261
- IRR
- -7.9%
- Equity multiple
- 0.50×
- Total profit
- $-34,738
- Equity at exit
- $21,607
Cash invested: $69,972 (down + closing). Projections, not guarantees.
Landlord ↔ Tenant lean methodology
- Overall (STATE)
- 41 Moderately Tenant-Leaning
- State Vermont
- 41 Moderately Tenant-Leaning · D+15
- County
- — inherits STATE
- City
- — inherits STATE
ZIP-level market 05156
- Home prices YoY
- -12.2%
- Active inventory
- 50
- Price-to-rent
- 10.5×
Monthly cashflow live
- Estimated rent
- $1,991 medium interval (Pro) →
- Mortgage (P&I)
- −$1,311
- Tax from tax record
- −$152 /mo · $1,825/yr
- Insurance
- −$104
- HOA
- −$0
- Vacancy / Maint / Mgmt
- −$418
- Net cashflow
- $6
Break-even live
UW: 25.0% down · 7.5% · 30yr · 1.5% tax · 5.0% vac · 8.0% maint · 8.0% mgmt
Financing live
Cash to close
- Down payment
- $62,475
- Closing costs
- $7,497
- Reserves months
- —
- Total cash needed
- —
Loan-product check · same deal, 3 products live
Conventional
25% down · 7.5% · 30yr
- Down + closing
- —
- Monthly P&I
- —
- Monthly cashflow
- —
- DSCR
- —
- Eligible?
- —
Personal DTI + credit; lowest rate.
DSCR
20% down · 8.5% · 30yr
- Down + closing
- —
- Monthly P&I
- —
- Monthly cashflow
- —
- DSCR
- —
- Eligible?
- —
No personal income docs; deal must DSCR.
Hard money
10% down · 12.0% · 12mo
- Down + closing
- —
- Monthly P&I
- —
- Monthly cashflow
- —
- DSCR
- —
- Eligible?
- —
Short-term bridge; refi at stabilization.
Rent comps 2 comps
| Address | Beds | Baths | Sqft | Rent | $/sqft | DOM | Units | Dist |
|---|---|---|---|---|---|---|---|---|
| 104 Park St Apt 2 Springfield, VT | 3.0 | 1.0 | 1150 | $1,645 | $1.43 | 43d | 1 | 0.67mi |
| 39 Summit Ave Unit Na Springfield, VT | 2.0 | 2.0 | 1150 | $2,750 | $2.39 | 43d | 1 | 1.47mi |
Listing history 13 events
-
2026-06-19days on market $249,900 Active 16 DOM
-
2026-06-18days on market $249,900 Active 15 DOM
-
2026-06-17days on market $249,900 Active 14 DOM
-
2026-06-16days on market $249,900 Active 13 DOM
-
2026-06-16price $249,900 Active 12 DOM
-
2026-06-15days on market $270,000 Active 12 DOM
-
2026-06-14days on market $270,000 Active 10 DOM
-
2026-06-12days on market $270,000 Active 9 DOM
-
2026-06-09days on market $270,000 Active 6 DOM
-
2026-06-08days on market $270,000 Active 5 DOM
-
2026-06-07days on market $270,000 Active 4 DOM
-
2026-06-05remarks 699-char remark
-
2026-06-05$270,000 Active 1 DOM
ⓘ Source: listings_history table (triggers on properties + properties_extension) + one-shot
backfill from property_details.listing_events for pre-trigger history.
Tax reassessment forecast VT · Partial reset (capped growth)
- Current annual tax
- $1,825 · $152/mo
- Projected year-2 tax
- $3,287 · $274/mo
- Expected delta
- +$1,462/yr (+$122/mo · 80.1%)
ⓘ Screening estimate from a state-policy table — verify with the county assessor before closing.
Climate risk First Street
- Flood 1/10 Low FEMA zone X (unshaded) · 0% chance over 30 yrs
- Wildfire 3/10 Moderate
- Heat 3/10 Moderate 8 d/yr ≥92°F today · 18 d/yr by 30 yrs out
- Wind 3/10 Moderate 6% chance of damaging wind over 30 yrs
- Air quality 1/10 Low 0 unhealthy d/yr today · 0 by 30 yrs out
Nearby sold comps map
Loading sold comps map…
Walkable amenities ~0.75 mi
Loading nearby amenities…
Taxation est. · year 1
- Rental income
- $23,893
- − Mortgage interest
- −$13,998
- − Property taxes
- −$1,825
- − Insurance
- −$1,250
- − Repairs & maintenance
- −$1,911
- − Management
- −$1,911
- − Depreciation
- −$7,270
- Taxable loss
- −$4,272
- Est. tax savings @ 24.0%
- +$1,025
- After-tax cash flow
- $1,101/yr
For passive investors: Depreciation is non-cash, so a rental often shows a tax loss while cash-flowing — sheltering income. Rental losses are passive: they offset passive income freely, and up to $25,000/yr can offset ordinary (W-2) income if you actively participate and your MAGI is under $100k (phasing out to $0 by $150k); unused losses carry forward. On sale, claimed depreciation is recaptured at up to 25%, and gains may owe capital-gains tax (a 1031 exchange can defer both). Figures are a year-1 estimate at your 24.0% rate — not tax advice; consult a CPA.
Schools (NCES district)
No district data.
Livability — Springfield
- Score
- 73/100
- State rank
- #21
- US rank
- #5125
Category grades
Schools grade is shown separately in the Schools card above.
Census & demographics
- Census place
- Springfield, VT
- Population (ZIP)
- 9,028
Population outlook (Windsor County) Hauer SSP2
- Today (2025)
- 53,235 people
- By 2030
- 51,269 · -3.7%
- By 2040
- 46,517 · -12.6%
- By 2050
- 41,859 · -21.4%
- By 2075
- 33,298 · -37.5%
- By 2100
- 24,523 · -53.9%
Race, ethnicity, and origin ACS 2023
- Neighborhood character
- Predominantly White (93%)
- Race & ethnicity
- White 93% Two or more races 5% Hispanic / Latino 3%
- Common ancestry
- Lithuanian 13% Romanian 4% Serbian 3%
- Foreign-born
- 2% · Canada
- Languages at home
- 96% English-only · Spanish 2% French/Haitian/Cajun 1%
Political lean MEDSL · Windsor
- 2024 margin
- Solid D (+35.6) · D 66.3% · R 30.7% · Other 2.9%
- 2008→2024 swing
- -4.1pp toward R · 2008: 39.7pp · 2024: 35.6pp
- All cycles
- 2024: D+35.6 2020: D+38.9 2016: D+32.1 2012: D+38.1 2008: D+39.7
Not yet ingested
- Civics
- —
Market trends
- HPI YoY
- ▼ -43.22%
- Current HPI
- 310.0154
- Rent YoY
- —
- Metro
- —
- State GDP YoY
- —
- F500 in state
- 0
Price history
+864.3% since first listed5 events — show timeline
- 2026-06-03 Listed $270,000 PrimeMLS
- 2026-06-03 Listed $270,000 PrimeMLS
- 1990-03-02 Sold (Public Records) $67,000 Public Records
- 1988-09-22 Sold (Public Records) $50,000 Public Records
- 1987-03-18 Sold (Public Records) $28,000 Public Records
Property tax history
-6.5%/yrLatest (2024): $1,825 · +10.5% YoY. Source: county tax records.
Cash-flow waterfall
monthlySold comps — $/sqft
last 12 mo · ≤1 miLoading sold comps…