3180 Coral Way · Miami, FL
Flood risk 1/10 · Minimal
- FEMA flood zone
- X (unshaded)
- Chance of flooding over 30 yrs
- 0.0%
- Est. flood insurance / yr
- $507 – $1,088
Fire risk 1/10 · Minimal
- Est. fire insurance / yr
- $947 – $1,759
Heat risk 10/10 · Severe
- Hot days now (above 104°F)
- 6 days/yr
- Hot days in 30 yrs
- 24 days/yr
Wind risk 10/10 · Severe
- Chance of severe wind over 30 yrs
- 99.0%
Air-quality risk 2/10 · Minimal
- Unhealthy air days now
- 1 days/yr
- Unhealthy air days in 30 yrs
- 1 days/yr
Risk factors via First Street. Map © Google.
Why this score? — see what drove the D grade
The composite is a weighted blend of 9 inputs, each scored 0–100. Each bar is that input's sub-score; the figure is the points it added to the 100-point composite (weight × sub-score).
- Cash flow +12.1/30.0
- ARV discount +7.5/15.0
- Schools +4.2/10.0
- Livability +3.9/5.0
- Condition / age +3.8/5.0
- DSCR +3.6/10.0
- 1% rule +3.5/10.0
- Rent growth +3.2/5.0
- Appreciation +0.0/10.0
$399,999
🖨 Deal sheet 📄 Offer letter ✓ Due diligence
Listing remarks
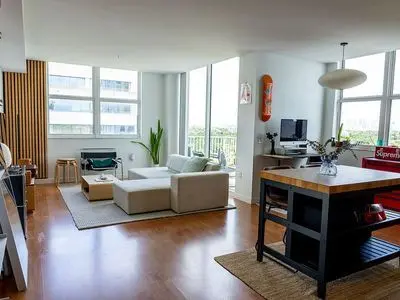
Description: Welcome to 3180 Coral Way #1205, a modern 1-bedroom, 1-bath condo for sale in Miami located in the highly desirable Coral Way corridor near Coral Gables and Brickell. This 810 sq ft unit features an open-concept floor plan, granite countertops, stainless steel appliances, in-unit washer and dryer, and a private balcony with stunning Miami skyline views. Floor-to-ceiling natural light creates a bright and inviting living space ideal for both homeowners and investors. The building offers resort-style amenities including a 5th floor swimming pool, fully equipped fitness center with sauna, and a covered, gated parking garage with 24-hour security. A full-service front desk concierg
Key facts
- Private balcony
- Miami skyline views
- 24 hour security
Tags
Property features AI
Exterior
- Home design: Built in 2006
- Exterior features: Located in the Coral Way subdivision
Neighborhood map
What this means for you Summary
Snapshot
- This is a 1-bed/1.0-bath single-family listed at $400k. Condition is rated good.
Deal economics
- At list price, monthly cash flow is $-91 ($-1k/yr) — negative.
- To cash-flow at today's rent, offer at most $387k (3.3% below list).
- To meet the 1% rule (rent ≥ 1% of price), the offer needs to be $338k (15.4% below list).
- Recommended offer: $338k (15.4% below list) — sets the bar for 1% rule.
- Cap rate 6.0% vs local median 1.9% in Miami — top-decile yield for the area; either an underpriced asset or a hidden risk that comps aren't pricing in. Stress-test before assuming the spread holds.
Location & tenants
- Location reads 78/100 on livability (#177 in FL, #2,724 nationally) — a middle-class / working-renter tenant base. Strengths: amenities A+, commute A+, health & safety A+; Watch: employment C-, crime F, cost of living F.
- Miami-Dade (suburban): math 45% / reading 54% proficiency, ranked #40 of 73 in FL (top 55%) — families likely to look elsewhere, expect single-tenant / working-renter base with shorter leases; 64% free/reduced lunch — lower-income household profile, screen leases tightly.
- Market conditions: Rents rising (+2.7%/yr); 225 active listings in the ZIP; 1 comparable units currently listed for rent nearby; 10,051 units permitted in Miami-Dade County in 2024 (7,758 in 5+ unit buildings).
- At $3,384/mo this rent would consume 55% of the median local household income ($74k/yr) (locally 1517% of renters already pay >50% of income on rent) — very limited rent-growth headroom before tenants either downsize or default.
Forward outlook
- Local home prices are declining (-3.0%/yr); year-one equity from $3k of loan paydown is wiped out by about $12k of value loss. Plan a longer hold.
- Miami-Dade County population projected at +28% by 2050 — long-run rental-demand tailwind backs the buy-and-hold thesis.
Negotiation context
- It's been on market 23 days — a 2% lower offer ($394k) is reasonable based on typical stale-listing flexibility.
- 2 sale attempts since 19y ago with the ask held roughly flat each time — persistent listings suggest the price (not the market) is what's stuck; bring a comps-based counter.
Risks & watch-outs
- Climate carrying-cost: severe wind risk, 99% chance of damaging wind over 30y; extreme-heat days projected 6→24/yr by 2055 (HVAC capex compounding) — expect insurance premiums to compound above CPI over the hold.
Questions for the listing agent
- What do current leases actually rent for vs. the listed asking? Can we see a recent rent roll and the last 12 months of T-12 income?
- Is there a deadline driving the sale (1031 exchange, divorce, estate, relocation)? That informs how much negotiation room exists.
- Schools are B-rated — typically a magnet for longer-tenancy family renters. What's the average tenant stay here, and is there a school-zone premium baked into asking?
- Crime grade is F in this area — have there been break-ins, vandalism, or insurance claims at this property in the last 3 years? What carrier currently insures it and at what premium?
- The area grade is low — what's the realistic commute time and amenity access for the typical tenant pool here? Any planned neighborhood developments (good or bad) we should know about?
- What's the average days-on-market for RENTAL listings here right now (not sales)? A rising rental-DOM trend means longer vacancies and softer asking-rent achievability than the comps imply.
- What's the recent tenant-quality profile in this submarket — average credit score on applications, eviction rate, late-payment / NSF rate, and stable-employment percentage? A property-management company in the area should have these aggregated.
- How much new for-sale + rental construction is in the pipeline within 1–3 miles? Heavy new supply typically softens prices + rents 12–24 months out; constrained supply supports both.
Investment metrics
- 1% rule
- 0.85% ✗
- Cap rate
- 6.02%
- Cash-on-cash
- -0.98%
- DSCR
- 0.96
- GRM
- 9.9
CMA / ARV
No comps found within radius.
Projected returns pro-forma
-3.0% appreciation · 2.73% rent growth · sell at horizon
- IRR
- -18.2%
- Equity multiple
- 0.36×
- Total profit
- $-71,499
- Equity at exit
- $59,641
- IRR
- -11.0%
- Equity multiple
- 0.35×
- Total profit
- $-73,282
- Equity at exit
- $34,585
Cash invested: $112,000 (down + closing). Projections, not guarantees.
Landlord ↔ Tenant lean methodology
- Overall (STATE)
- 87 Strongly Landlord-Friendly
- State Florida
- 87 Strongly Landlord-Friendly · R+3
- County
- — inherits STATE
- City
- — inherits STATE
ZIP-level market 33145
- Rents YoY
- 2.7%
- Active inventory
- 225
- Price-to-rent
- 9.9×
Monthly cashflow live
- Estimated rent
- $3,384 medium interval (Pro) →
- Mortgage (P&I)
- −$2,098
- Tax est. 1.5%
- −$500 /mo · $6,000/yr
- Insurance
- −$167
- HOA
- −$0
- Vacancy / Maint / Mgmt
- −$711
- Net cashflow
- $-91
Break-even live
UW: 25.0% down · 7.5% · 30yr · 1.5% tax · 5.0% vac · 8.0% maint · 8.0% mgmt
Financing live
Cash to close
- Down payment
- $100,000
- Closing costs
- $12,000
- Reserves months
- —
- Total cash needed
- —
Loan-product check · same deal, 3 products live
Conventional
25% down · 7.5% · 30yr
- Down + closing
- —
- Monthly P&I
- —
- Monthly cashflow
- —
- DSCR
- —
- Eligible?
- —
Personal DTI + credit; lowest rate.
DSCR
20% down · 8.5% · 30yr
- Down + closing
- —
- Monthly P&I
- —
- Monthly cashflow
- —
- DSCR
- —
- Eligible?
- —
No personal income docs; deal must DSCR.
Hard money
10% down · 12.0% · 12mo
- Down + closing
- —
- Monthly P&I
- —
- Monthly cashflow
- —
- DSCR
- —
- Eligible?
- —
Short-term bridge; refi at stabilization.
Rent comps 1 comps
| Address | Beds | Baths | Sqft | Rent | $/sqft | DOM | Units | Dist |
|---|---|---|---|---|---|---|---|---|
| 1710 SW 27th Ave Unit 1272101P Miami, FL | 1.0–5.0 | 1.0–4.0 | 1716 | $3,855 | $2.25 | 7d | 3 | 0.60mi |
Listing history 17 events
-
2026-06-18days on market $399,999 Active 23 DOM
-
2026-06-17days on market $399,999 Active 22 DOM
-
2026-06-16days on market $399,999 Active 21 DOM
-
2026-06-15days on market $399,999 Active 20 DOM
-
2026-06-13days on market $399,999 Active 18 DOM
-
2026-06-09days on market $399,999 Active 14 DOM
-
2026-06-08days on market $399,999 Active 13 DOM
-
2026-06-08days on market $399,999 Active 12 DOM
-
2026-06-04days on market $399,999 Active 9 DOM
-
2026-06-03days on market $399,999 Active 8 DOM
-
2026-06-02days on market $399,999 Active 7 DOM
-
2026-06-01days on market $399,999 Active 6 DOM
-
2026-05-31days on market $399,999 Active 5 DOM
-
2026-05-26$399,999 Active
-
2022-07-04price $2,400
-
2008-01-02historical
-
2007-08-24$400,000
ⓘ Source: listings_history table (triggers on properties + properties_extension) + one-shot
backfill from property_details.listing_events for pre-trigger history.
Climate risk First Street
- Flood 1/10 Low FEMA zone X (unshaded) · 0% chance over 30 yrs
- Wildfire 1/10 Low
- Heat 10/10 Extreme 6 d/yr ≥104°F today · 24 d/yr by 30 yrs out
- Wind 10/10 Extreme 99% chance of damaging wind over 30 yrs
- Air quality 2/10 Low 1 unhealthy d/yr today · 1 by 30 yrs out
Nearby sold comps map
Loading sold comps map…
Walkable amenities ~0.75 mi
Loading nearby amenities…
Taxation est. · year 1
- Rental income
- $40,602
- − Mortgage interest
- −$22,406
- − Property taxes
- −$6,000
- − Insurance
- −$2,000
- − Repairs & maintenance
- −$3,248
- − Management
- −$3,248
- − Depreciation
- −$11,636
- Taxable loss
- −$7,936
- Est. tax savings @ 24.0%
- +$1,905
- After-tax cash flow
- $809/yr
For passive investors: Depreciation is non-cash, so a rental often shows a tax loss while cash-flowing — sheltering income. Rental losses are passive: they offset passive income freely, and up to $25,000/yr can offset ordinary (W-2) income if you actively participate and your MAGI is under $100k (phasing out to $0 by $150k); unused losses carry forward. On sale, claimed depreciation is recaptured at up to 25%, and gains may owe capital-gains tax (a 1031 exchange can defer both). Figures are a year-1 estimate at your 24.0% rate — not tax advice; consult a CPA.
Condition & rehab AI · 2 photos
This modern 1-bedroom, 1-bath condo in Miami is in good condition with minimal repairs needed. Upgrading the flooring, painting, appliances, and adding smart home features can significantly increase its value.
Value-add opportunities
- Both Update flooring — New flooring can enhance both resale and rental value
- Both Paint interior walls — Fresh paint can make the space more appealing and increase value
- Both Upgrade kitchen appliances — Modern appliances can attract more buyers and renters
- Both Install smart home features — Smart home features can increase the home's appeal and value
Renovation cost estimate screening
Value-add ROI direction
- Both Update flooring — New flooring can enhance both resale and rental value ↑
- Both Paint interior walls — Fresh paint can make the space more appealing and increase value ↑
- Both Upgrade kitchen appliances — Modern appliances can attract more buyers and renters ↑
- Both Install smart home features — Smart home features can increase the home's appeal and value ↑
ⓘ Cost ranges are severity-bucket heuristics (US national rule-of-thumb). Get contractor quotes + a written scope before underwriting a rehab budget.
Schools (NCES district)
- District
- Miami-Dade
- NCES district ID
- 1200390
- Math proficiency
- 45% ▼ -16.00%
- Reading proficiency
- 54% ▼ -5.00%
- Median HH income
- $43,928
- Composite
- 41.76/100
- National rank
- #3397
- State rank
- #40 of 73 in FL
Livability — Miami
- Score
- 78/100
- State rank
- #177
- US rank
- #2724
Category grades
Schools grade is shown separately in the Schools card above.
Census & demographics
- Census place
- Miami, FL
- County
- Miami-Dade County · 2,697,751 people
- City population
- 827,308
- Metro
- Miami-Fort Lauderdale-Pompano Beach, FL
- Population (ZIP)
- 29,761
- Household income
- $73,995
- Rent vs Own
- Severe rent burden
- 1517.0
Population outlook (Miami-Dade County) Hauer SSP2
- Today (2025)
- 3,126,439 people
- By 2030
- 3,325,765 · +6.4%
- By 2040
- 3,697,561 · +18.3%
- By 2050
- 4,012,134 · +28.3%
- By 2075
- 4,605,612 · +47.3%
- By 2100
- 4,866,598 · +55.7%
Race, ethnicity, and origin ACS 2023
- Neighborhood character
- Predominantly Hispanic (79%)
- Race & ethnicity
- Hispanic / Latino 79% Two or more races 51% White 16% Asian 1% Black 1%
- Hispanic origin (detail)
- Mexican 1% Puerto Rican 2% Cuban 41% Dominican 2% Salvadoran 2%
- Common ancestry
- Estonian 2% Scotch-Irish 1% Italian 1%
- Foreign-born
- 59% · Canada, Jamaica, Dominican Republic
- Languages at home
- 13% English-only · Spanish 83% Other Indo-European 2% Russian/Polish/Slavic 1%
Political lean MEDSL · Miami-Dade
- 2024 margin
- R (+11.4) · D 43.9% · R 55.4%
- 2008→2024 swing
- -27.6pp toward R · 2008: 16.1pp · 2024: -11.4pp
- All cycles
- 2024: R+11.4 2020: D+7.3 2016: D+29.6 2012: D+23.7 2008: D+16.1
Not yet ingested
- Civics
- —
Market trends
- HPI YoY
- ▼ -657.80%
- Current HPI
- 485.4573
- Rent YoY
- ▲ 2.73%
- Metro
- Miami-Fort Lauderdale-Pompano Beach, FL
- State GDP YoY
- ▲ 3.28%
- F500 in state
- 36
Industry mix (Fortune 500 HQ in FL)
| Industry | F500 HQs | Revenue |
|---|---|---|
| Industrial Technology | 2 | $29B |
|
||
| Insurance | 2 | $17B |
|
||
| Retail | 1 | $60B |
|
||
| Technology Distribution | 1 | $58B |
|
||
| Homebuilding | 1 | $35B |
|
||
| Technology Manufacturing | 1 | $35B |
|
||
Price history
-0.0% since first listed4 events — show timeline
- 2026-05-26 Listed $399,999 FSBO.com
- 2022-07-04 Price Changed $2,400 RENT.
- 2008-01-02 Listing Removed — Beaches MLS
- 2007-08-24 Listed $400,000 Beaches MLS
Cash-flow waterfall
monthlySold comps — $/sqft
last 12 mo · ≤1 miLoading sold comps…