3203 South St · Hollywood, FL
Flood risk 3/10 · Minor
- FEMA flood zone
- X (unshaded)
- Chance of flooding over 30 yrs
- 0.12%
- Est. flood insurance / yr
- $507 – $1,088
Fire risk 1/10 · Minimal
- Est. fire insurance / yr
- $947 – $1,759
Heat risk 10/10 · Severe
- Hot days now (above 105°F)
- 5 days/yr
- Hot days in 30 yrs
- 19 days/yr
Wind risk 10/10 · Severe
- Chance of severe wind over 30 yrs
- 99.0%
Air-quality risk 2/10 · Minimal
- Unhealthy air days now
- 2 days/yr
- Unhealthy air days in 30 yrs
- 2 days/yr
Risk factors via First Street. Map © Google.
Why this score? — see what drove the B- grade
The composite is a weighted blend of 9 inputs, each scored 0–100. Each bar is that input's sub-score; the figure is the points it added to the 100-point composite (weight × sub-score).
- Cash flow +28.1/30.0
- DSCR +10.0/10.0
- 1% rule +7.7/10.0
- ARV discount +7.5/15.0
- Schools +4.1/10.0
- Condition / age +4.0/5.0
- Livability +3.8/5.0
- Rent growth +3.1/5.0
- Appreciation +0.0/10.0
$159,900
🖨 Deal sheet (PDF) 📄 Offer letter ✓ Due diligence
Listing remarks
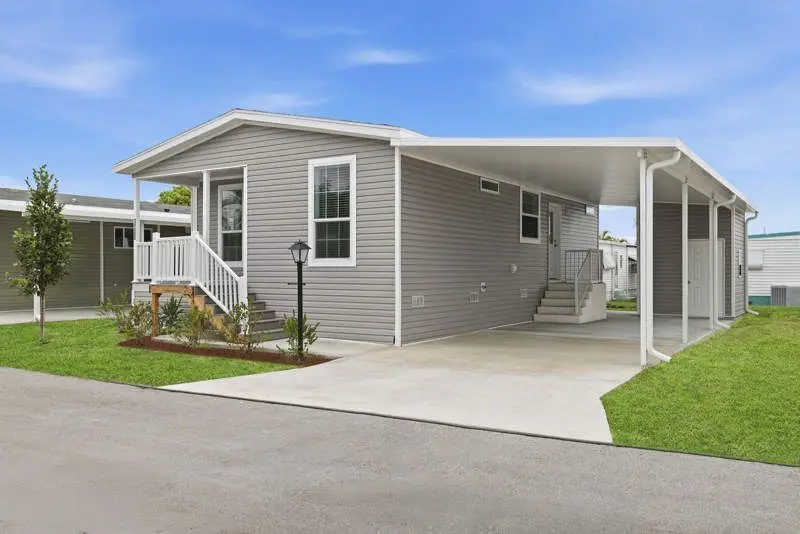
This 960 square feet, 2.0 bed 2.0 bath manufactured home built in 2026 by Skyline offers a cozy and modern living space in the Orangebrook community in Hollywood, FL. The home features an open concept layout with a spacious living room, dining room, and a well-appointed kitchen with sleek appliances. The master bedroom boasts an en suite bathroom and a walk-in closet for added convenience. Other amenities include a laundry room, carport, and a shed for extra storage space. Orangebrook is a thriving and tightly knit community located in the heart of Hollywood, FL. Residents of this community enjoy access to a variety of amenities such as a clubhouse, swimming pool, pickelball court, bocce co
Key facts
- En suite bathroom
- Laundry room
- Carport
Tags
Property features AI
Finance
- Financial info: List price $159,900
Exterior
- Home design: Single-story spec home at 3203 South St, Hollywood, FL
Interior
- Bedrooms: 1 bedroom
- Bathrooms: 2 full bathrooms
- Interior features: Living area approximately 960
Neighborhood map
What this means for you Summary
Snapshot
- This is a 1-bed/2.0-bath manufactured listed at $160k. Condition is rated good.
Deal economics
- At list price, monthly cash flow is $501 ($6k/yr) — positive.
- The deal already cash-flows at list — no discount required.
- Meets the 1% rule at list price ($2k rent vs $160k).
- Recommended offer: $155k (3.0% below list) — sets the bar for market timing.
- Cap rate 10.1% vs local median 3.2% in Hollywood — top-decile yield for the area; either an underpriced asset or a hidden risk that comps aren't pricing in. Stress-test before assuming the spread holds.
Location & tenants
- Location reads 76/100 on livability (#232 in FL, #3,548 nationally) — a middle-class / working-renter tenant base. Strengths: commute A+, housing A+, crime B+; Watch: amenities D.
- Broward (suburban): math 42% / reading 53% proficiency, ranked #46 of 73 in FL (top 63%) — families likely to look elsewhere, expect single-tenant / working-renter base with shorter leases.
- Market conditions: Rents rising (+2.4%/yr); 529 active listings in the ZIP; 40 comparable units currently listed for rent nearby; rentals at typical pace (median 16d on market — plan ~3-4 weeks tenant-placement turnaround); 2,111 units permitted in Broward County in 2024 (1,265 in 5+ unit buildings).
- This rent runs 34% of the median local income ($71k/yr) — at the standard rent-burdened threshold; future hikes will face affordability resistance.
Forward outlook
- Local home prices are declining (-3.0%/yr); year-one equity from $1k of loan paydown is wiped out by about $5k of value loss. Plan a longer hold.
- Broward County population projected at +34% by 2050 — long-run rental-demand tailwind backs the buy-and-hold thesis.
- At projected returns (-3.0% appreciation + 2.4% rent growth), your $45k cash investment doubles in ~10 years — after that, you're playing with house money.
Negotiation context
- It's been on market 34 days — a 3% lower offer ($155k) is reasonable based on typical stale-listing flexibility.
Risks & watch-outs
- Climate carrying-cost: severe wind risk, 99% chance of damaging wind over 30y; extreme-heat days projected 5→19/yr by 2055 (HVAC capex compounding) — expect insurance premiums to compound above CPI over the hold.
Questions for the listing agent
- It's been on market 34 days. Have you received any prior offers? Is the seller open to a 3% concession, seller financing, or rate buy-down credit?
- Is there a deadline driving the sale (1031 exchange, divorce, estate, relocation)? That informs how much negotiation room exists.
- What's the average days-on-market for RENTAL listings here right now (not sales)? A rising rental-DOM trend means longer vacancies and softer asking-rent achievability than the comps imply.
- What's the recent tenant-quality profile in this submarket — average credit score on applications, eviction rate, late-payment / NSF rate, and stable-employment percentage? A property-management company in the area should have these aggregated.
- How much new for-sale + rental construction is in the pipeline within 1–3 miles? Heavy new supply typically softens prices + rents 12–24 months out; constrained supply supports both.
Investment metrics
- 1% rule
- 1.27% ✓
- Cap rate
- 10.05%
- Cash-on-cash
- 13.42%
- DSCR
- 1.60
- GRM
- 6.6
CMA / ARV
No comps found within radius.
Projected returns pro-forma
-3.0% appreciation · 2.41% rent growth · sell at horizon
- IRR
- 2.8%
- Equity multiple
- 1.11×
- Total profit
- $4,808
- Equity at exit
- $23,842
- IRR
- 11.8%
- Equity multiple
- 1.90×
- Total profit
- $40,507
- Equity at exit
- $13,825
Cash invested: $44,772 (down + closing). Projections, not guarantees.
Landlord ↔ Tenant lean methodology
- Overall (STATE)
- 87 Strongly Landlord-Friendly
- State Florida
- 87 Strongly Landlord-Friendly · R+3
- County
- — inherits STATE
- City
- — inherits STATE
ZIP-level market 33021
- Rents YoY
- 2.4%
- Active inventory
- 529
- Price-to-rent
- 6.6×
Monthly cashflow live
- Estimated rent
- $2,033 high interval (Pro) →
- Mortgage (P&I)
- −$839
- Tax est. 1.5%
- −$200 /mo · $2,398/yr
- Insurance
- −$67
- HOA
- −$0
- Vacancy / Maint / Mgmt
- −$427
- Net cashflow
- $501
Break-even live
Sensitivity live
| Price | -10% $611 | -5% $556 | +0% $501 | +5% $445 | +10% $390 |
|---|---|---|---|---|---|
| Rent | -10% $340 | -5% $420 | +0% $501 | +5% $581 | +10% $661 |
| Rate | -1.0pp $581 | -0.5pp $541 | base $501 | +0.5pp $459 | +1.0pp $417 |
UW: 25.0% down · 7.5% · 30yr · 1.5% tax · 5.0% vac · 8.0% maint · 8.0% mgmt
Financing live
Cash to close
- Down payment
- $39,975
- Closing costs
- $4,797
- Reserves months
- —
- Total cash needed
- —
Loan-product check · same deal, 3 products live
Conventional
25% down · 7.5% · 30yr
- Down + closing
- —
- Monthly P&I
- —
- Monthly cashflow
- —
- DSCR
- —
- Eligible?
- —
Personal DTI + credit; lowest rate.
DSCR
20% down · 8.5% · 30yr
- Down + closing
- —
- Monthly P&I
- —
- Monthly cashflow
- —
- DSCR
- —
- Eligible?
- —
No personal income docs; deal must DSCR.
Hard money
10% down · 12.0% · 12mo
- Down + closing
- —
- Monthly P&I
- —
- Monthly cashflow
- —
- DSCR
- —
- Eligible?
- —
Short-term bridge; refi at stabilization.
Rent comps 40 comps
| Address | Beds | Baths | Sqft | Rent | $/sqft | DOM | Units | Dist |
|---|---|---|---|---|---|---|---|---|
| 911 S Park Rd Hollywood, FL | 1.0–3.0 | 1.0–2.0 | 1123 | $2,319 | $2.07 | 2d | 24 | 0.29mi |
| 2915 Plunkett St Unit 10D Hollywood, FL | 1.0 | 1.0 | 640 | $1,700 | $2.66 | 17d | 1 | 0.55mi |
| 812 S Park Rd Hollywood, FL | 1.0–3.0 | 1.0–2.0 | 999 | $1,869 | $1.87 | 2d | 24 | 0.55mi |
| 2917 Plunkett St Unit 15C Hollywood, FL | 2.0 | 1.0 | 900 | $1,950 | $2.17 | 8d | 1 | 0.56mi |
| 1046 Foster Rd Hallandale Beach, FL | 2.0 | 1.0 | 750 | $1,795 | $2.39 | 8d | 1 | 0.60mi |
| 620 S Park Rd Unit 31-2 Hollywood, FL | 1.0 | 1.0 | 841 | $1,800 | $2.14 | 25d | 1 | 0.61mi |
| 610 S Park Rd Unit 26-1 Hollywood, FL | 1.0 | 1.0 | 841 | $2,100 | $2.50 | 25d | 1 | 0.63mi |
| 610 S Park Rd Unit 26-1 Hollywood, FL | 1.0 | 1.0 | 841 | $1,950 | $2.32 | 4d | 1 | 0.63mi |
| 1041 NW 7th Ct Unit 2 Hallandale Beach, FL | 1.0 | 1.0 | 600 | $1,550 | $2.58 | 25d | 1 | 0.65mi |
| 530 S Park Rd Hollywood, FL | 1.0 | 1.0 | 841 | $1,800 | $2.14 | 25d | 1 | 0.67mi |
| 640 S Park Rd Unit 34-4 Hollywood, FL | 2.0 | 2.0 | 1060 | $2,250 | $2.12 | 25d | 1 | 0.67mi |
| 530 S Park Rd Hollywood, FL | 2.0 | 2.0 | 1060 | $2,375 | $2.24 | 19d | 1 | 0.67mi |
| 550 S Park Rd Unit 14-8 Hollywood, FL | 1.0 | 1.0 | 650 | $1,750 | $2.69 | 8d | 1 | 0.67mi |
| 640 S Park Rd Unit 14-4 Hollywood, FL | 2.0 | 2.0 | 1060 | $2,300 | $2.17 | 25d | 1 | 0.67mi |
| 640 S Park Rd Unit 14-4 Hollywood, FL | 2.0 | 2.0 | 1060 | $2,200 | $2.08 | 17d | 1 | 0.67mi |
| 530 S Park Rd Unit 12-11 Hollywood, FL | 2.0 | 2.0 | 1060 | $2,375 | $2.24 | 16d | 1 | 0.69mi |
| 530 S Park Rd Unit 17-11 Hollywood, FL | 2.0 | 2.0 | 1060 | $2,300 | $2.17 | 22d | 1 | 0.69mi |
| 555 S Luna Ct Hollywood, FL | 2.0 | 2.0 | 1036 | $2,120 | $2.05 | 5d | 2 | 0.71mi |
| 570 S Park Rd Unit 13-6 Hollywood, FL | 2.0 | 2.0 | 1060 | $2,400 | $2.26 | 25d | 1 | 0.72mi |
| 460 S Park Rd Unit 6-304 Hollywood, FL | 2.0 | 1.0 | 918 | $1,950 | $2.12 | 6d | 1 | 0.74mi |
| 460 S Park Rd Unit 6-203 Hollywood, FL | 2.0 | 2.0 | 820 | $2,400 | $2.93 | 6d | 1 | 0.74mi |
| 460 S Park Rd Apt 109 Hollywood, FL | 2.0 | 2.0 | 867 | $2,100 | $2.42 | 20d | 1 | 0.74mi |
| 470 S Park Rd Unit 7-110 Hollywood, FL | 1.0 | 1.0 | 659 | $1,800 | $2.73 | 25d | 1 | 0.75mi |
| 470 S Park Rd Unit 7-203 Hollywood, FL | 2.0 | 2.0 | 820 | $2,050 | $2.50 | 25d | 1 | 0.75mi |
| 410 S Park Rd Unit 1-204 Hollywood, FL | 2.0 | 1.0 | 838 | $2,100 | $2.51 | 12d | 1 | 0.77mi |
| 532 S Crescent Dr Unit 106 Hollywood, FL | — | 1.0 | 550 | $1,425 | $2.59 | 14d | 1 | 0.79mi |
| 3500 Jackson St Unit 203 Hollywood, FL | 2.0 | 2.0 | 875 | $1,995 | $2.28 | 25d | 1 | 0.79mi |
| 2750 Washington St Hollywood, FL | 2.0 | 1.0 | 1053 | $3,300 | $3.13 | 3d | 1 | 0.82mi |
| 2750 Washington St Hollywood, FL | 2.0 | 1.0 | 1053 | $3,500 | $3.32 | 15d | 1 | 0.82mi |
| 3624 Jackson St Unit 21 Hollywood, FL | 2.0 | 2.0 | 1100 | $1,900 | $1.73 | 3d | 1 | 0.83mi |
| 832 NW 10th St Unit 1 Hallandale Beach, FL | 2.0 | 1.0 | 800 | $1,800 | $2.25 | 25d | 1 | 0.86mi |
| 3600 Van Buren St Hollywood, FL | 1.0–2.0 | 1.0–2.0 | 1055 | $1,950 | $1.85 | 3d | 4 | 0.86mi |
| 400 S Luna Ct #2 Hollywood, FL | 2.0 | 1.0 | 960 | $2,300 | $2.40 | 25d | 1 | 0.87mi |
| 1200 Tallwood Ave #302 Hollywood, FL | 2.0 | 2.0 | 840 | $2,225 | $2.65 | 4d | 1 | 0.88mi |
| 1200 Tallwood Ave #302 Hollywood, FL | 2.0 | 2.0 | 840 | $2,250 | $2.68 | 25d | 1 | 0.88mi |
| 315 S Crescent Dr Hollywood, FL | — | 1.0 | 544 | $1,425 | $2.62 | 16d | 1 | 0.89mi |
| 3601 Van Buren St Hollywood, FL | 1.0–2.0 | 1.0–2.0 | 941 | $1,725 | $1.83 | 4d | 3 | 0.92mi |
| 2918 Jackson St Hollywood, FL | 2.0 | 1.0 | 750 | $1,700 | $2.27 | 4d | 1 | 0.92mi |
| 2918 Jackson St Unit 1 Hollywood, FL | 2.0 | 1.0 | 750 | $1,700 | $2.27 | 8d | 1 | 0.92mi |
| 900 Tallwood Ave #207 Hollywood, FL | 1.0 | 1.0 | 640 | $1,575 | $2.46 | 21d | 1 | 0.92mi |
Listing history 12 events
-
2026-06-18days on market $159,900 Active 34 DOM
-
2026-06-17days on market $159,900 Active 33 DOM
-
2026-06-16days on market $159,900 Active 32 DOM
-
2026-06-15days on market $159,900 Active 31 DOM
-
2026-06-13days on market $159,900 Active 29 DOM
-
2026-06-09days on market $159,900 Active 25 DOM
-
2026-06-07days on market $159,900 Active 23 DOM
-
2026-06-04days on market $159,900 Active 20 DOM
-
2026-06-03days on market $159,900 Active 19 DOM
-
2026-06-02days on market $159,900 Active 18 DOM
-
2026-06-01days on market $159,900 Active 17 DOM
-
2026-05-31days on market $159,900 Active 16 DOM
ⓘ Source: listings_history table (triggers on properties + properties_extension) + one-shot
backfill from property_details.listing_events for pre-trigger history.
Climate risk First Street
- Flood 3/10 Moderate FEMA zone X (unshaded) · 12% chance over 30 yrs
- Wildfire 1/10 Low
- Heat 10/10 Extreme 5 d/yr ≥105°F today · 19 d/yr by 30 yrs out
- Wind 10/10 Extreme 99% chance of damaging wind over 30 yrs
- Air quality 2/10 Low 2 unhealthy d/yr today · 2 by 30 yrs out
Nearby sold comps map
Loading sold comps map…
Walkable amenities ~0.75 mi
Loading nearby amenities…
Taxation est. · year 1
- Rental income
- $24,390
- − Mortgage interest
- −$8,957
- − Property taxes
- −$2,398
- − Insurance
- −$800
- − Repairs & maintenance
- −$1,951
- − Management
- −$1,951
- − Depreciation
- −$4,652
- Taxable income
- $3,681
- Est. tax owed @ 24.0%
- −$884
- After-tax cash flow
- $5,124/yr
For passive investors: Depreciation is non-cash, so a rental often shows a tax loss while cash-flowing — sheltering income. Rental losses are passive: they offset passive income freely, and up to $25,000/yr can offset ordinary (W-2) income if you actively participate and your MAGI is under $100k (phasing out to $0 by $150k); unused losses carry forward. On sale, claimed depreciation is recaptured at up to 25%, and gains may owe capital-gains tax (a 1031 exchange can defer both). Figures are a year-1 estimate at your 24.0% rate — not tax advice; consult a CPA.
Condition & rehab AI · 19 photos
This 2026 manufactured home in Orangebrook, Hollywood, FL, is in excellent condition with modern finishes and a good curb appeal. It's move-in ready with minor maintenance items to address.
Value-add opportunities
- Resale Paint exterior trim — Enhances curb appeal and value
- Rental Replace window screens — Improves comfort and energy efficiency
Renovation cost estimate screening
Value-add ROI direction
- Resale Paint exterior trim — Enhances curb appeal and value ↑
- Rental Replace window screens — Improves comfort and energy efficiency ↑
ⓘ Cost ranges are severity-bucket heuristics (US national rule-of-thumb). Get contractor quotes + a written scope before underwriting a rehab budget.
Schools (NCES district)
- District
- Broward
- NCES district ID
- 1200180
- Math proficiency
- 42% ▼ -18.00%
- Reading proficiency
- 53% ▼ -5.00%
- Median HH income
- $52,139
- Composite
- 40.88/100
- National rank
- #3621
- State rank
- #46 of 73 in FL
Livability — Hollywood
- Score
- 76/100
- State rank
- #232
- US rank
- #3548
Category grades
Schools grade is shown separately in the Schools card above.
Census & demographics
- Census place
- Hollywood, FL
- County
- Broward County · 1,963,430 people
- City population
- 109,079
- Metro
- Miami-Fort Lauderdale-Pompano Beach, FL
- Population (ZIP)
- 48,464
- Household income
- $71,318
- Rent vs Own
- Severe rent burden
- 2151.0
Population outlook (Broward County) Hauer SSP2
- Today (2025)
- 2,207,033 people
- By 2030
- 2,360,704 · +7.0%
- By 2040
- 2,661,208 · +20.6%
- By 2050
- 2,946,698 · +33.5%
- By 2075
- 3,602,273 · +63.2%
- By 2100
- 3,970,984 · +79.9%
Race, ethnicity, and origin ACS 2023
- Neighborhood character
- Diverse neighborhood (Simpson 0.65)
- Race & ethnicity
- White 45% Hispanic / Latino 37% Two or more races 17% Black 13% Asian 3%
- Hispanic origin (detail)
- Puerto Rican 5% Cuban 10% Dominican 2%
- Common ancestry
- Romanian 3% Scotch-Irish 2% Hispanic 2%
- Foreign-born
- 35% · Canada, Jamaica, Dominican Republic
- Languages at home
- 53% English-only · Spanish 33% French/Haitian/Cajun 4% Russian/Polish/Slavic 2%
Political lean MEDSL · Broward
- 2024 margin
- D (+17.0) · D 58.0% · R 41.0%
- 2008→2024 swing
- -17.8pp toward R · 2008: 34.7pp · 2024: 17.0pp
- All cycles
- 2024: D+17.0 2020: D+29.8 2016: D+35.0 2012: D+34.9 2008: D+34.7
Not yet ingested
- Civics
- —
Market trends
- HPI YoY
- ▼ -404.28%
- Current HPI
- 429.7129
- Rent YoY
- ▲ 2.41%
- Metro
- Miami-Fort Lauderdale-Pompano Beach, FL
- State GDP YoY
- ▲ 3.28%
- F500 in state
- 36
Industry mix (Fortune 500 HQ in FL)
| Industry | F500 HQs | Revenue |
|---|---|---|
| Industrial Technology | 2 | $29B |
|
||
| Insurance | 2 | $17B |
|
||
| Retail | 1 | $60B |
|
||
| Technology Distribution | 1 | $58B |
|
||
| Homebuilding | 1 | $35B |
|
||
| Technology Manufacturing | 1 | $35B |
|
||
Cash-flow waterfall
monthlySold comps — $/sqft
last 12 mo · ≤1 miLoading sold comps…