6770 W State Route. 89a -- #310 · Sedona, AZ
Flood risk No data
- FEMA flood zone
- —
- Chance of flooding over 30 yrs
- —
- Est. flood insurance / yr
- —
Fire risk No data
- Est. fire insurance / yr
- —
Heat risk No data
- Hot days now (above threshold)
- —
- Hot days in 30 yrs
- —
Wind risk No data
- Chance of severe wind over 30 yrs
- —
Air-quality risk No data
- Unhealthy air days now
- —
- Unhealthy air days in 30 yrs
- —
Risk factors via First Street. Map © Google.
Why this score? — see what drove the B- grade
The composite is a weighted blend of 9 inputs, each scored 0–100. Each bar is that input's sub-score; the figure is the points it added to the 100-point composite (weight × sub-score).
- Cash flow +30.0/30.0
- DSCR +10.0/10.0
- 1% rule +9.4/10.0
- ARV discount +7.5/15.0
- Livability +3.4/5.0
- Condition / age +2.5/5.0
- Rent growth +2.2/5.0
- Schools +1.5/10.0
- Appreciation +0.0/10.0
$179,500
🖨 Deal sheet (PDF) 📄 Offer letter ✓ Due diligence
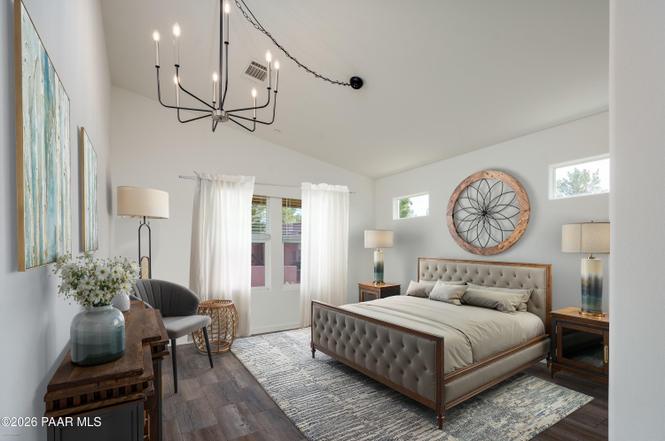
Listing remarks
This beautiful home was built in 2024 & the detailed upgrades make it feel like it's brand new!!! This home is ideally positioned just minutes from Sedona's iconic red rock scenery, world-class hiking trails, dining, shopping, medical services, and cultural attractions making it a comfortable and practical full-time residence for those who want to live close to everything Sedona has to offer, without the congestion of traffic or premium cost of in-town neighborhoods. Sedona Shadows is a well-established 55+ community known for its close proximity to West Sedona. Residents enjoy access to resort-style amenities including a clubhouse, swimming pool, heated spa, fitness center, BBQ grill
Key facts
- Fitness center
- Clubhouse
- Heated spa
Tags
Property features AI
Finance
- Financial info: Land lease amount: monthly payment
- HOA & community: Land lease community — monthly land lease; No association fees; No visible truck/trailer/RV/boat allowed; Community pool; Community golf; Heated community spa; Fitness center
Exterior
- Parking: 2 covered parking spaces; 2 carport spaces
- Utilities: Private water company; Sewer connected (private sewer)
- Home design: Manufactured/mobile housing; Fee simple ownership
- Construction: Painted exterior; Construction details — see remarks; Composition roof; Building area per builder
- Exterior features: Heated spa; Gazebo; Partial fencing; Desert front yard; Natural desert and dirt in back; Gravel/stone front; Private maintained road; Asphalt road surface
Interior
- Kitchen: Refrigerator; Dishwasher; Disposal; Pantry
- Bedrooms: 3 possible bedrooms
- Bathrooms: 2 full bathrooms
- Heating & cooling: Has heating; Central air conditioning
- Interior features: Double vanity in bath; Eat-in kitchen; Breakfast bar; No interior steps (single level); Vaulted ceilings; Pantry; Full bath in primary bedroom
- Laundry & utility: Laundry details — see remarks
Neighborhood map
What this means for you Summary
Snapshot
- This is a 2-bed/2.0-bath manufactured listed at $180k.
Deal economics
- At list price, monthly cash flow is $801 ($10k/yr) — positive.
- The deal already cash-flows at list — no discount required.
- Meets the 1% rule at list price ($3k rent vs $180k).
- Recommended offer: $158k (12.0% below list) — sets the bar for market timing.
- Cap rate 11.7% vs local median 1.4% in Sedona — top-decile yield for the area; either an underpriced asset or a hidden risk that comps aren't pricing in. Stress-test before assuming the spread holds.
Location & tenants
- Location reads 68/100 on livability (#55 in AZ) — a middle-class / working-renter tenant base. Strengths: commute A+, amenities B+; Watch: cost of living F.
- Sedona-Oak Creek JUSD #9 (4467) (town): math 12% / reading 21% proficiency, ranked #197 of 249 in AZ (top 79%) — low school quality limits family demand, transient renter base, plan for 1-2y turnover.
- Zoned schools: West Sedona Elementary School (math 12% / reading 17%, grade F, #898 of 1,109 statewide, top 83%, 256 students, 62% FRL); Sedona Red Rock Junior/Senior High School (math 12% / reading 22%, grade F, #252 of 381 statewide, top 67%, 482 students, 45% FRL).
- Market conditions: Rents soft (-1.3%/yr); 314 active listings in the ZIP; 4 comparable units currently listed for rent nearby; rentals at typical pace (median 22d on market — plan ~3-4 weeks tenant-placement turnaround); 2,062 units permitted in Yavapai County in 2024 (98 in 5+ unit buildings).
- At $2,585/mo this rent would consume 45% of the median local household income ($68k/yr) (locally 239% of renters already pay >50% of income on rent) — very limited rent-growth headroom before tenants either downsize or default.
Forward outlook
- Local home prices are declining (-3.0%/yr); year-one equity from $1k of loan paydown is wiped out by about $5k of value loss. Plan a longer hold.
- Yavapai County population projected at +10% by 2050 — modest demand growth; plan on rents tracking national, not racing it.
- At projected returns (-3.0% appreciation + 0.0% rent growth), your $50k cash investment doubles in ~9 years — after that, you're playing with house money.
Negotiation context
- It's been on market 152 days — a 12% lower offer ($158k) is reasonable based on typical stale-listing flexibility.
Questions for the listing agent
- It's been on market 152 days. Have you received any prior offers? Is the seller open to a 12% concession, seller financing, or rate buy-down credit?
- Why hasn't it sold? Are there any deal-killer items the seller is aware of (foundation, flood, title, zoning, code violations)?
- Is there a deadline driving the sale (1031 exchange, divorce, estate, relocation)? That informs how much negotiation room exists.
- What's the average days-on-market for RENTAL listings here right now (not sales)? A rising rental-DOM trend means longer vacancies and softer asking-rent achievability than the comps imply.
- What's the recent tenant-quality profile in this submarket — average credit score on applications, eviction rate, late-payment / NSF rate, and stable-employment percentage? A property-management company in the area should have these aggregated.
- How much new for-sale + rental construction is in the pipeline within 1–3 miles? Heavy new supply typically softens prices + rents 12–24 months out; constrained supply supports both.
Investment metrics
- 1% rule
- 1.44% ✓
- Cap rate
- 11.65%
- Cash-on-cash
- 19.13%
- DSCR
- 1.85
- GRM
- 5.8
CMA / ARV
- ARV (on-the-fly)
- $78,624
- Comps found
- 5
Show comp detail 5 sales within ~0.75 mi
| Address | Dist | Beds/Ba | Sqft | Sold | Price | $/sf | Match |
|---|---|---|---|---|---|---|---|
| 6770 W State Route 89a #55 | 0.00mi | 2/2.0 | 1,456 (0%) | 6mo | $50,000 | $34 | 95 |
| 6770 W State Route 89a #67 | 0.01mi | 2/2.0 | 1,440 (-1%) | 18mo | $40,000 | $28 | 83 |
| 6770 W SR 89a -- #159 | 0.01mi | 2/2.0 | 1,296 (-11%) | 9mo | $70,000 | $54 | 74 |
| 6770 W State Rte 89a #53 | 0.01mi | 3/2.0 (+1) | 1,344 (-8%) | 14mo | $80,000 | $60 | 70 |
| 6770 W Sr 89a #139 | 0.00mi | 2/2.0 | 1,248 (-14%) | 17mo | $120,000 | $96 | 62 |
Match score weights: distance 35% · size 25% · config 20% · recency 20%. Top-matched comps best support the ARV.
Projected returns pro-forma
-3.0% appreciation · 0.0% rent growth · sell at horizon
- IRR
- 7.6%
- Equity multiple
- 1.29×
- Total profit
- $14,418
- Equity at exit
- $26,764
- IRR
- 14.1%
- Equity multiple
- 1.98×
- Total profit
- $49,163
- Equity at exit
- $15,520
Cash invested: $50,260 (down + closing). Projections, not guarantees.
Landlord ↔ Tenant lean methodology
- Overall (STATE)
- 87 Strongly Landlord-Friendly
- State Arizona
- 87 Strongly Landlord-Friendly · R+3
- County
- — inherits STATE
- City
- — inherits STATE
ZIP-level market 86336
- Home prices YoY
- -26.1%
- Rents YoY
- -1.3%
- Active inventory
- 314
- Price-to-rent
- 5.8×
Monthly cashflow live
- Estimated rent
- $2,585 medium interval (Pro) →
- Mortgage (P&I)
- −$941
- Tax est. 1.5%
- −$224 /mo · $2,692/yr
- Insurance
- −$75
- HOA
- −$0
- Vacancy / Maint / Mgmt
- −$543
- Net cashflow
- $801
Break-even live
Sensitivity live
| Price | -10% $925 | -5% $863 | +0% $801 | +5% $739 | +10% $677 |
|---|---|---|---|---|---|
| Rent | -10% $597 | -5% $699 | +0% $801 | +5% $903 | +10% $1,006 |
| Rate | -1.0pp $892 | -0.5pp $847 | base $801 | +0.5pp $755 | +1.0pp $708 |
UW: 25.0% down · 7.5% · 30yr · 1.5% tax · 5.0% vac · 8.0% maint · 8.0% mgmt
Financing live
Cash to close
- Down payment
- $44,875
- Closing costs
- $5,385
- Reserves months
- —
- Total cash needed
- —
Loan-product check · same deal, 3 products live
Conventional
25% down · 7.5% · 30yr
- Down + closing
- —
- Monthly P&I
- —
- Monthly cashflow
- —
- DSCR
- —
- Eligible?
- —
Personal DTI + credit; lowest rate.
DSCR
20% down · 8.5% · 30yr
- Down + closing
- —
- Monthly P&I
- —
- Monthly cashflow
- —
- DSCR
- —
- Eligible?
- —
No personal income docs; deal must DSCR.
Hard money
10% down · 12.0% · 12mo
- Down + closing
- —
- Monthly P&I
- —
- Monthly cashflow
- —
- DSCR
- —
- Eligible?
- —
Short-term bridge; refi at stabilization.
Rent comps 4 comps
| Address | Beds | Baths | Sqft | Rent | $/sqft | DOM | Units | Dist |
|---|---|---|---|---|---|---|---|---|
| 6770 W State Route 89A Unit NA Sedona, AZ | 3.0 | 2.0 | 1400 | $2,495 | $1.78 | 14d | 1 | 0.02mi |
| 3385 Calle del Sol Sedona, AZ | 2.0 | 2.0 | 1254 | $3,300 | $2.63 | 22d | 1 | 0.59mi |
| 3340 W State Route 89A Apt 18 Sedona, AZ | 2.0 | 1.5 | 1160 | $2,100 | $1.81 | 22d | 1 | 0.66mi |
| 145 Navajo Dr Sedona, AZ | 1.0–2.0 | 1.0 | 805 | $2,200 | $2.73 | 14d | 4 | 1.25mi |
Listing history 16 events
-
2026-06-18days on market $179,500 Active 152 DOM
-
2026-06-17days on market $179,500 Active 151 DOM
-
2026-06-16days on market $179,500 Active 150 DOM
-
2026-06-15days on market $179,500 Active 149 DOM
-
2026-06-14days on market $179,500 Active 147 DOM
-
2026-06-13days on market $179,500 Active 146 DOM
-
2026-06-10days on market $179,500 Active 144 DOM
-
2026-06-09days on market $179,500 Active 143 DOM
-
2026-06-08days on market $179,500 Active 142 DOM
-
2026-06-07days on market $179,500 Active 141 DOM
-
2026-06-02days on market $179,500 Active 136 DOM
-
2026-06-01days on market $179,500 Active 135 DOM
-
2026-05-31days on market $179,500 Active 134 DOM
-
2026-05-30pricedays on market $179,500 Active 133 DOM
-
2026-03-25price $185,500
-
2026-01-17$189,900 Active
ⓘ Source: listings_history table (triggers on properties + properties_extension) + one-shot
backfill from property_details.listing_events for pre-trigger history.
Nearby sold comps map
Loading sold comps map…
Walkable amenities ~0.75 mi
Loading nearby amenities…
Taxation est. · year 1
- Rental income
- $31,016
- − Mortgage interest
- −$10,055
- − Property taxes
- −$2,692
- − Insurance
- −$898
- − Repairs & maintenance
- −$2,481
- − Management
- −$2,481
- − Depreciation
- −$5,222
- Taxable income
- $7,186
- Est. tax owed @ 24.0%
- −$1,725
- After-tax cash flow
- $7,892/yr
For passive investors: Depreciation is non-cash, so a rental often shows a tax loss while cash-flowing — sheltering income. Rental losses are passive: they offset passive income freely, and up to $25,000/yr can offset ordinary (W-2) income if you actively participate and your MAGI is under $100k (phasing out to $0 by $150k); unused losses carry forward. On sale, claimed depreciation is recaptured at up to 25%, and gains may owe capital-gains tax (a 1031 exchange can defer both). Figures are a year-1 estimate at your 24.0% rate — not tax advice; consult a CPA.
Schools (NCES district)
- District
- Sedona-Oak Creek JUSD #9 (4467)
- NCES district ID
- 0409733
- Math proficiency
- 12% ▼ -12.00%
- Reading proficiency
- 21% ▼ -12.00%
- Median HH income
- $52,988
- Composite
- 15.27/100
- National rank
- #9332
- State rank
- #197 of 249 in AZ
Livability — Sedona
- Score
- 68/100
- State rank
- #55
- US rank
- #9645
Category grades
Schools grade is shown separately in the Schools card above.
Census & demographics
- Census place
- Sedona, AZ
- County
- Yavapai County · 190,406 people
- City population
- 18,102
- Metro
- Prescott Valley-Prescott, AZ
- Population (ZIP)
- 11,381
- Household income
- $68,435
- Rent vs Own
- Severe rent burden
- 239.0
Population outlook (Yavapai County) Hauer SSP2
- Today (2025)
- 241,389 people
- By 2030
- 249,523 · +3.4%
- By 2040
- 259,966 · +7.7%
- By 2050
- 264,736 · +9.7%
- By 2075
- 269,334 · +11.6%
- By 2100
- 256,505 · +6.3%
Race, ethnicity, and origin ACS 2023
- Neighborhood character
- Predominantly White (75%)
- Race & ethnicity
- White 75% Hispanic / Latino 19% Two or more races 7% Asian 3% Native American 1%
- Hispanic origin (detail)
- Mexican 16%
- Common ancestry
- Slovak 4% Lithuanian 3% Romanian 3%
- Foreign-born
- 17% · Canada, China
- Languages at home
- 78% English-only · Spanish 16% Russian/Polish/Slavic 2% French/Haitian/Cajun 1%
Political lean MEDSL · Yavapai
- 2024 margin
- Solid R (+33.9) · D 32.6% · R 66.5%
- 2008→2024 swing
- -9.5pp toward R · 2008: -24.4pp · 2024: -33.9pp
- All cycles
- 2024: R+33.9 2020: R+29.3 2016: R+31.4 2012: R+30.7 2008: R+24.4
Not yet ingested
- Civics
- —
Market trends
- HPI YoY
- ▼ -144.06%
- Current HPI
- 408.6459
- Rent YoY
- ▼ -1.29%
- Metro
- Prescott Valley-Prescott, AZ
- State GDP YoY
- ▲ 4.54%
- F500 in state
- 20
Industry mix (Fortune 500 HQ in AZ)
| Industry | F500 HQs | Revenue |
|---|---|---|
| Technology | 2 | $13B |
|
||
| Mining / Metals | 1 | $23B |
|
||
| Environmental Services | 1 | $16B |
|
||
| Metals / Steel | 1 | $14B |
|
||
| Technology Distribution | 1 | $9B |
|
||
| Homebuilding | 1 | $8B |
|
||
Price history
-2.3% since first listed2 events — show timeline
- 2026-03-25 Price Changed $185,500 ARMLS
- 2026-01-17 Listed $189,900 ARMLS
Cash-flow waterfall
monthlySold comps — $/sqft
last 12 mo · ≤1 miLoading sold comps…