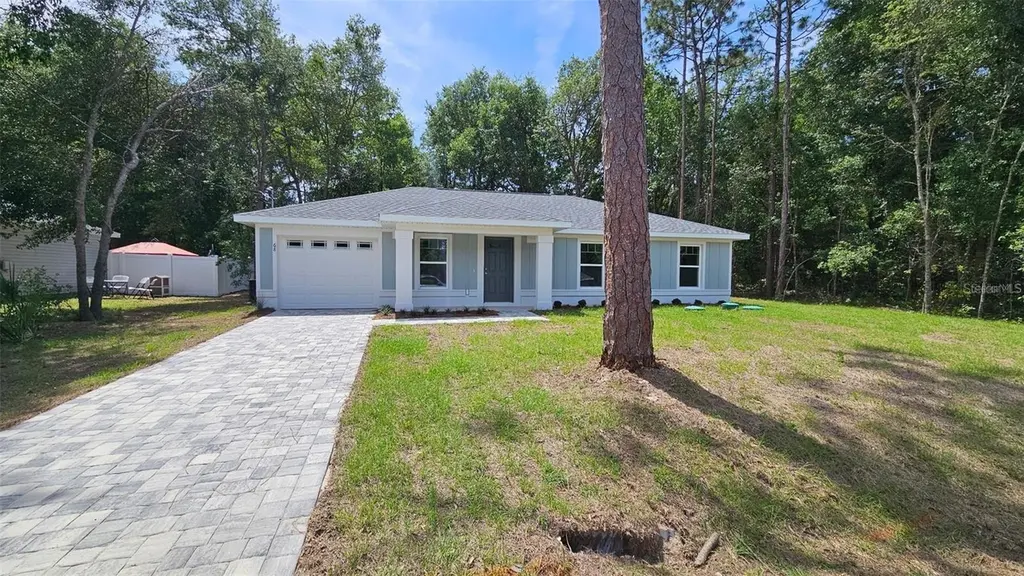
23 Oak Cir · Silver Springs Shores, FL
Flood risk 1/10 · Minimal
- FEMA flood zone
- X (unshaded)
- Chance of flooding over 30 yrs
- 0.0%
- Est. flood insurance / yr
- $507 – $1,088
Fire risk 5/10 · Moderate
- Est. fire insurance / yr
- $947 – $1,759
Heat risk 9/10 · Severe
- Hot days now (above 108°F)
- 7 days/yr
- Hot days in 30 yrs
- 23 days/yr
Wind risk 9/10 · Severe
- Chance of severe wind over 30 yrs
- 99.0%
Air-quality risk 3/10 · Minor
- Unhealthy air days now
- 3 days/yr
- Unhealthy air days in 30 yrs
- 4 days/yr
Risk factors via First Street. Map © Google.
Why this score? — see what drove the F grade
The composite is a weighted blend of 9 inputs, each scored 0–100. Each bar is that input's sub-score; the figure is the points it added to the 100-point composite (weight × sub-score).
- Appreciation +8.0/10.0
- Cash flow +7.3/30.0
- Schools +3.6/10.0
- Livability +3.4/5.0
- Rent growth +2.5/5.0
- Condition / age +2.5/5.0
- DSCR +1.4/10.0
- 1% rule +1.3/10.0
- ARV discount +0.0/15.0
$239,900
🖨 Deal sheet (PDF) 📄 Offer letter ✓ Due diligence
Listing remarks MLS
Charming 3 bedroom 1 and a half baths located on a very large corner lot in the desirable Silver Springs Shores subdivision. This property features nice tile flooring, a brand new granite kitchen, central AC and is located on a 1/4 acre lot. Priced to sell in an area with no availability. Very minor HOA dues of $145/Annually with approval required.
Key facts
- Quartz counters
- New construction
- Open layout
Tags
Property features AI
Finance
- Other: Lot approximately 0.23 acres (80 x 126); Permit number 2025102585; Zoning: R1
Exterior
- Parking: Attached garage (1-car) with an 11x28 dimension
- Utilities: Well water; Aerobic septic system; Electricity available
- Home design: Single-family residence; One story; East-facing entry; New construction; Completed condition
- Construction: Block and stucco construction; Shingle roof; Slab foundation; Built by AL Milton Construction (model: Aubrie)
- Exterior features: Sidewalk; Sliding doors; Cleared lot; Paved road access; Vinyl fencing
Interior
- Kitchen: Dishwasher; Microwave; Range; Refrigerator
- Bedrooms: 3 bedrooms
- Bathrooms: 2 full bathrooms
- Heating & cooling: Electric heating; Central air conditioning
- Interior features: Cathedral ceilings; Ceiling fans; Stone countertops; Double pane windows
- Laundry & utility: Laundry located in the garage
Neighborhood map
What this means for you Summary
Snapshot
- This is a 3-bed/1.5-bath single-family listed at $240k.
Deal economics
- At list price, monthly cash flow is $-324 ($-4k/yr) — negative.
- To cash-flow at today's rent, offer at most $183k (23.9% below list).
- To meet the 1% rule (rent ≥ 1% of price), the offer needs to be $152k (36.7% below list).
- Recommended offer: $152k (36.7% below list) — sets the bar for 1% rule.
Location & tenants
- Location reads 68/100 on livability (#527 in FL) — a middle-class / working-renter tenant base. Strengths: cost of living A+, housing A+, health & safety A-; Watch: crime C-, employment D, amenities F.
- Marion (rural): math 42% / reading 43% proficiency, ranked #61 of 73 in FL (top 84%) — families likely to look elsewhere, expect single-tenant / working-renter base with shorter leases; 61% free/reduced lunch — lower-income household profile, screen leases tightly.
- Zoned schools: Emerald Shores Elementary School (math 30% / reading 34%, grade F, #1,797 of 2,144 statewide, top 86%, 666 students, 74% FRL); Lake Weir Middle School (math 37% / reading 33%, grade F, #416 of 571 statewide, top 74%, 1,207 students, 76% FRL); Lake Weir High School (math 23% / reading 34%, grade F, #458 of 667 statewide, top 69%, 1,483 students, 68% FRL).
- Market conditions: Rents flat; 683 active listings in the ZIP; 10 comparable units currently listed for rent nearby; rentals at typical pace (median 23d on market — plan ~3-4 weeks tenant-placement turnaround); 7,071 units permitted in Marion County in 2024 (534 in 5+ unit buildings).
Forward outlook
- In year one you build about $16k of equity ($2k loan paydown + $14k appreciation (5.9% local appreciation)).
- Marion County population projected at +13% by 2050 — modest demand growth; plan on rents tracking national, not racing it.
- By year 3, paydown + projected appreciation supports a ~$39k cash-out refi (75% LTV) — recoverable capital for the next deal without selling this one.
Negotiation context
- It's been on market 33 days — a 3% lower offer ($233k) is reasonable based on typical stale-listing flexibility.
- 3 sale attempts since 5y ago with the ask held roughly flat each time — persistent listings suggest the price (not the market) is what's stuck; bring a comps-based counter.
- Current owner paid $160k; 50% above their basis — modest negotiation headroom, anchor on the comps not their cost.
Risks & watch-outs
- Climate carrying-cost: severe wind risk, 99% chance of damaging wind over 30y; moderate wildfire risk; extreme-heat days projected 7→23/yr by 2055 (HVAC capex compounding) — expect insurance premiums to compound above CPI over the hold.
Questions for the listing agent
- What do current leases actually rent for vs. the listed asking? Can we see a recent rent roll and the last 12 months of T-12 income?
- It's been on market 33 days. Have you received any prior offers? Is the seller open to a 37% concession, seller financing, or rate buy-down credit?
- Is there a deadline driving the sale (1031 exchange, divorce, estate, relocation)? That informs how much negotiation room exists.
- Schools are F-rated, which usually means shorter tenancies and higher turnover. Who's the typical renter profile here, and what's been the actual vacancy rate?
- The area grade is low — what's the realistic commute time and amenity access for the typical tenant pool here? Any planned neighborhood developments (good or bad) we should know about?
- What's the average days-on-market for RENTAL listings here right now (not sales)? A rising rental-DOM trend means longer vacancies and softer asking-rent achievability than the comps imply.
- What's the recent tenant-quality profile in this submarket — average credit score on applications, eviction rate, late-payment / NSF rate, and stable-employment percentage? A property-management company in the area should have these aggregated.
- How much new for-sale + rental construction is in the pipeline within 1–3 miles? Heavy new supply typically softens prices + rents 12–24 months out; constrained supply supports both.
Investment metrics
- 1% rule
- 0.63% ✗
- Cap rate
- 4.67%
- Cash-on-cash
- -5.79%
- DSCR
- 0.74
- GRM
- 13.2
CMA / ARV
- ARV (on-the-fly)
- $166,896
- Comps found
- 3
Show comp detail 3 sales within ~0.75 mi
| Address | Dist | Beds/Ba | Sqft | Sold | Price | $/sf | Match |
|---|---|---|---|---|---|---|---|
| 9 Oak Court Pass | 0.09mi | 3/2.0 | 888 (-3%) | 21mo | $205,000 | $231 | 72 |
| 9021 SE 79th Avenue Rd | 0.46mi | 2/1.0 (-1) | 900 (-1%) | 14mo | $165,000 | $183 | 57 |
| 8856 SE 87th Ter | 0.69mi | 2/1.0 (-1) | 912 (0%) | 23mo | $149,000 | $163 | 42 |
Match score weights: distance 35% · size 25% · config 20% · recency 20%. Top-matched comps best support the ARV.
Projected returns pro-forma
5.93% appreciation · 0.17% rent growth · sell at horizon
- IRR
- 9.6%
- Equity multiple
- 1.65×
- Total profit
- $43,406
- Equity at exit
- $149,790
- IRR
- 10.3%
- Equity multiple
- 3.03×
- Total profit
- $136,371
- Equity at exit
- $270,759
Cash invested: $67,172 (down + closing). Projections, not guarantees.
Landlord ↔ Tenant lean methodology
- Overall (STATE)
- 87 Strongly Landlord-Friendly
- State Florida
- 87 Strongly Landlord-Friendly · R+3
- County
- — inherits STATE
- City
- — inherits STATE
ZIP-level market 34472
- Home prices YoY
- 2.4%
- Rents YoY
- 0.2%
- Active inventory
- 683
- Price-to-rent
- 13.2×
Monthly cashflow live
- Estimated rent
- $1,518 high interval (Pro) →
- Mortgage (P&I)
- −$1,258
- Tax from tax record
- −$165 /mo · $1,980/yr
- Insurance
- −$100
- HOA
- −$0
- Vacancy / Maint / Mgmt
- −$319
- Net cashflow
- $-324
Break-even live
Sensitivity live
| Price | -10% $-188 | -5% $-256 | +0% $-324 | +5% $-392 | +10% $-460 |
|---|---|---|---|---|---|
| Rent | -10% $-444 | -5% $-384 | +0% $-324 | +5% $-264 | +10% $-204 |
| Rate | -1.0pp $-203 | -0.5pp $-263 | base $-324 | +0.5pp $-386 | +1.0pp $-449 |
UW: 25.0% down · 7.5% · 30yr · 1.5% tax · 5.0% vac · 8.0% maint · 8.0% mgmt
Financing live
Cash to close
- Down payment
- $59,975
- Closing costs
- $7,197
- Reserves months
- —
- Total cash needed
- —
Loan-product check · same deal, 3 products live
Conventional
25% down · 7.5% · 30yr
- Down + closing
- —
- Monthly P&I
- —
- Monthly cashflow
- —
- DSCR
- —
- Eligible?
- —
Personal DTI + credit; lowest rate.
DSCR
20% down · 8.5% · 30yr
- Down + closing
- —
- Monthly P&I
- —
- Monthly cashflow
- —
- DSCR
- —
- Eligible?
- —
No personal income docs; deal must DSCR.
Hard money
10% down · 12.0% · 12mo
- Down + closing
- —
- Monthly P&I
- —
- Monthly cashflow
- —
- DSCR
- —
- Eligible?
- —
Short-term bridge; refi at stabilization.
Rent comps 10 comps
| Address | Beds | Baths | Sqft | Rent | $/sqft | DOM | Units | Dist |
|---|---|---|---|---|---|---|---|---|
| 310 Oak Lane Pass Ocala, FL | 2.0 | 2.0 | 988 | $1,325 | $1.34 | 23d | 1 | 0.77mi |
| 2 Ash Dr Ocala, FL | 3.0 | 2.0 | 1083 | $1,750 | $1.62 | 15d | 1 | 1.09mi |
| 62 Pine Trak Ocala, FL | 2.0 | 2.0 | 832 | $1,250 | $1.50 | 23d | 1 | 1.10mi |
| 58 Pine Trak Unit 104D Ocala, FL | 2.0 | 2.0 | 832 | $1,050 | $1.26 | 23d | 1 | 1.14mi |
| 12 Spring Loop Ocala, FL | 2.0 | 1.0 | 900 | $1,350 | $1.50 | 15d | 1 | 1.18mi |
| 54 Pine Trak Unit 104F Ocala, FL | 2.0 | 2.0 | 832 | $1,300 | $1.56 | 23d | 1 | 1.19mi |
| 217 Locust Pass Ln Ocala, FL | 3.0 | 2.0 | 1011 | $1,697 | $1.68 | 15d | 1 | 1.26mi |
| 681 Midway Dr Unit A Ocala, FL | 2.0 | 2.0 | 1000 | $1,250 | $1.25 | 23d | 1 | 1.44mi |
| 681 Midway Dr Unit A Ocala, FL | 2.0 | 2.0 | 1000 | $1,250 | $1.25 | 15d | 1 | 1.44mi |
| 633 Silver Pass Unit B Ocala, FL | 2.0 | 2.0 | 1072 | $1,500 | $1.40 | 23d | 1 | 1.48mi |
Listing history 24 events
-
2026-06-21days on market $239,900 Active 33 DOM
-
2026-06-18days on market $239,900 Active 30 DOM
-
2026-06-17days on market $239,900 Active 29 DOM
-
2026-06-16days on market $239,900 Active 28 DOM
-
2026-06-15days on market $239,900 Active 27 DOM
-
2026-06-14days on market $239,900 Active 25 DOM
-
2026-06-13days on market $239,900 Active 24 DOM
-
2026-06-10days on market $239,900 Active 22 DOM
-
2026-06-09days on market $239,900 Active 21 DOM
-
2026-06-08days on market $239,900 Active 20 DOM
-
2026-06-07days on market $239,900 Active 19 DOM
-
2026-06-03days on market $239,900 Active 15 DOM
-
2026-06-02days on market $239,900 Active 14 DOM
-
2026-06-01days on market $239,900 Active 13 DOM
-
2026-05-31days on market $239,900 Active 12 DOM
-
2026-05-30days on market $239,900 Active 11 DOM
-
2026-05-19$239,900 Active
-
2021-12-27soldstatus $160,000 Closed 350-char remark
Show marketing remark (350 chars)
Charming 3 bedroom 1 and a half baths located on a very large corner lot in the desirable Silver Springs Shores subdivision. This property features nice tile flooring, a brand new granite kitchen, central AC and is located on a 1/4 acre lot. Priced to sell in an area with no availability. Very minor HOA dues of $145/Annually with approval required.
-
2021-11-17status Pending 350-char remark
Show marketing remark (350 chars)
Charming 3 bedroom 1 and a half baths located on a very large corner lot in the desirable Silver Springs Shores subdivision. This property features nice tile flooring, a brand new granite kitchen, central AC and is located on a 1/4 acre lot. Priced to sell in an area with no availability. Very minor HOA dues of $145/Annually with approval required.
-
2021-11-04status Active 350-char remark
Show marketing remark (350 chars)
Charming 3 bedroom 1 and a half baths located on a very large corner lot in the desirable Silver Springs Shores subdivision. This property features nice tile flooring, a brand new granite kitchen, central AC and is located on a 1/4 acre lot. Priced to sell in an area with no availability. Very minor HOA dues of $145/Annually with approval required.
-
2021-10-29status Pending 350-char remark
Show marketing remark (350 chars)
Charming 3 bedroom 1 and a half baths located on a very large corner lot in the desirable Silver Springs Shores subdivision. This property features nice tile flooring, a brand new granite kitchen, central AC and is located on a 1/4 acre lot. Priced to sell in an area with no availability. Very minor HOA dues of $145/Annually with approval required.
-
2021-10-25$159,990 Active 350-char remark
Show marketing remark (350 chars)
Charming 3 bedroom 1 and a half baths located on a very large corner lot in the desirable Silver Springs Shores subdivision. This property features nice tile flooring, a brand new granite kitchen, central AC and is located on a 1/4 acre lot. Priced to sell in an area with no availability. Very minor HOA dues of $145/Annually with approval required.
-
2021-08-23soldstatus $80,000
-
1985-03-01soldstatus $74,555
ⓘ Source: listings_history table (triggers on properties + properties_extension) + one-shot
backfill from property_details.listing_events for pre-trigger history.
Tax reassessment forecast FL · Resets to sale price
- Current annual tax
- $1,980 · $165/mo
- Projected year-2 tax
- $1,991 · $166/mo
- Expected delta
- +$11/yr (+$1/mo · 0.6%)
ⓘ Screening estimate from a state-policy table — verify with the county assessor before closing.
Climate risk First Street
- Flood 1/10 Low FEMA zone X (unshaded) · 0% chance over 30 yrs
- Wildfire 5/10 Major
- Heat 9/10 Extreme 7 d/yr ≥108°F today · 23 d/yr by 30 yrs out
- Wind 9/10 Extreme 99% chance of damaging wind over 30 yrs
- Air quality 3/10 Moderate 3 unhealthy d/yr today · 4 by 30 yrs out
Nearby sold comps map
Loading sold comps map…
Walkable amenities ~0.75 mi
Loading nearby amenities…
Taxation est. · year 1
- Rental income
- $18,213
- − Mortgage interest
- −$13,438
- − Property taxes
- −$1,980
- − Insurance
- −$1,200
- − Repairs & maintenance
- −$1,457
- − Management
- −$1,457
- − Depreciation
- −$6,979
- Taxable loss
- −$8,298
- Est. tax savings @ 24.0%
- +$1,991
- After-tax cash flow
- $-1,897/yr
For passive investors: Depreciation is non-cash, so a rental often shows a tax loss while cash-flowing — sheltering income. Rental losses are passive: they offset passive income freely, and up to $25,000/yr can offset ordinary (W-2) income if you actively participate and your MAGI is under $100k (phasing out to $0 by $150k); unused losses carry forward. On sale, claimed depreciation is recaptured at up to 25%, and gains may owe capital-gains tax (a 1031 exchange can defer both). Figures are a year-1 estimate at your 24.0% rate — not tax advice; consult a CPA.
Schools (NCES district)
- District
- Marion
- NCES district ID
- 1201260
- Math proficiency
- 42% ▼ -7.00%
- Reading proficiency
- 43% ▼ -4.00%
- Median HH income
- $40,015
- Composite
- 35.61/100
- National rank
- #4890
- State rank
- #61 of 73 in FL
Livability — Silver Springs Shores
- Score
- 68/100
- State rank
- #527
- US rank
- #9854
Category grades
Schools grade is shown separately in the Schools card above.
Census & demographics
- Census place
- Silver Springs Shores, FL
- County
- Marion County · 315,796 people
- City population
- 34,665
- Metro
- Ocala, FL
- Population (ZIP)
- 35,851
- Household income
- $64,208
- Rent vs Own
- Severe rent burden
- 655.0
Population outlook (Marion County) Hauer SSP2
- Today (2025)
- 365,905 people
- By 2030
- 376,768 · +3.0%
- By 2040
- 396,555 · +8.4%
- By 2050
- 412,723 · +12.8%
- By 2075
- 446,090 · +21.9%
- By 2100
- 436,193 · +19.2%
Race, ethnicity, and origin ACS 2023
- Neighborhood character
- Diverse neighborhood (Simpson 0.65)
- Race & ethnicity
- White 50% Hispanic / Latino 25% Black 21% Two or more races 18% Asian 2%
- Hispanic origin (detail)
- Mexican 2% Puerto Rican 14% Cuban 3%
- Common ancestry
- Romanian 2% Iranian 1% Lithuanian 1%
- Foreign-born
- 11% · Canada, Jamaica, China
- Languages at home
- 78% English-only · Spanish 19% Other Indo-European 1%
Political lean MEDSL · Marion
- 2024 margin
- Solid R (+31.6) · D 33.8% · R 65.5%
- 2008→2024 swing
- -20.0pp toward R · 2008: -11.6pp · 2024: -31.6pp
- All cycles
- 2024: R+31.6 2020: R+25.9 2016: R+26.2 2012: R+16.2 2008: R+11.6
Not yet ingested
- Civics
- —
Market trends
- HPI YoY
- ▲ 5.93%
- Current HPI
- 255.0714
- Rent YoY
- ▲ 0.17%
- Metro
- Ocala, FL
- State GDP YoY
- ▲ 3.28%
- F500 in state
- 36
Industry mix (Fortune 500 HQ in FL)
| Industry | F500 HQs | Revenue |
|---|---|---|
| Industrial Technology | 2 | $29B |
|
||
| Insurance | 2 | $17B |
|
||
| Retail | 1 | $60B |
|
||
| Technology Distribution | 1 | $58B |
|
||
| Homebuilding | 1 | $35B |
|
||
| Technology Manufacturing | 1 | $35B |
|
||
Price history
+221.8% since first listed8 events — show timeline
- 2026-05-19 Listed $239,900 Stellar MLS as Distributed by MLS Grid
- 2021-12-27 Sold (MLS) $160,000 Stellar MLS as Distributed by MLS Grid
- 2021-11-17 Pending — Stellar MLS as Distributed by MLS Grid
- 2021-11-04 Relisted — Stellar MLS as Distributed by MLS Grid
- 2021-10-29 Pending — Stellar MLS as Distributed by MLS Grid
- 2021-10-25 Listed $159,990 Stellar MLS as Distributed by MLS Grid
- 2021-08-23 Sold (Public Records) $80,000 Public Records
- 1985-03-01 Sold (Public Records) $74,555 Public Records
Property tax history
+7.1%/yrLatest (2025): $1,980 · +14.2% YoY. Source: county tax records.
Cash-flow waterfall
monthlySold comps — $/sqft
last 12 mo · ≤1 miLoading sold comps…