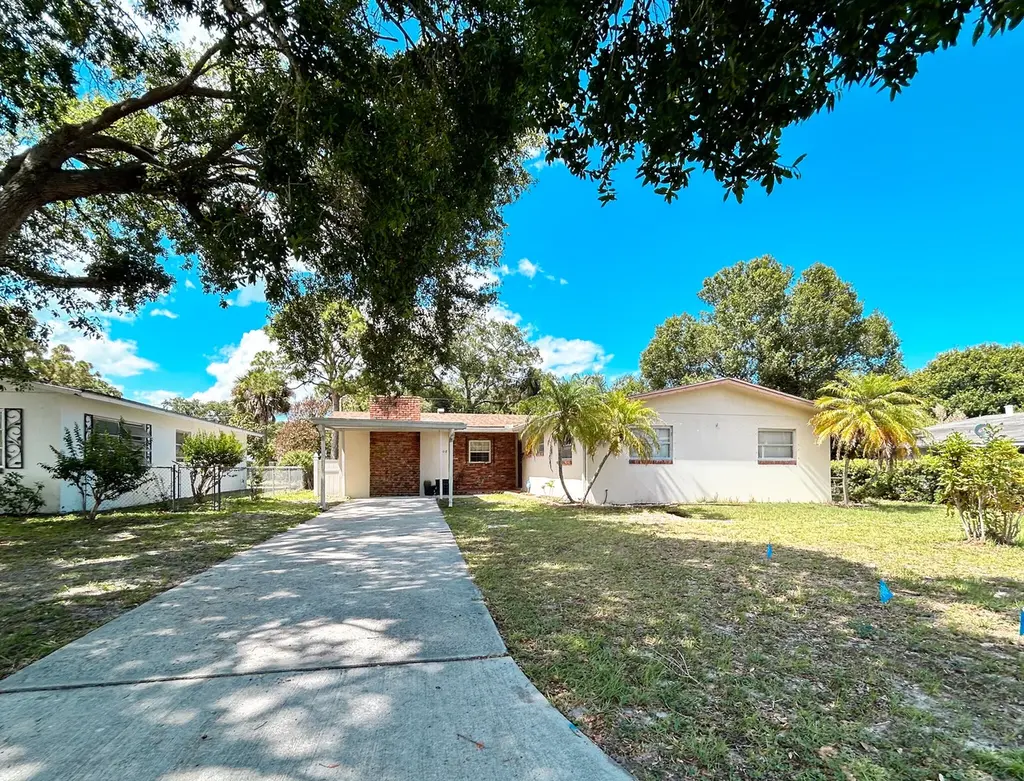
1308 Kentucky Ave · Fort Pierce, FL
Flood risk 1/10 · Minimal
- FEMA flood zone
- X (unshaded)
- Chance of flooding over 30 yrs
- 0.0%
- Est. flood insurance / yr
- $507 – $1,088
Fire risk 1/10 · Minimal
- Est. fire insurance / yr
- $947 – $1,759
Heat risk 10/10 · Severe
- Hot days now (above 106°F)
- 7 days/yr
- Hot days in 30 yrs
- 25 days/yr
Wind risk 10/10 · Severe
- Chance of severe wind over 30 yrs
- 99.0%
Air-quality risk 2/10 · Minimal
- Unhealthy air days now
- 1 days/yr
- Unhealthy air days in 30 yrs
- 1 days/yr
Risk factors via First Street. Map © Google.
Why this score? — see what drove the B grade
The composite is a weighted blend of 9 inputs, each scored 0–100. Each bar is that input's sub-score; the figure is the points it added to the 100-point composite (weight × sub-score).
- Cash flow +27.1/30.0
- ARV discount +15.0/15.0
- DSCR +9.4/10.0
- 1% rule +6.2/10.0
- Rent growth +4.0/5.0
- Livability +3.8/5.0
- Schools +3.7/10.0
- Condition / age +2.5/5.0
- Appreciation +0.0/10.0
$189,900
🖨 Deal sheet 📄 Offer letter ✓ Due diligence
Listing remarks
Fort Pierce pool home with endless potential! This 3BR/2BA CBS home offers 1,786 living sq ft and a flexible floor plan ideal for homeowners, investors, or buyers looking to personalize a property in a convenient Treasure Coast location. Features include spacious living areas, abundant natural light, screened-in pool, covered patio, and converted garage perfect for a flex room, office, gym, media room, or additional living space. Primary bathroom remodeled in 2024 and A/C replaced in 2025. Large backyard with space for entertaining and relaxing. Located just minutes from downtown Fort Pierce, beaches, restaurants, shopping, parks, marinas, boat ramps, US-1, and I-95. Property sold AS-IS.
Key facts
- Flexible floor plan
- Large backyard
- Converted garage
Tags
Property features AI
Finance
- Other: Building area approximately 2,326 (per public records); Living area approximately 1,786 (per public records); Property listed as having private pool and parking details
Exterior
- Parking: Attached carport (1 covered space); Driveway; Concrete surfaces
- Security: Security system
- Utilities: Public water; Public sewer; Electricity connected; Water and sewer connected
- Home design: Single-family residence; One story; Resale condition; Faces south; City street frontage
- Construction: Stucco and CBS construction; Shingle roof; Built with typical foundation (public records)
- Exterior features: Screened patio; Patio; Back yard fencing; Private in-ground pool with screen enclosure; Paved road frontage; No waterfront
Interior
- Kitchen: Dishwasher; Electric range; Microwave; Refrigerator
- Bedrooms: Three bedrooms on the main level
- Flooring: Carpet; Terrazzo; Vinyl; Other flooring
- Bathrooms: Two full bathrooms on the main level
- Heating & cooling: Central electric heating; Central air conditioning; Ceiling fans
- Interior features: Bedroom layout with stacked configuration; Partially furnished; Satellite dish; Electric fireplace
- Laundry & utility: Indoor laundry on the main level
Neighborhood map
What this means for you Summary
Snapshot
- This is a 3-bed/2.0-bath single-family listed at $190k.
Deal economics
- At list price, monthly cash flow is $539 ($6k/yr) — positive.
- The deal already cash-flows at list — no discount required.
- Meets the 1% rule at list price ($2k rent vs $190k).
- Cap rate 9.7% vs local median 3.7% in Fort Pierce — top-decile yield for the area; either an underpriced asset or a hidden risk that comps aren't pricing in. Stress-test before assuming the spread holds.
Location & tenants
- Location reads 76/100 on livability (#226 in FL, #3,360 nationally) — a middle-class / working-renter tenant base. Strengths: commute A+, cost of living A+, housing A+; Watch: crime D+, schools D, amenities F.
- St. Lucie (urban): math 40% / reading 48% proficiency, ranked #51 of 73 in FL (top 70%) — families likely to look elsewhere, expect single-tenant / working-renter base with shorter leases.
- Market conditions: Rents rising fast (+5.9%/yr); 165 active listings in the ZIP; 17 comparable units currently listed for rent nearby; rentals at typical pace (median 23d on market — plan ~3-4 weeks tenant-placement turnaround); lower-income renter base — watch delinquency; 4,868 units permitted in St. Lucie County in 2024 (268 in 5+ unit buildings).
- At $2,128/mo this rent would consume 84% of the median local household income ($30k/yr) (locally 1995% of renters already pay >50% of income on rent) — very limited rent-growth headroom before tenants either downsize or default.
Forward outlook
- Local home prices are declining (-3.0%/yr); year-one equity from $1k of loan paydown is wiped out by about $6k of value loss. Plan a longer hold.
- St. Lucie County population projected at +20% by 2050 — long-run rental-demand tailwind backs the buy-and-hold thesis.
- At projected returns (-3.0% appreciation + 5.9% rent growth), your $53k cash investment doubles in ~8 years — after that, you're playing with house money.
Negotiation context
- Only 4 days on market — expect competitive offers; lowballing is unlikely to land.
Risks & watch-outs
- Climate carrying-cost: severe wind risk, 99% chance of damaging wind over 30y; extreme-heat days projected 7→25/yr by 2055 (HVAC capex compounding) — expect insurance premiums to compound above CPI over the hold.
Questions for the listing agent
- Built in 1965 — when were the roof, HVAC, electrical panel, plumbing, and water heater last replaced?
- Is there a deadline driving the sale (1031 exchange, divorce, estate, relocation)? That informs how much negotiation room exists.
- Schools are D-rated, which usually means shorter tenancies and higher turnover. Who's the typical renter profile here, and what's been the actual vacancy rate?
- Crime grade is D in this area — have there been break-ins, vandalism, or insurance claims at this property in the last 3 years? What carrier currently insures it and at what premium?
- What's the average days-on-market for RENTAL listings here right now (not sales)? A rising rental-DOM trend means longer vacancies and softer asking-rent achievability than the comps imply.
- What's the recent tenant-quality profile in this submarket — average credit score on applications, eviction rate, late-payment / NSF rate, and stable-employment percentage? A property-management company in the area should have these aggregated.
- How much new for-sale + rental construction is in the pipeline within 1–3 miles? Heavy new supply typically softens prices + rents 12–24 months out; constrained supply supports both.
Investment metrics
- 1% rule
- 1.12% ✓
- Cap rate
- 9.70%
- Cash-on-cash
- 12.17%
- DSCR
- 1.54
- GRM
- 7.4
CMA / ARV
- ARV (on-the-fly)
- $351,842
- Comps found
- 2
Show comp detail 2 sales within ~0.75 mi
| Address | Dist | Beds/Ba | Sqft | Sold | Price | $/sf | Match |
|---|---|---|---|---|---|---|---|
| 1003 Georgia | 0.36mi | 3/2.0 | 1,920 (+8%) | 23mo | $325,000 | $169 | 52 |
| 1007 Mayflower Rd | 0.63mi | 4/2.0 (+1) | 1,550 (-13%) | 18mo | $305,000 | $197 | 28 |
Match score weights: distance 35% · size 25% · config 20% · recency 20%. Top-matched comps best support the ARV.
Projected returns pro-forma
-3.0% appreciation · 5.94% rent growth · sell at horizon
- IRR
- 4.7%
- Equity multiple
- 1.19×
- Total profit
- $9,995
- Equity at exit
- $28,315
- IRR
- 16.5%
- Equity multiple
- 2.52×
- Total profit
- $80,901
- Equity at exit
- $16,419
Cash invested: $53,172 (down + closing). Projections, not guarantees.
Landlord ↔ Tenant lean methodology
- Overall (STATE)
- 87 Strongly Landlord-Friendly
- State Florida
- 87 Strongly Landlord-Friendly · R+3
- County
- — inherits STATE
- City
- — inherits STATE
ZIP-level market 34950
- Home prices YoY
- -20.2%
- Rents YoY
- 5.9%
- Active inventory
- 165
- Price-to-rent
- 7.4×
Monthly cashflow live
- Estimated rent
- $2,128 high interval (Pro) →
- Mortgage (P&I)
- −$996
- Tax from tax record
- −$67 /mo · $804/yr
- Insurance
- −$79
- HOA
- −$0
- Vacancy / Maint / Mgmt
- −$447
- Net cashflow
- $539
Break-even live
UW: 25.0% down · 7.5% · 30yr · 1.5% tax · 5.0% vac · 8.0% maint · 8.0% mgmt
Financing live
Cash to close
- Down payment
- $47,475
- Closing costs
- $5,697
- Reserves months
- —
- Total cash needed
- —
Loan-product check · same deal, 3 products live
Conventional
25% down · 7.5% · 30yr
- Down + closing
- —
- Monthly P&I
- —
- Monthly cashflow
- —
- DSCR
- —
- Eligible?
- —
Personal DTI + credit; lowest rate.
DSCR
20% down · 8.5% · 30yr
- Down + closing
- —
- Monthly P&I
- —
- Monthly cashflow
- —
- DSCR
- —
- Eligible?
- —
No personal income docs; deal must DSCR.
Hard money
10% down · 12.0% · 12mo
- Down + closing
- —
- Monthly P&I
- —
- Monthly cashflow
- —
- DSCR
- —
- Eligible?
- —
Short-term bridge; refi at stabilization.
Rent comps 17 comps
| Address | Beds | Baths | Sqft | Rent | $/sqft | DOM | Units | Dist |
|---|---|---|---|---|---|---|---|---|
| 1433 Captains Walk Unit A Fort Pierce, FL | 2.0 | 2.0 | 1850 | $2,500 | $1.35 | 23d | 1 | 0.10mi |
| 1439 Captains Walk Unit 20D Fort Pierce, FL | 2.0 | 2.0 | 1280 | $2,000 | $1.56 | 21d | 1 | 0.14mi |
| 1567 Pheasant Walk Unit B Fort Pierce, FL | 2.0 | 2.0 | 1280 | $1,900 | $1.48 | 13d | 1 | 0.27mi |
| 1800 Nebraska Ave Unit 202 Fort Pierce, FL | 2.0 | 2.0 | 1312 | $1,749 | $1.33 | 23d | 1 | 0.28mi |
| 1701 Sunrise Blvd Fort Pierce, FL | 3.0 | 2.0 | 1518 | $2,000 | $1.32 | 13d | 1 | 0.44mi |
| 501 Wendell Rd Unit A Fort Pierce, FL | 2.0 | 1.0 | 1920 | $1,790 | $0.93 | 23d | 1 | 0.65mi |
| 308 S 8th St Fort Pierce, FL | 2.0 | 2.0 | 1696 | $1,900 | $1.12 | 23d | 1 | 0.76mi |
| 318 N 24th St Fort Pierce, FL | 3.0 | 2.5 | 1952 | $2,600 | $1.33 | 23d | 1 | 1.18mi |
| 2008 S 30th St Fort Pierce, FL | 3.0 | 2.0 | 1505 | $2,450 | $1.63 | 13d | 1 | 1.20mi |
| 513 N 9th St Unit B Fort Pierce, FL | 3.0 | 2.0 | 1250 | $2,300 | $1.84 | 23d | 1 | 1.25mi |
| 20 Orange Ave Fort Pierce, FL | 2.0 | 2.0 | 1228 | $3,025 | $2.46 | 23d | 2 | 1.27mi |
| 2101 Linda Sue Cir Fort Pierce, FL | 2.0 | 1.5 | 1300 | $1,750 | $1.35 | 23d | 1 | 1.36mi |
| 704 N 18th St Unit B Fort Pierce, FL | 2.0 | 1.0 | 1352 | $1,700 | $1.26 | 23d | 1 | 1.39mi |
| 1102 Avenue G Fort Pierce, FL | 3.0 | 1.5 | 1870 | $1,800 | $0.96 | 23d | 1 | 1.43mi |
| 2100 S 34th St Fort Pierce, FL | 3.0 | 2.0 | 1262 | $2,200 | $1.74 | 23d | 1 | 1.44mi |
| 815 Dundas Ct Unit B Fort Pierce, FL | 2.0 | 1.0 | 1323 | $1,400 | $1.06 | 13d | 1 | 1.46mi |
| 2811 Stoneway Ln Unit 2811A Fort Pierce, FL | 2.0 | 2.0 | 1274 | $1,700 | $1.33 | 13d | 1 | 1.49mi |
Listing history 2 events
-
2026-05-21status Pending
-
2026-05-17$189,900 Active
ⓘ Source: listings_history table (triggers on properties + properties_extension) + one-shot
backfill from property_details.listing_events for pre-trigger history.
Tax reassessment forecast FL · Resets to sale price
- Current annual tax
- $804 · $67/mo
- Projected year-2 tax
- $1,576 · $131/mo
- Expected delta
- +$773/yr (+$64/mo · 96.1%)
ⓘ Screening estimate from a state-policy table — verify with the county assessor before closing.
Climate risk First Street
- Flood 1/10 Low FEMA zone X (unshaded) · 0% chance over 30 yrs
- Wildfire 1/10 Low
- Heat 10/10 Extreme 7 d/yr ≥106°F today · 25 d/yr by 30 yrs out
- Wind 10/10 Extreme 99% chance of damaging wind over 30 yrs
- Air quality 2/10 Low 1 unhealthy d/yr today · 1 by 30 yrs out
Nearby sold comps map
Loading sold comps map…
Walkable amenities ~0.75 mi
Loading nearby amenities…
Taxation est. · year 1
- Rental income
- $25,540
- − Mortgage interest
- −$10,637
- − Property taxes
- −$804
- − Insurance
- −$950
- − Repairs & maintenance
- −$2,043
- − Management
- −$2,043
- − Depreciation
- −$5,524
- Taxable income
- $3,539
- Est. tax owed @ 24.0%
- −$849
- After-tax cash flow
- $5,624/yr
For passive investors: Depreciation is non-cash, so a rental often shows a tax loss while cash-flowing — sheltering income. Rental losses are passive: they offset passive income freely, and up to $25,000/yr can offset ordinary (W-2) income if you actively participate and your MAGI is under $100k (phasing out to $0 by $150k); unused losses carry forward. On sale, claimed depreciation is recaptured at up to 25%, and gains may owe capital-gains tax (a 1031 exchange can defer both). Figures are a year-1 estimate at your 24.0% rate — not tax advice; consult a CPA.
Schools (NCES district)
- District
- St. Lucie
- NCES district ID
- 1201770
- Math proficiency
- 40% ▼ -11.00%
- Reading proficiency
- 48% ▼ -4.00%
- Median HH income
- $44,737
- Composite
- 37.28/100
- National rank
- #4449
- State rank
- #51 of 73 in FL
Livability — Fort Pierce
- Score
- 76/100
- State rank
- #226
- US rank
- #3360
Category grades
Schools grade is shown separately in the Schools card above.
Census & demographics
- Census place
- Fort Pierce, FL
- County
- Saint Lucie County · 337,150 people
- City population
- 78,556
- Metro
- Port St. Lucie, FL
- Population (ZIP)
- 17,461
- Household income
- $30,400
- Rent vs Own
- Severe rent burden
- 1995.0
Population outlook (St. Lucie County) Hauer SSP2
- Today (2025)
- 338,016 people
- By 2030
- 355,687 · +5.2%
- By 2040
- 385,521 · +14.1%
- By 2050
- 406,106 · +20.1%
- By 2075
- 441,054 · +30.5%
- By 2100
- 436,885 · +29.2%
Race, ethnicity, and origin ACS 2023
- Neighborhood character
- Majority Black (63%)
- Race & ethnicity
- Black 63% Hispanic / Latino 19% White 17% Two or more races 10%
- Hispanic origin (detail)
- Mexican 10% Puerto Rican 2% Cuban 1%
- Common ancestry
- Hispanic 17% Portuguese 1%
- Foreign-born
- 23% · Canada
- Languages at home
- 69% English-only · Spanish 14% French/Haitian/Cajun 12% Other Indo-European 4%
Political lean MEDSL · St. Lucie
- 2024 margin
- Lean R (+9.1) · D 45.1% · R 54.2%
- 2008→2024 swing
- -21.2pp toward R · 2008: 12.1pp · 2024: -9.1pp
- All cycles
- 2024: R+9.1 2020: R+1.6 2016: R+2.5 2012: D+7.9 2008: D+12.1
Not yet ingested
- Civics
- —
Market trends
- HPI YoY
- ▼ -97.20%
- Current HPI
- 384.8532
- Rent YoY
- ▲ 5.94%
- Metro
- Port St. Lucie, FL
- State GDP YoY
- ▲ 3.28%
- F500 in state
- 36
Industry mix (Fortune 500 HQ in FL)
| Industry | F500 HQs | Revenue |
|---|---|---|
| Industrial Technology | 2 | $29B |
|
||
| Insurance | 2 | $17B |
|
||
| Retail | 1 | $60B |
|
||
| Technology Distribution | 1 | $58B |
|
||
| Homebuilding | 1 | $35B |
|
||
| Technology Manufacturing | 1 | $35B |
|
||
Price history
2 events — show timeline
- 2026-05-21 Pending — Beaches MLS
- 2026-05-17 Listed $189,900 Beaches MLS
Property tax history
+0.4%/yrLatest (2025): $804 · +5.7% YoY. Source: county tax records.
Cash-flow waterfall
monthlySold comps — $/sqft
last 12 mo · ≤1 miLoading sold comps…