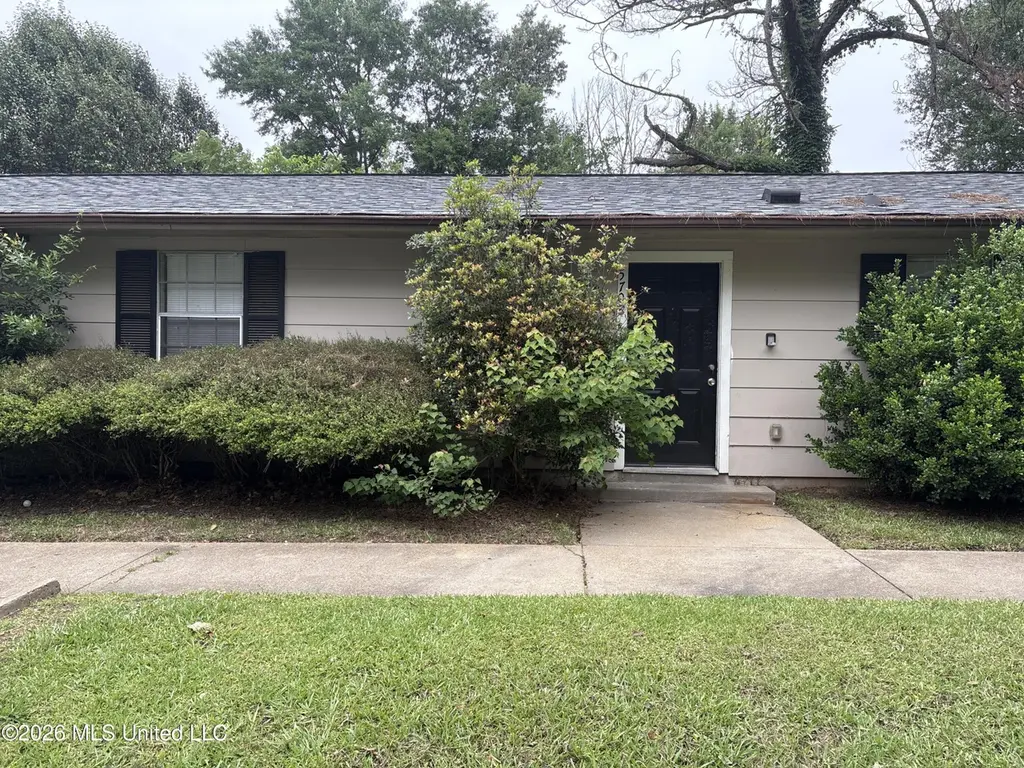
 Duplex
5708 Orchard View Dr · Jackson, MS
Flood risk No data
- FEMA flood zone
- —
- Chance of flooding over 30 yrs
- —
- Est. flood insurance / yr
- —
Fire risk No data
- Est. fire insurance / yr
- —
Heat risk No data
- Hot days now (above threshold)
- —
- Hot days in 30 yrs
- —
Wind risk No data
- Chance of severe wind over 30 yrs
- —
Air-quality risk No data
- Unhealthy air days now
- —
- Unhealthy air days in 30 yrs
- —
Risk factors via First Street. Map © Google.
Why this score? — see what drove the C+ grade
The composite is a weighted blend of 9 inputs, each scored 0–100. Each bar is that input's sub-score; the figure is the points it added to the 100-point composite (weight × sub-score).
- Cash flow +27.2/30.0
- DSCR +9.5/10.0
- ARV discount +7.5/15.0
- 1% rule +7.4/10.0
- Rent growth +4.5/5.0
- Livability +3.4/5.0
- Condition / age +2.8/5.0
- Schools +1.1/10.0
- Appreciation +0.0/10.0
$219,900
🖨 Deal sheet (PDF) 📄 Offer letter ✓ Due diligence
Multi-family units
County records classify this as Multi-Family (2-4 Unit). Listing-text estimate: 2 units. confirmed
Listing remarks
Welcome to this charming mid-century duplex in the heart of Northeast Jackson's Ridgewood Park! Built in 1954, this 1,842 sq. ft. home offers a perfect blend of vintage character and practical design. The exterior features classic brick veneer and sits on a level, 0.26-acre rectangular lot with a private backyard. Inside, both units offer an efficient layout with spacious living areas and kitchens plumbed for natural gas. Central air and heat provide year-round comfort. Parking is convenient with an attached carport and concrete driveway, making this duplex as functional as it is inviting.
Key facts
- Private backyard
- Central air and heat
- Brick veneer
Tags
Property features AI
Finance
- HOA & community: Near entertainment and park; Street lights in the area
Exterior
- Parking: Attached parking; 1-car carport; Driveway (no garage); Total parking for 1 vehicle
- Utilities: Public water; Public sewer; Electricity connected; Natural gas connected; Cable connected
- Home design: House; One level
- Construction: Brick, brick veneer, and wood siding exterior; Asphalt shingle roof; Slab foundation; Built per public records
- Exterior features: Front porch; Rear porch; Patio; Slab; Outdoor lighting; Private yard; Rain gutters; Chain link fencing; City lot with front yard; level
Interior
- Kitchen: Dishwasher; Electric range; Freestanding refrigerator; Microwave
- Bedrooms: Primary bedroom (Main level) — approximately 11 x 12; Second bedroom (Main level) — approximately 10 x 11
- Flooring: Ceramic tile; Vinyl; Wood
- Bathrooms: 2 full bathrooms
- Heating & cooling: Central heating (natural gas); Central air (electric)
- Interior features: Ceiling fans; Eat-in kitchen; High-speed internet; Laminate countertops; Total of 2 rooms
- Laundry & utility: Washer hookup; Electric dryer hookup
Neighborhood map
What this means for you Summary
Snapshot
- This is a 2 × 2-bed/1.0-bath units multifamily listed at $220k. Condition is rated average.
Deal economics
- At list price, monthly cash flow is $632 ($8k/yr) — positive. Per door: $316/mo.
- The deal already cash-flows at list — no discount required.
- Meets the 1% rule at list price ($3k rent vs $220k).
- Recommended offer: $213k (3.0% below list) — sets the bar for market timing.
Location & tenants
- Location reads 68/100 on livability (#66 in MS) — a middle-class / working-renter tenant base. Strengths: commute A+, cost of living A+, housing A+; Watch: amenities F, employment F, health & safety F.
- Jackson Public School District (urban): math 9% / reading 18% proficiency, ranked #112 of 130 in MS (top 86%) — low school quality limits family demand, transient renter base, plan for 1-2y turnover; 88% free/reduced lunch — lower-income household profile, screen leases tightly.
- Zoned schools: Spann Elementary School (math 7% / reading 21%, grade F, #289 of 375 statewide, top 78%, 395 students, 100% FRL); Kirksey Middle School (math 7% / reading 13%, grade F, #152 of 179 statewide, top 88%, 247 students, 100% FRL); Murrah High School (math 12% / reading 27%, grade F, #130 of 197 statewide, top 68%, 1,326 students, 100% FRL).
- Market conditions: Rents rising fast (+7.9%/yr); 222 active listings in the ZIP; 21 comparable units currently listed for rent nearby; rentals at typical pace (median 24d on market — plan ~3-4 weeks tenant-placement turnaround); 167 units permitted in Hinds County in 2024 (0 in 5+ unit buildings).
- At $2,724/mo this rent would consume 47% of the median local household income ($69k/yr) (locally 736% of renters already pay >50% of income on rent) — very limited rent-growth headroom before tenants either downsize or default.
Forward outlook
- Local home prices are declining (-3.0%/yr); year-one equity from $2k of loan paydown is wiped out by about $7k of value loss. Plan a longer hold.
- Hinds County population projected to shrink 6% by 2050 — rents likely to lag national; underwrite the cash flow, not the appreciation.
- At projected returns (-3.0% appreciation + 7.9% rent growth), your $62k cash investment doubles in ~7 years — after that, you're playing with house money.
Negotiation context
- It's been on market 39 days — a 3% lower offer ($213k) is reasonable based on typical stale-listing flexibility.
Risks & watch-outs
- Watch-outs: built in 1954 — expect roof / HVAC / electrical / plumbing capex.
Questions for the listing agent
- It's been on market 39 days. Have you received any prior offers? Is the seller open to a 3% concession, seller financing, or rate buy-down credit?
- Can we see the unit-by-unit rent roll, current vacancy, and any below-market leases? What's the average tenancy length?
- What capital expenditures (roof, boiler, parking lot, exteriors) have been made in the last 5 years, and what's planned in the next 2?
- Built in 1954 — when were the roof, HVAC, electrical panel, plumbing, and water heater last replaced?
- Is there a deadline driving the sale (1031 exchange, divorce, estate, relocation)? That informs how much negotiation room exists.
- Schools are F-rated, which usually means shorter tenancies and higher turnover. Who's the typical renter profile here, and what's been the actual vacancy rate?
- What's the average days-on-market for RENTAL listings here right now (not sales)? A rising rental-DOM trend means longer vacancies and softer asking-rent achievability than the comps imply.
- What's the recent tenant-quality profile in this submarket — average credit score on applications, eviction rate, late-payment / NSF rate, and stable-employment percentage? A property-management company in the area should have these aggregated.
- How much new apartment / multifamily construction is in the pipeline within 1–3 miles? Heavy new supply (>2% of stock underway) typically softens rents 12–24 months out; light construction supports rent growth.
Investment metrics
- 1% rule
- 1.24% ✓
- Cap rate
- 9.74%
- Cash-on-cash
- 12.32%
- DSCR
- 1.55
- GRM
- 6.7
CMA / ARV
- ARV (median comp)
- $144,357
- List price
- $219,900
- Delta
- 52.33%
- Verdict
- OVERPRICED
- Comps
- 7 within 2.0 mi
Projected returns pro-forma
-3.0% appreciation · 7.9% rent growth · sell at horizon
- IRR
- 7.4%
- Equity multiple
- 1.30×
- Total profit
- $18,772
- Equity at exit
- $32,788
- IRR
- 20.6%
- Equity multiple
- 3.15×
- Total profit
- $132,380
- Equity at exit
- $19,013
Cash invested: $61,572 (down + closing). Projections, not guarantees.
Landlord ↔ Tenant lean methodology
- Overall (STATE)
- 90 Strongly Landlord-Friendly
- State Mississippi
- 90 Strongly Landlord-Friendly · R+11
- County
- — inherits STATE
- City
- — inherits STATE
ZIP-level market 39211
- Rents YoY
- 7.9%
- Active inventory
- 222
- Price-to-rent
- 13.5×
Monthly cashflow live
- Estimated rent
- $2,724 high interval (Pro) →
- Mortgage (P&I)
- −$1,153
- Tax est. 1.5%
- −$275 /mo · $3,298/yr
- Insurance
- −$92
- HOA
- −$0
- Lot rent
- −$0
- Vacancy / Maint / Mgmt
- −$572
- Net cashflow
- $632
Break-even live
Sensitivity live
| Price | -10% $784 | -5% $708 | +0% $632 | +5% $556 | +10% $480 |
|---|---|---|---|---|---|
| Rent | -10% $417 | -5% $525 | +0% $632 | +5% $740 | +10% $847 |
| Rate | -1.0pp $743 | -0.5pp $688 | base $632 | +0.5pp $575 | +1.0pp $517 |
2-unit breakdown (identical units grouped — click to expand)
| Units | Beds | Baths | Est. rent |
|---|---|---|---|
| 2× units | 2 | 1 | $2,724 |
| #1 | 2 | 1 | $1,362 |
| #2 | 2 | 1 | $1,362 |
| Total (2 units) | $2,724 | ||
UW: 25.0% down · 7.5% · 30yr · 1.5% tax · 5.0% vac · 8.0% maint · 8.0% mgmt
Financing live
Cash to close
- Down payment
- $54,975
- Closing costs
- $6,597
- Reserves months
- —
- Total cash needed
- —
Loan-product check · same deal, 3 products live
Conventional
25% down · 7.5% · 30yr
- Down + closing
- —
- Monthly P&I
- —
- Monthly cashflow
- —
- DSCR
- —
- Eligible?
- —
Personal DTI + credit; lowest rate.
DSCR
20% down · 8.5% · 30yr
- Down + closing
- —
- Monthly P&I
- —
- Monthly cashflow
- —
- DSCR
- —
- Eligible?
- —
No personal income docs; deal must DSCR.
Hard money
10% down · 12.0% · 12mo
- Down + closing
- —
- Monthly P&I
- —
- Monthly cashflow
- —
- DSCR
- —
- Eligible?
- —
Short-term bridge; refi at stabilization.
Rent comps 21 comps
| Address | Beds | Baths | Sqft | Rent | $/sqft | DOM | Units | Dist |
|---|---|---|---|---|---|---|---|---|
| 120 Parkway Dr Jackson, MS | 1.0–3.0 | 1.0–2.0 | 1076 | $2,255 | $2.10 | 16d | 15 | 0.51mi |
| 2009 Lake Trace Dr Jackson, MS | 4.0 | 2.0 | 2028 | $1,950 | $0.96 | 16d | 1 | 0.54mi |
| 5855 Canton Park Dr Jackson, MS | 4.0 | 2.0 | 1955 | $1,675 | $0.86 | 26d | 1 | 0.61mi |
| 5855 Canton Park Dr Jackson, MS | 4.0 | 2.0 | 2401 | $1,675 | $0.70 | 16d | 1 | 0.61mi |
| 119 S Canton Club Cir Jackson, MS | 3.0 | 2.0 | 1444 | $1,595 | $1.10 | 26d | 1 | 0.64mi |
| 47 Moss Forest Cir Jackson, MS | 4.0 | 3.0 | 2624 | $3,000 | $1.14 | 16d | 1 | 0.83mi |
| 1702 Jamestown Way Unit 1702 Jackson, MS | 3.0 | 2.0 | 1465 | $1,495 | $1.02 | 46d | 1 | 0.98mi |
| 117 Rolling Creek Dr Jackson, MS | 4.0 | 2.5 | 2459 | $2,700 | $1.10 | 26d | 1 | 1.04mi |
| 5538 Pine Lane Dr Jackson, MS | 3.0 | 2.0 | 1627 | $1,465 | $0.90 | 46d | 1 | 1.06mi |
| 51 Northtown Dr Unit 001G Jackson, MS | 3.0 | 2.0 | 1260 | $1,449 | $1.15 | 16d | 1 | 1.10mi |
| 5544 Wayneland Dr Jackson, MS | 3.0 | 2.0 | 1800 | $1,831 | $1.02 | 46d | 1 | 1.11mi |
| 1620 E County Line Rd Ridgeland, MS | 1.0–3.0 | 1.0–2.5 | 1126 | $1,595 | $1.42 | 16d | 7 | 1.14mi |
| 5301 Ridgewood Rd Jackson, MS | 3.0 | 2.0 | 1482 | $1,850 | $1.25 | 46d | 1 | 1.27mi |
| 51 Northtown Dr Unit 001B Jackson, MS | 3.0 | 2.0 | 1260 | $1,499 | $1.19 | 16d | 1 | 1.33mi |
| 51 Northtown Dr Unit 021A Jackson, MS | 3.0 | 2.0 | 1500 | $1,694 | $1.13 | 23d | 1 | 1.33mi |
| 51 Northtown Dr Unit 002G Jackson, MS | 3.0 | 2.0 | 1260 | $1,644 | $1.30 | 46d | 1 | 1.33mi |
| 51 Northtown Dr Unit 001F Jackson, MS | 3.0 | 2.0 | 1260 | $1,644 | $1.30 | 16d | 1 | 1.33mi |
| 492 E Beasley Rd Jackson, MS | 1.0–3.0 | 1.0–2.0 | 1133 | $1,440 | $1.27 | 16d | 8 | 1.41mi |
| 35 Meadowoods Ter Jackson, MS | 3.0 | 2.0 | 1269 | $1,450 | $1.14 | 26d | 1 | 1.41mi |
| 5125 Old Canton Rd Jackson, MS | 3.0 | 3.0 | 2025 | $2,100 | $1.04 | 26d | 1 | 1.43mi |
| 212 Pimlico Pl Jackson, MS | 3.0 | 2.0 | 1600 | $900 | $0.56 | 16d | 1 | 1.45mi |
Listing history 19 events
-
2026-06-23days on market $219,900 Active 39 DOM
-
2026-06-22days on market $219,900 Active 38 DOM
-
2026-06-18days on market $219,900 Active 35 DOM
-
2026-06-17days on market $219,900 Active 34 DOM
-
2026-06-16days on market $219,900 Active 33 DOM
-
2026-06-15days on market $219,900 Active 32 DOM
-
2026-06-14days on market $219,900 Active 30 DOM
-
2026-06-13days on market $219,900 Active 29 DOM
-
2026-06-10days on market $219,900 Active 27 DOM
-
2026-06-09days on market $219,900 Active 26 DOM
-
2026-06-08days on market $219,900 Active 25 DOM
-
2026-06-07days on market $219,900 Active 24 DOM
-
2026-06-05days on market $219,900 Active 21 DOM
-
2026-06-03days on market $219,900 Active 20 DOM
-
2026-06-02days on market $219,900 Active 19 DOM
-
2026-06-01days on market $219,900 Active 18 DOM
-
2026-05-31days on market $219,900 Active 17 DOM
-
2026-05-30days on market $219,900 Active 16 DOM
-
2026-05-14$219,900 Active 597-char remark
ⓘ Source: listings_history table (triggers on properties + properties_extension) + one-shot
backfill from property_details.listing_events for pre-trigger history.
Nearby sold comps map
Loading sold comps map…
Walkable amenities ~0.75 mi
Loading nearby amenities…
Taxation est. · year 1
- Rental income
- $32,688
- − Mortgage interest
- −$12,318
- − Property taxes
- −$3,298
- − Insurance
- −$1,100
- − Repairs & maintenance
- −$2,615
- − Management
- −$2,615
- − Depreciation
- −$6,397
- Taxable income
- $4,345
- Est. tax owed @ 24.0%
- −$1,043
- After-tax cash flow
- $6,545/yr
For passive investors: Depreciation is non-cash, so a rental often shows a tax loss while cash-flowing — sheltering income. Rental losses are passive: they offset passive income freely, and up to $25,000/yr can offset ordinary (W-2) income if you actively participate and your MAGI is under $100k (phasing out to $0 by $150k); unused losses carry forward. On sale, claimed depreciation is recaptured at up to 25%, and gains may owe capital-gains tax (a 1031 exchange can defer both). Figures are a year-1 estimate at your 24.0% rate — not tax advice; consult a CPA.
Condition & rehab AI · 7 photos
This mid-century duplex offers a blend of vintage charm and practical design, but requires moderate updates to enhance its curb appeal and interior aesthetics.
Repairs flagged
- Moderate exterior siding — moderate wear
- Minor kitchen cabinets — dated design
- Minor bathroom fixtures — basic design
Value-add opportunities
- Both paint interior walls — enhances curb appeal and interior aesthetics
- Both replace kitchen cabinets — modernizes the space and increases appeal
- Both update bathroom fixtures — modernizes the space and increases appeal
Renovation cost estimate screening
| Repair item | Severity | Est. cost |
|---|---|---|
| exterior siding · moderate wear | Moderate | $3,000–15,000 |
| kitchen cabinets · dated design | Minor | $500–3,000 |
| bathroom fixtures · basic design | Minor | $500–3,000 |
| Total estimated repair cost · 3 items | $4,000–21,000 |
Value-add ROI direction
- Both paint interior walls — enhances curb appeal and interior aesthetics ↑
- Both replace kitchen cabinets — modernizes the space and increases appeal ↑
- Both update bathroom fixtures — modernizes the space and increases appeal ↑
ⓘ Cost ranges are severity-bucket heuristics (US national rule-of-thumb). Get contractor quotes + a written scope before underwriting a rehab budget.
Schools (NCES district)
- District
- Jackson Public School District
- NCES district ID
- 2802190
- Math proficiency
- 9% ▼ -14.00%
- Reading proficiency
- 18% ▼ -7.00%
- Median HH income
- $33,234
- Composite
- 10.89/100
- National rank
- #9755
- State rank
- #112 of 130 in MS
Livability — Jackson
- Score
- 68/100
- State rank
- #66
- US rank
- #9695
Category grades
Schools grade is shown separately in the Schools card above.
Census & demographics
- Census place
- Jackson, MS
- County
- Hinds County · 167,040 people
- City population
- 140,204
- Metro
- Jackson, MS
- Population (ZIP)
- 23,838
- Household income
- $69,426
- Rent vs Own
- Severe rent burden
- 736.0
Population outlook (Hinds County) Hauer SSP2
- Today (2025)
- 242,528 people
- By 2030
- 241,113 · -0.6%
- By 2040
- 235,557 · -2.9%
- By 2050
- 226,946 · -6.4%
- By 2075
- 199,995 · -17.5%
- By 2100
- 164,165 · -32.3%
Race, ethnicity, and origin ACS 2023
- Neighborhood character
- Majority Black (59%)
- Race & ethnicity
- Black 59% White 36% Hispanic / Latino 3% Two or more races 2%
- Common ancestry
- Serbian 2% Italian 2% Slovak 1%
- Foreign-born
- 2% · Canada, China
- Languages at home
- 96% English-only · Spanish 3% Chinese 1%
Political lean MEDSL · Hinds
- 2024 margin
- Solid D (+46.1) · D 72.4% · R 26.3% · Other 1.4%
- 2008→2024 swing
- +7.1pp toward D · 2008: 39.0pp · 2024: 46.1pp
- All cycles
- 2024: D+46.1 2020: D+48.3 2016: D+43.7 2012: D+45.1 2008: D+39.0
Not yet ingested
- Civics
- —
Market trends
- HPI YoY
- ▼ -135.99%
- Current HPI
- 145.5192
- Rent YoY
- ▲ 7.90%
- Metro
- Jackson, MS
- State GDP YoY
- —
- F500 in state
- 0
Price history
1 event — show timeline
- 2026-05-14 Listed $219,900 MLSU
Cash-flow waterfall
monthlySold comps — $/sqft
last 12 mo · ≤1 miLoading sold comps…